Free with trial A logo for a data visualization service, a simple chart bar forming a sharp, singular peak, vector graphic design on a white background, simple minimalistic style, flat color, sunflower yellow color palette, vector graphics, vector illustration, logo, professional logo, logo design, high-quality graphic designer work, logo icon --chaos 30 --ar 16:9 --v 7 Job ID: a54fbe77-4416-47fc-b767-. Decrease statistics vector icon illustrations Yellow Waveform Graph on White Background, Representing Data, Analytics, or Sound. a logo for a data visualization service, a simple chart bar forming a sharp, singular peak, vector graphic design on a white background, simple minimalistic style, flat color, sunflower yellow color palette, vector graphics, vector illustration, logo, professional logo, logo design, high-quality graphic designer work, logo icon --chaos 30 --ar 16:9 --v 7 Job ID: a54fbe77-4416-47fc-b767-
Free with trial Downward arrow, segmented pie chart, and analog clock suggest concepts of time management, data analysis, and decline. Ideal for productivity, efficiency, business, strategy evaluation finance. Decrease statistics vector icon vectors Downward Arrow, Pie Chart, and Clock Representing Time, Decline, and Data Analysis Concept. Downward arrow, segmented pie chart, and analog clock suggest concepts of time management, data analysis, and decline. Ideal for productivity, efficiency, business, strategy evaluation finance
Free with trial Sad face symbolizing dissatisfaction or issues, with data point focus and declining performance graph. Ideal for business analytics, performance drops, feedback, emotions, troubleshooting, reporting. Decrease statistics vector icon illustrations Sad face with declining graph and focus on data highlighting underperformance and issues. Sad face symbolizing dissatisfaction or issues, with data point focus and declining performance graph. Ideal for business analytics, performance drops, feedback, emotions, troubleshooting, reporting
Free with trial Large percentage sign within a speech bubble and a person holding a pointer, pointing at an arrow. Ideal for finance, business, education, statistics, analysis, presentations strategy. Simple flat. Decrease statistics vector icon vectors Financial Presentation With Percentage Sign and Person Explaining Using a Pointer. Large percentage sign within a speech bubble and a person holding a pointer, pointing at an arrow. Ideal for finance, business, education, statistics, analysis, presentations strategy. Simple flat
Free with trial Set of six flat design icons related to time measurement and performance trends isolated on transparent background. Decrease statistics vector icon vectors Collection of flat design time and performance measurement icons. Set of six flat design icons related to time measurement and performance trends isolated on transparent background
Free with trial A minimalist line graph depicts a significant downward trend with a sharp, jagged line indicating a decline. Decrease statistics vector icon illustrations Simple line graph illustrating a sharp downward trend and decline. A minimalist line graph depicts a significant downward trend with a sharp, jagged line indicating a decline
Free with trial Factory building with smokestacks, declining bar graph, gear with downward arrow. Ideal for industry, production, downturn, economy, efficiency challenges automation. Simple flat metaphor. Decrease statistics vector icon vectors Factory with Gears and a Downward Arrow Representing Industrial Decline and Productivity Challenges. Factory building with smokestacks, declining bar graph, gear with downward arrow. Ideal for industry, production, downturn, economy, efficiency challenges automation. Simple flat metaphor
Free with trial Bar chart with descending bars, coin falling, minimal cloud above. Ideal for finance, economy, loss, risk, business investments or savings themes. Simple flat metaphor. Decrease statistics vector icon vectors Decreasing Bar Chart with Dropping Coin Symbolizing Financial Decline and Economic Challenges. Bar chart with descending bars, coin falling, minimal cloud above. Ideal for finance, economy, loss, risk, business investments or savings themes. Simple flat metaphor
Free with trial This image showcases a large collection of minimalist, line-style icons representing various charts and graphs. These icons depict data visualization elements commonly used in business, analytics, and reporting. high-quality professional. Decrease statistics vector icon vectors Collection of diverse line style charts and graphs icons displayed neatly. This image showcases a large collection of minimalist, line-style icons representing various charts and graphs. These icons depict data visualization elements commonly used in business, analytics, and reporting. high-quality professional
Free with trial Profit Decline simple icons set designed in filled, outline, line and stroke style. Decrease statistics vector icon vectors Profit Decline simple icons set designed in filled and stroke style. Profit Decline simple icons set designed in filled, outline, line and stroke style
Free with trial A minimalist graphic featuring two opposing arrows, one pointing up and the other down, separated by a thick vertical line. The upward-pointing arrow is composed of a dark gray triangle atop a lighter gray rectangle, while the downward-pointing arrow consists of a dark blue triangle below a light blue rectangle. This clean design symbolizes concepts like comparison, contrast, growth, decline, progress, and regression, making it ideal for presentations, infographics, and digital interfaces. Decrease statistics vector icon illustrations Up and Down Arrows with Vertical Divider. A minimalist graphic featuring two opposing arrows, one pointing up and the other down, separated by a thick vertical line. The upward-pointing arrow is composed of a dark gray triangle atop a lighter gray rectangle, while the downward-pointing arrow consists of a dark blue triangle below a light blue rectangle. This clean design symbolizes concepts like comparison, contrast, growth, decline, progress, and regression, making it ideal for presentations, infographics, and digital interfaces.
Free with trial Rejection, negative feedback, failure, financial loss, poor performance, declining trends. Hand raised in stop gesture, sad face and declining bar graph. Rejection and negative feedback concept. Decrease statistics vector icon illustrations Hand Gesture with Sad Face and Declining Bar Graph Rejection, Negative Trends, or Failure Concepts. Rejection, negative feedback, failure, financial loss, poor performance, declining trends. Hand raised in stop gesture, sad face and declining bar graph. Rejection and negative feedback concept
Free with trial This image presents a visual representation of fluctuating percentages a common motif in discussions about market trends economic shifts and financial performance. The composition features a series of upward and downward pointing arrows paired with percentage symbols conveying the dynamic nature of change and volatility. The red and black colors create a clear distinction between positive and. Decrease statistics vector icon vectors Fluctuating Percentages Illustrating Market Trends and Economic Shifts in Detail. This image presents a visual representation of fluctuating percentages a common motif in discussions about market trends economic shifts and financial performance. The composition features a series of upward and downward pointing arrows paired with percentage symbols conveying the dynamic nature of change and volatility. The red and black colors create a clear distinction between positive and
Free with trial An illustrative financial graph depicting a significant downward trend. A prominent red arrow emphasizes the decline, cutting through a black line chart with a shaded area, set against a backdrop of subtle candlestick patterns and a grid. This image effectively conveys concepts of economic recession, market loss, falling stock prices, and business challenges. Ideal for financial news, reports, and presentations on market analysis or investment risks. Decrease statistics vector icon vectors Financial Market Downturn Graph with Red Arrow. An illustrative financial graph depicting a significant downward trend. A prominent red arrow emphasizes the decline, cutting through a black line chart with a shaded area, set against a backdrop of subtle candlestick patterns and a grid. This image effectively conveys concepts of economic recession, market loss, falling stock prices, and business challenges. Ideal for financial news, reports, and presentations on market analysis or investment risks.
Free with trial Decline Chart simple icons set designed in filled, outline, line and stroke style. Decrease statistics vector icon vectors Decline Chart simple icons set designed in filled and stroke style. Decline Chart simple icons set designed in filled, outline, line and stroke style
Free with trial Decline Chart simple icons set designed in filled, outline, line and stroke style. Decrease statistics vector icon vectors Decline Chart simple icons set designed in filled and stroke style. Decline Chart simple icons set designed in filled, outline, line and stroke style
Free with trial A clean and minimalist illustration featuring a set of fundamental mathematical symbols in black against a pure white background. The symbols include plus (+), minus (-), division (�), multiplication (�), and equals ( ). This versatile graphic is ideal for educational materials, financial reports, business presentations, technology interfaces, or any design requiring clear representation of arithmetic operations, problem-solving, or logical concepts. Its simple design ensures high readability and adaptability across various media. Decrease statistics vector icon illustrations Basic Mathematical Symbols Set on White Background. A clean and minimalist illustration featuring a set of fundamental mathematical symbols in black against a pure white background. The symbols include plus (+), minus (-), division (�), multiplication (�), and equals ( ). This versatile graphic is ideal for educational materials, financial reports, business presentations, technology interfaces, or any design requiring clear representation of arithmetic operations, problem-solving, or logical concepts. Its simple design ensures high readability and adaptability across various media.
Free with trial A clean line drawing showcases a magnifying glass focusing on a hand holding a declining bar graph with a downward. Decrease statistics vector icon illustrations Declining Market Analysis Magnifying Glass on Loss Trend. A clean line drawing showcases a magnifying glass focusing on a hand holding a declining bar graph with a downward.
Free with trial Sales performance, data analysis, business strategy, financial downturn, decision making, marketing insights. Arrow pointing down with sale text, charts check mark. Sales performance and data. Decrease statistics vector icon vectors Sales Analytics and Performance Metrics with Downward Trends and Checkmark. Sales performance, data analysis, business strategy, financial downturn, decision making, marketing insights. Arrow pointing down with sale text, charts check mark. Sales performance and data
Free with trial A black and white line drawing depicts a magnifying glass focusing on a gear, a descending bar graph, and a. Decrease statistics vector icon illustrations Decline Analysis Magnifying Glass, Gear, and Downward Graph. A black and white line drawing depicts a magnifying glass focusing on a gear, a descending bar graph, and a.
Free with trial A downward trending bar graph with a question mark is examined under a magnifying glass, symbolizing uncertainty and. Decrease statistics vector icon illustrations Decreasing Chart Under Magnifying Glass with Question Mark. A downward trending bar graph with a question mark is examined under a magnifying glass, symbolizing uncertainty and.
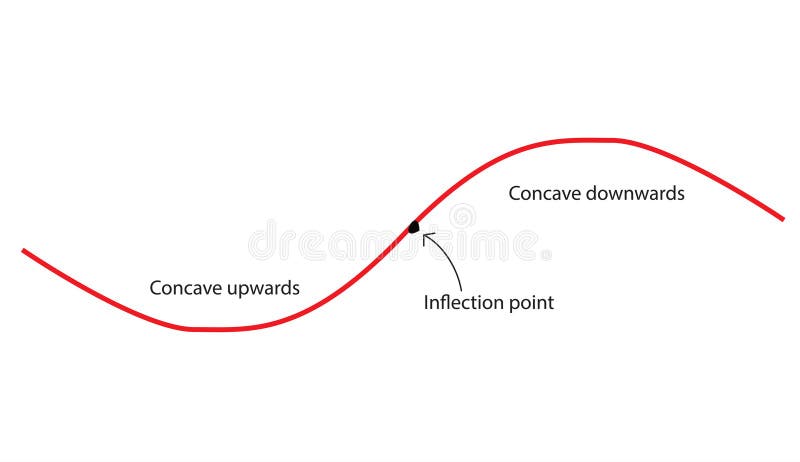
Free with trial Concavity of curve. Inflection point, concave down and concave up. Second derivative tangent lines of function. Decrease statistics vector icon vectors Concavity of curve
Free with trial A simple black and red bar chart displays data with varying heights on a white background. Decrease statistics vector icon illustrations Simple Bar Chart with One Red Bar on White Background graph data. A simple black and red bar chart displays data with varying heights on a white background
Free with trial A magnifying glass focuses on a downward trend graph and briefcase, symbolizing economic downturn analysis and market. Decrease statistics vector icon illustrations Economic Downturn Analysis Magnifying Glass on Market Decline. A magnifying glass focuses on a downward trend graph and briefcase, symbolizing economic downturn analysis and market.
Free with trial A black graph displays a downward curving line within a rectangular frame. Clear details and vibrant colors en. Decrease statistics vector icon illustrations Black graph showing a downward curve within a frame chart decline. A black graph displays a downward curving line within a rectangular frame. Clear details and vibrant colors en
Free with trial Line graph with downward trend alongside sad face. Ideal for performance loss, business challenges, failure, analysis, recession, disappointment, frustration. Simple flat metaphor. Decrease statistics vector icon vectors Declining Line Graph with Sad Face Representing Negative Trend and Disappointment. Line graph with downward trend alongside sad face. Ideal for performance loss, business challenges, failure, analysis, recession, disappointment, frustration. Simple flat metaphor
Free with trial Businessman with downward graph indicating financial decline, recession, and negative growth. Ideal for economic analysis, loss reporting, and business downturn visuals. Decrease statistics vector icon vectors Business decline graph with downward arrow showing financial loss recession and negative growth concept. Businessman with downward graph indicating financial decline, recession, and negative growth. Ideal for economic analysis, loss reporting, and business downturn visuals
Free with trial Bar chart representation of data increase growth and finance. Data analysis. Decrease statistics vector icon vectors Bar chart representation of data increase growth and finance. Data analysis
Free with trial 3d blue magnifying glass with downward-trending chart inside Financial analysis, economic decline, risk assessment, market monitoring, investment evaluation concept Low poly digital futuristic Vector. Decrease statistics vector icon vectors 3d blue magnifying glass with downward-trending chart inside Financial analysis, economic decline, risk assessment
Free with trial This image features three bold, three-dimensional arrows pointing sharply downward, each rendered in distinct vibrant colors�'blue, yellow, and red�'symbolizing a significant market downturn, financial loss, or economic decline, set against a clean, minimalist white background that enhances their striking visual impact and conveys urgency and negative momentum in business, trading, or investment. Decrease statistics vector icon illustrations Colorful downward trending financial arrows in blue yellow and red illustrating market decline and economic downturn concepts. This image features three bold, three-dimensional arrows pointing sharply downward, each rendered in distinct vibrant colors�'blue, yellow, and red�'symbolizing a significant market downturn, financial loss, or economic decline, set against a clean, minimalist white background that enhances their striking visual impact and conveys urgency and negative momentum in business, trading, or investment
Free with trial Inflation pictogram group. Set of growth and fall signs, income and profit signs. Dollar sign. Charts, notifications, messages. Decrease statistics vector icon vectors Inflation pictogram group. Set of growth and fall signs, income and profit signs. Dollar sign. Charts, notifications, messages.
Free with trial Businessman presenting falling chart indicating financial decline and loss. Ideal for analytics, reporting, and economic downturn presentations. Decrease statistics vector icon vectors Business decline presentation with downward chart representing financial loss analysis and negative growth. Businessman presenting falling chart indicating financial decline and loss. Ideal for analytics, reporting, and economic downturn presentations
Free with trial A black upward arrow merges into a downward curving line graph on a white background. Decrease statistics vector icon illustrations Black upward arrow and downward curve graph on white background chart. A black upward arrow merges into a downward curving line graph on a white background
Free with trial Black and white line graph comparing nominal and real return over time with axes labeled. Decrease statistics vector icon illustrations Black and white line graph showing nominal and real return over time chart nominal return. Black and white line graph comparing nominal and real return over time with axes labeled
Free with trial Downward arrow, swirling line with blue concentric circles, and percentage symbol suggest falling rates. Ideal for finance, economy, interest, discount, marketing statistics cost management. Flat. Decrease statistics vector icon vectors Declining Percentage Rate Represented by Downward Arrow and Percentage Symbol. Downward arrow, swirling line with blue concentric circles, and percentage symbol suggest falling rates. Ideal for finance, economy, interest, discount, marketing statistics cost management. Flat
Free with trial Sad face near decreasing graph alongside warning triangle and green leaves conveying climate, environment, conservation, eco-crisis, risk, sustainability, and awareness. Simple flat metaphor. Decrease statistics vector icon illustrations Environmental crisis concept with decrease graph, warning triangle, sad face, and green leaves. Sad face near decreasing graph alongside warning triangle and green leaves conveying climate, environment, conservation, eco-crisis, risk, sustainability, and awareness. Simple flat metaphor
Free with trial Smiling blue face beside a decreasing bar graph, signifying satisfaction, feedback, or performance trends. Ideal for analytics, feedback, emotions, surveys, performance data presentation simple. Decrease statistics vector icon vectors Positive Feedback Represented by Happy Face and Declining Bar Graph. Smiling blue face beside a decreasing bar graph, signifying satisfaction, feedback, or performance trends. Ideal for analytics, feedback, emotions, surveys, performance data presentation simple
Free with trial Graph with a red heart at the start and downward trend line, symbolizing breakup, relationship decline, and emotional loss over time. Decrease statistics vector icon vectors Graph with a red heart at the start and downward trend line, symbolizing breakup, relationship decline, and emotional loss over
Free with trial Blue sad face next to a declining line graph in a calendar frame under a cloud. Ideal for business loss, economic crisis, emotional impact, failure, disappointment, analytics, trends. Simple flat. Decrease statistics vector icon vectors Sad face and declining data chart representing failure, downturn, or negative outcome concept. Blue sad face next to a declining line graph in a calendar frame under a cloud. Ideal for business loss, economic crisis, emotional impact, failure, disappointment, analytics, trends. Simple flat
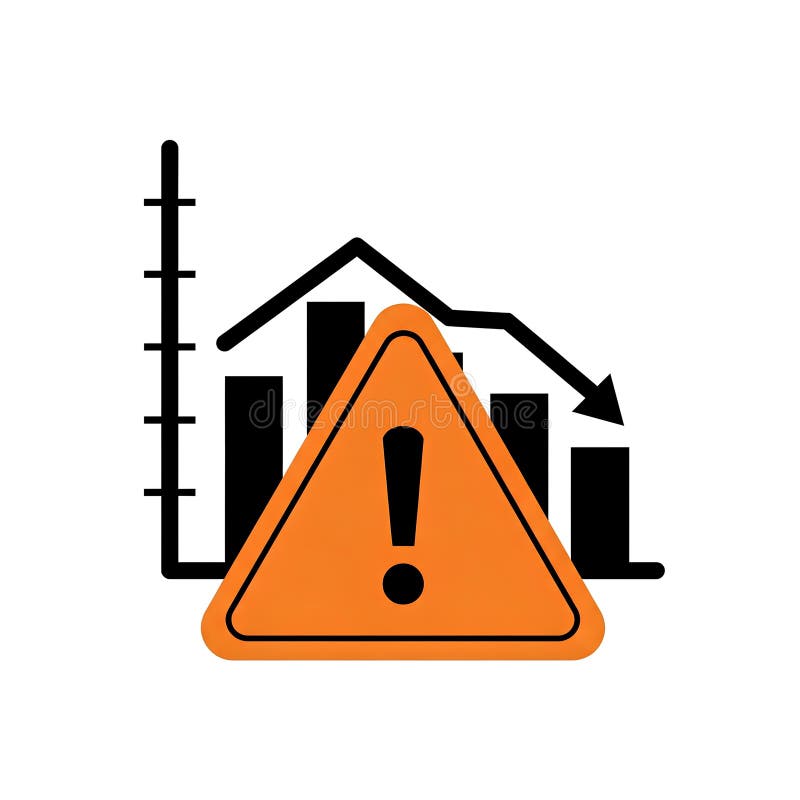
Free with trial Illustration of a downward trending graph with an orange warning sign in the foreground. The graph depicts a decline in performance or value. The warning sign highlights potential risks or negative outcomes. This image can be used to represent financial loss, economic downturn, business failure, or any situation where caution is advised. Decrease statistics vector icon illustrations Warning Sign with Declining Graph. Illustration of a downward trending graph with an orange warning sign in the foreground. The graph depicts a decline in performance or value. The warning sign highlights potential risks or negative outcomes. This image can be used to represent financial loss, economic downturn, business failure, or any situation where caution is advised.
Free with trial Downward arrow, magnifying glass, dollar sign indicate declining trends, financial analysis, revenue downturn. Ideal for business, finance, investment, market trends loss economic study simple. Decrease statistics vector icon vectors Declining Trends in Business Revenue with Analysis and Financial Focus. Downward arrow, magnifying glass, dollar sign indicate declining trends, financial analysis, revenue downturn. Ideal for business, finance, investment, market trends loss economic study simple
Free with trial Abstract illustration of business growth, featuring bar graphs and line graphs in shades of blue and grey. The image conveys concepts of data analysis, progress, and financial performance. Suitable for presentations, reports, and marketing materials related to business, finance, and technology. Decrease statistics vector icon illustrations Abstract Business Growth Chart. Abstract illustration of business growth, featuring bar graphs and line graphs in shades of blue and grey. The image conveys concepts of data analysis, progress, and financial performance. Suitable for presentations, reports, and marketing materials related to business, finance, and technology.
Free with trial Magnifying glass highlights poor analytics on chart, signed document, and sad emotion. Ideal for business, analytics, decline, review, research productivity failure. Simple flat metaphor. Decrease statistics vector icon illustrations Analysis of Declining Trends with Signed Document and Performance Chart. Magnifying glass highlights poor analytics on chart, signed document, and sad emotion. Ideal for business, analytics, decline, review, research productivity failure. Simple flat metaphor
Free with trial Black bars decreasing in height diagonally on a white background, representing a downward trend or decline. Decrease statistics vector icon illustrations Black bars decreasing in height diagonally on a white background bar chart graph. Black bars decreasing in height diagonally on a white background, representing a downward trend or decline
Free with trial Black silhouette of a descending graph with arrow for business decline concepts. Decrease statistics vector icon vectors Black silhouette of a descending graph with arrow for business decline concepts.
Free with trial Declining graph indicating financial loss, sad face representing disappointment, coin symbolizing money, and cloud metaphor for challenges. Ideal for finance, business troubles, economic downturn. Decrease statistics vector icon vectors Financial Loss Concept with Declining Graph, Sad Face, Coin and Cloud Symbol. Declining graph indicating financial loss, sad face representing disappointment, coin symbolizing money, and cloud metaphor for challenges. Ideal for finance, business troubles, economic downturn
Free with trial Economics, healthcare, pharmaceutical industry, quality certification, cost analysis, success indicators. Blue arrow pointing down, reward ribbon and vials. Economic trends and healthcare industry. Decrease statistics vector icon vectors Graph Downward Arrow, Reward Ribbon, and Medical Vials Concept for Decreasing Medical Costs and Quality Assurance. Economics, healthcare, pharmaceutical industry, quality certification, cost analysis, success indicators. Blue arrow pointing down, reward ribbon and vials. Economic trends and healthcare industry
Free with trial A black line graph with two curves showing a downward trend on a white background. Decrease statistics vector icon illustrations Black line graph showing a downward trend with two lines on white background chart. A black line graph with two curves showing a downward trend on a white background
Free with trial Percentage symbol combined with rotating curved arrow representing rate change concept on white background. Decrease statistics vector icon vectors Percentage symbol combined with rotating curved arrow representing rate change concept
Free with trial A minimalist dark gray bar chart on a white background displays varying heights, illustrating data fluctuations and trends. Decrease statistics vector icon illustrations Simple bar chart showing increasing and decreasing data trends. A minimalist dark gray bar chart on a white background displays varying heights, illustrating data fluctuations and trends
Free with trial Downward arrow pointing alongside a falling dollar coin with a cloud above. Ideal for finance, economics, loss, investment, risk, business, savings, simple flat metaphor. Decrease statistics vector icon vectors Downward Arrow and Dollar Coin Representing Financial Decline or Economic Loss. Downward arrow pointing alongside a falling dollar coin with a cloud above. Ideal for finance, economics, loss, investment, risk, business, savings, simple flat metaphor
Free with trial Line chart tracks data trends over time, with a downward arrow implying decline and a globe representing global impact. Ideal for analytics, performance, global strategy, tracking, economics, market. Decrease statistics vector icon illustrations Line Chart with Data Points, Downward Arrow, and Globe for Analysis and Global Trends. Line chart tracks data trends over time, with a downward arrow implying decline and a globe representing global impact. Ideal for analytics, performance, global strategy, tracking, economics, market
Free with trial Colorful bar graph with downward trend, business concept illustration. Decrease statistics vector icon vectors Colorful bar graph with downward trend, business concept illustration
Free with trial Line graph with downward trend, sad face for dissatisfaction, alert bell for warning, and magnifier symbolizing evaluation. Ideal for data analysis, performance tracking, decline, warning, failure. Decrease statistics vector icon vectors Declining Graph with Sad Face, Alert Bell, and Magnifier Indicating Negative Trends. Line graph with downward trend, sad face for dissatisfaction, alert bell for warning, and magnifier symbolizing evaluation. Ideal for data analysis, performance tracking, decline, warning, failure
Free with trial Computer screen displaying a webinar with a presenter explaining graphs and charts, recording indicators, audio, and HD video tags. Ideal for e-learning, remote work, business, analytics. Decrease statistics vector icon vectors Online Webinar on Business Metrics with Recording and Data Analytics Representation. Computer screen displaying a webinar with a presenter explaining graphs and charts, recording indicators, audio, and HD video tags. Ideal for e-learning, remote work, business, analytics
Free with trial Red sad face beside a line graph showing a downward trend and a bar graph. Ideal for business loss, economic decline, performance issues, challenges, setbacks, analytics, trends. Simple flat metaphor. Decrease statistics vector icon vectors Declining Chart with Sad Face and Bar Graph Representing Negative Trend and Challenges. Red sad face beside a line graph showing a downward trend and a bar graph. Ideal for business loss, economic decline, performance issues, challenges, setbacks, analytics, trends. Simple flat metaphor
Free with trial Blue flat visualization showing bar chart and downward arrow over data grid with world map overlay. Analytics, finance, data analysis, digital, infographic, corporate, trend. Decrease statistics vector icon illustrations Blue flat visualization showing bar chart and downward arrow over data grid with world map overlay
Free with trial A graphic illustrating declining gas prices, featuring a fuel pump and a downward trending red line graph, isolated on a white background. Decrease statistics vector icon illustrations Falling gas prices graph with fuel pump isolated on white background. A graphic illustrating declining gas prices, featuring a fuel pump and a downward trending red line graph, isolated on a white background
Free with trial A simple black and white illustration of a bar chart and a line graph showing business growth trends, isolated on a white background. Decrease statistics vector icon vectors Business growth bar chart and line graph isolated on white background. A simple black and white illustration of a bar chart and a line graph showing business growth trends, isolated on a white background
Free with trial Simple line graph illustrating data points and trends. Ideal for presentations, reports, and infographics related to business analysis, market research, or financial reporting. Decrease statistics vector icon vectors Simple Line Graph, Data Visualization, Business Chart. Simple line graph illustrating data points and trends. Ideal for presentations, reports, and infographics related to business analysis, market research, or financial reporting.
Free with trial Sad face beside declining line graph and bar chart, symbolizing setbacks. Ideal for finance, business, economy, loss, analytics, crisis performance. Simple flat metaphor. Decrease statistics vector icon vectors Negative Trend Line and Declining Bar Chart Representing Business Loss or Financial Downturn. Sad face beside declining line graph and bar chart, symbolizing setbacks. Ideal for finance, business, economy, loss, analytics, crisis performance. Simple flat metaphor
Free with trial Bar graph with declining values, percentage on black square, globe in blue square. Ideal for data, statistics, global business, market trends, finance, analysis research flat simple metaphor. Decrease statistics vector icon vectors Bar chart with decreasing bars alongside percentage and globe icons for data and global analytics. Bar graph with declining values, percentage on black square, globe in blue square. Ideal for data, statistics, global business, market trends, finance, analysis research flat simple metaphor
Free with trial Falling bar chart with up and right arrows illustrating declining business trends. Decrease statistics vector icon vectors Falling bar chart with up and right arrows illustrating declining business trends
Free with trial Downward trend graph with large sad face and woman in casual attire. Ideal for business performance, feedback, failure, regret, decisions, emotions, analytics. Clean simple flat metaphor. Decrease statistics vector icon vectors Declining Trend Graph with Sad Face and Casual Woman Highlighting Failure or Negative Feedback. Downward trend graph with large sad face and woman in casual attire. Ideal for business performance, feedback, failure, regret, decisions, emotions, analytics. Clean simple flat metaphor
Free with trial A vibrant circular chart displaying a twenty percent decrease with bright colors and clean design, ideal for business, finance, and analytics presentations. Decrease statistics vector icon illustrations Colorful Circular Chart with Percentage Reduction in Modern Data Visualization Style. A vibrant circular chart displaying a twenty percent decrease with bright colors and clean design, ideal for business, finance, and analytics presentations
Free with trial A simple black line graph depicts a downward trend with sharp fluctuations on white. Decrease statistics vector icon illustrations Black line graph showing a downward trend on a white background chart. A simple black line graph depicts a downward trend with sharp fluctuations on white
Free with trial Simple line art business icons set featuring a magnifying glass, minus symbol, pie chart, and rising bar graph for financial data analysis. Decrease statistics vector icon vectors Simple line art business icons set featuring a magnifying glass, minus symbol, pie chart, and rising bar graph for
Free with trial Business data is visually represented in black and white through various charts and graphs illustrating growth analysis and strategic planning for financial reporting showing a clear picture of market. Decrease statistics vector icon vectors Black and white business data visualization with charts and graphs showing growth and analysis for financial reporting and. Business data is visually represented in black and white through various charts and graphs illustrating growth analysis and strategic planning for financial reporting showing a clear picture of market
Free with trial A simple bar graph illustrating upward growth and financial success. Ideal for presentations, reports, and website use. Decrease statistics vector icon vectors Upward Trending Bar Graph: Business Growth and Financial Success. A simple bar graph illustrating upward growth and financial success. Ideal for presentations, reports, and website use.
Free with trial Flat design business icons depict various charts, percentage signs, targets, hierarchical diagrams, and coin stacks representing financial growth and data analysis in monochrome. Generative AI. Decrease statistics vector icon vectors Black and white flat design business icons including charts percentage target and money stacks illustrating financial growth and. Flat design business icons depict various charts, percentage signs, targets, hierarchical diagrams, and coin stacks representing financial growth and data analysis in monochrome. Generative AI
Free with trial A cartoon illustration of a man interacting with a bar chart. The man is depicted in a simple, clean style, wearing a blue shirt and brown pants. He is holding a green bar, seemingly adjusting or interacting with the colorful bars displayed on a table. The illustration is suitable for conveying concepts related to data analysis, business, finance, and presentation. Decrease statistics vector icon illustrations Cartoon Man and Bar Chart. A cartoon illustration of a man interacting with a bar chart. The man is depicted in a simple, clean style, wearing a blue shirt and brown pants. He is holding a green bar, seemingly adjusting or interacting with the colorful bars displayed on a table. The illustration is suitable for conveying concepts related to data analysis, business, finance, and presentation.
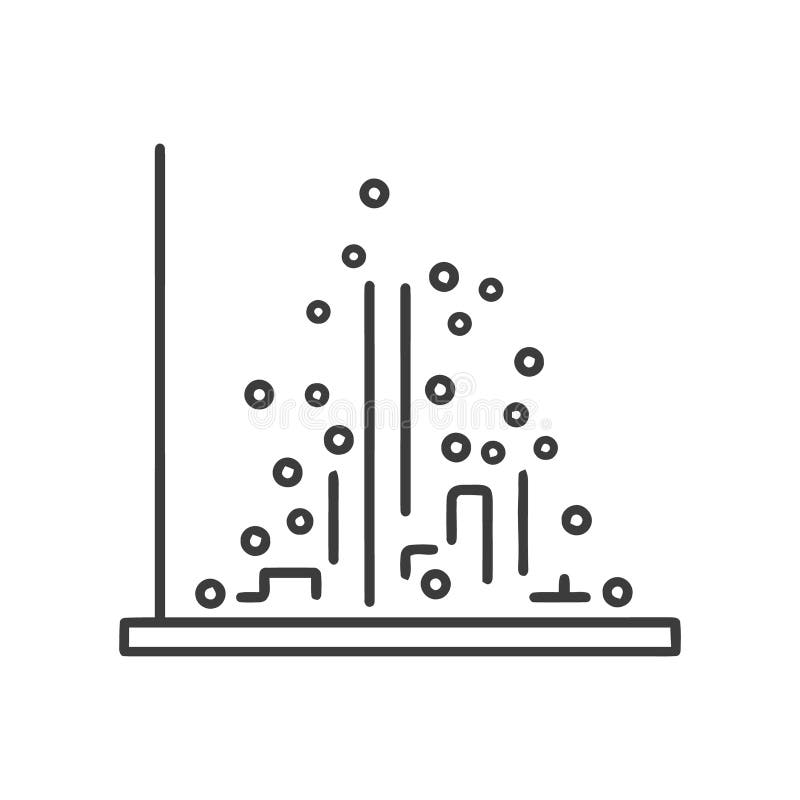
Free with trial Description: Simple line art illustration of a scatter plot graph showing an uneven distribution of data points. Perfect for presentations or reports. Decrease statistics vector icon vectors Abstract Data Visualization: Scatter Plot Chart with Irregular Data Points. Description: Simple line art illustration of a scatter plot graph showing an uneven distribution of data points. Perfect for presentations or reports.
Free with trial An illustration depicts a sad face atop a credit card and rising green bars with upward arrows in a flat design style. Decrease statistics vector icon vectors Financial Burden and Growth: Sad Face with Credit Card and Rising Arrows Concept. An illustration depicts a sad face atop a credit card and rising green bars with upward arrows in a flat design style.
Free with trial A simple yet effective graphic representing a negative trend or declining business chart, perfect for illustrating downward data or economic downturn. Decrease statistics vector icon vectors Negative Trend Graph, Decreasing Business Chart, Downward Data Illustration. A simple yet effective graphic representing a negative trend or declining business chart, perfect for illustrating downward data or economic downturn.
Free with trial This minimalist graphic illustration features a bold red line chart indicating a significant decline. The visual composition uses a clean white background to emphasize the downward trajectory of the data points. The aesthetic is professional and modern, suitable for business presentations or financial reports. Decrease statistics vector icon vectors A red line graph showing a downward trend on a white background. This minimalist graphic illustration features a bold red line chart indicating a significant decline. The visual composition uses a clean white background to emphasize the downward trajectory of the data points. The aesthetic is professional and modern, suitable for business presentations or financial reports
Free with trial A simple flat icon vector illustration of two hands adjusting a simple chart with a downturn arrow, symbolizing risk mitigation in a business setting. The simple chart with a downturn arrow is orange with dark gray elements, indicating loss control. White background. Minimalist style with sharp edges and no shadows. Orange and Gray color palette. Vector graphics with rounded corners. High. Decrease statistics vector icon illustrations Business Downturn Graph Two Hands Hold Downward Trend Chart. A simple flat icon vector illustration of two hands adjusting a simple chart with a downturn arrow, symbolizing risk mitigation in a business setting. The simple chart with a downturn arrow is orange with dark gray elements, indicating loss control. White background. Minimalist style with sharp edges and no shadows. Orange and Gray color palette. Vector graphics with rounded corners. High
Free with trial Simple line art business icons set featuring a magnifying glass, minus symbol, pie chart, and rising bar graph for financial data analysis. Decrease statistics vector icon vectors Simple line art business icons set featuring a magnifying glass, minus symbol, pie chart, and rising bar graph for
Free with trial Colorful Charts and Graphs Data Visualization Infographic. Decrease statistics vector icon illustrations Colorful Charts and Graphs Data Visualization Infographic
Free with trial This minimalist graphic illustration features a bold red line chart indicating a significant decline in value. The visual includes a currency symbol and bar segments set against a clean background to represent economic loss or market downturn. The sharp downward arrow emphasizes a negative trajectory in fiscal data and business analytics. Decrease statistics vector icon vectors A red line graph showing a downward trend in financial performance. This minimalist graphic illustration features a bold red line chart indicating a significant decline in value. The visual includes a currency symbol and bar segments set against a clean background to represent economic loss or market downturn. The sharp downward arrow emphasizes a negative trajectory in fiscal data and business analytics
Free with trial This minimalist graphic illustration features a series of vertical green bars arranged in descending order of height. A bold black diagonal arrow points downwards across the top of the bars, symbolizing a decline or negative performance. The clean design uses a flat aesthetic against a plain background, making it ideal for business presentations or financial reports. Decrease statistics vector icon vectors A simple green bar chart showing a downward trend with a black arrow. This minimalist graphic illustration features a series of vertical green bars arranged in. This minimalist graphic illustration features a series of vertical green bars arranged in descending order of height. A bold black diagonal arrow points downwards across the top of the bars, symbolizing a decline or negative performance. The clean design uses a flat aesthetic against a plain background, making it ideal for business presentations or financial reports