Free with trial Checklist line icon. Neumorphic, Green gradient, 3d pin buttons. Graph chart sign. Growth diagram symbol. Line icons. Neumorphic buttons with outline signs. Vector. Decrease statistics vector icon vectors Checklist line icon. Graph chart sign. Line icons. Vector. Checklist line icon. Neumorphic, Green gradient, 3d pin buttons. Graph chart sign. Growth diagram symbol. Line icons. Neumorphic buttons with outline signs. Vector
Free with trial Graph line icon. Halftone dotted pattern. Gradient icon with grain shadow. Column chart sign. Growth diagram symbol. Line graph chart icon. Various designs. Vector. Decrease statistics vector icon vectors Graph line icon. Column chart sign. Halftone dotted pattern. Vector. Graph line icon. Halftone dotted pattern. Gradient icon with grain shadow. Column chart sign. Growth diagram symbol. Line graph chart icon. Various designs. Vector
Free with trial Diagram chart line icon. Halftone dotted pattern. Gradient icon with grain shadow. Column graph sign. Market analytics symbol. Line diagram chart icon. Various designs. Vector. Decrease statistics vector icon vectors Diagram chart line icon. Column graph sign. Halftone dotted pattern. Vector. Diagram chart line icon. Halftone dotted pattern. Gradient icon with grain shadow. Column graph sign. Market analytics symbol. Line diagram chart icon. Various designs. Vector
Free with trial Web report line icon. Neumorphic, Red gradient, 3d pin buttons. Column graph sign. Growth diagram symbol. Line icons. Neumorphic buttons with outline signs. Vector. Decrease statistics vector icon illustrations Web report line icon. Column graph sign. Line icons. Vector. Web report line icon. Neumorphic, Red gradient, 3d pin buttons. Column graph sign. Growth diagram symbol. Line icons. Neumorphic buttons with outline signs. Vector
Free with trial Graph phone line icon. Neumorphic, Red gradient, 3d pin buttons. Column chart sign. Growth diagram symbol. Line icons. Neumorphic buttons with outline signs. Vector. Decrease statistics vector icon vectors Graph phone line icon. Column chart sign. Line icons. Vector. Graph phone line icon. Neumorphic, Red gradient, 3d pin buttons. Column chart sign. Growth diagram symbol. Line icons. Neumorphic buttons with outline signs. Vector
Free with trial Graph laptop line icon. Neumorphic, Purple gradient, 3d pin buttons. Column chart sign. Growth diagram symbol. Line icons. Neumorphic buttons with outline signs. Vector. Decrease statistics vector icon vectors Graph laptop line icon. Column chart sign. Line icons. Vector. Graph laptop line icon. Neumorphic, Purple gradient, 3d pin buttons. Column chart sign. Growth diagram symbol. Line icons. Neumorphic buttons with outline signs. Vector
Free with trial Growth chart line icon. Neumorphic, Blue gradient, 3d pin buttons. Column graph sign. Market analytics symbol. Line icons. Neumorphic buttons with outline signs. Vector. Decrease statistics vector icon vectors Growth chart line icon. Column graph sign. Line icons. Vector. Growth chart line icon. Neumorphic, Blue gradient, 3d pin buttons. Column graph sign. Market analytics symbol. Line icons. Neumorphic buttons with outline signs. Vector
Free with trial A modern flat design icon representing financial data analysis and market trends. This vector illustration features a combination of a green bar chart and a dark grey line graph, showing fluctuations in performance. An upward arrow indicates initial growth, followed by a volatile trend line symbolizing concepts like market instability, economic changes, profit and loss, or business analytics. This versatile graphic is perfect for infographics, financial reports, presentations, websites, and applications related to business, finance, statistics, and economics. Isolated on a white background for easy use. Decrease statistics vector icon vectors Financial Market Fluctuation Graph Icon. A modern flat design icon representing financial data analysis and market trends. This vector illustration features a combination of a green bar chart and a dark grey line graph, showing fluctuations in performance. An upward arrow indicates initial growth, followed by a volatile trend line symbolizing concepts like market instability, economic changes, profit and loss, or business analytics. This versatile graphic is perfect for infographics, financial reports, presentations, websites, and applications related to business, finance, statistics, and economics. Isolated on a white background for easy use.
Free with trial A clean and modern vector illustration of a percentage sign, featuring two pale yellow circles with maroon outlines and a light blue diagonal bar also outlined in maroon. This simple graphic is set against a crisp white background, making it versatile for various design projects. It effectively conveys concepts of discounts, sales, financial rates, statistics, and promotions. Ideal for use in business presentations, marketing materials, educational content, websites, and mobile applications to highlight numerical data or special offers. Decrease statistics vector icon vectors Percentage Sign Vector Icon Illustration. A clean and modern vector illustration of a percentage sign, featuring two pale yellow circles with maroon outlines and a light blue diagonal bar also outlined in maroon. This simple graphic is set against a crisp white background, making it versatile for various design projects. It effectively conveys concepts of discounts, sales, financial rates, statistics, and promotions. Ideal for use in business presentations, marketing materials, educational content, websites, and mobile applications to highlight numerical data or special offers.
Free with trial Pyramid chart line icon. Neumorphic, Orange gradient, 3d pin buttons. Analytics graph sign. Market analytics symbol. Line icons. Neumorphic buttons with outline signs. Vector. Decrease statistics vector icon vectors Pyramid chart line icon. Analytics graph sign. Line icons. Vector. Pyramid chart line icon. Neumorphic, Orange gradient, 3d pin buttons. Analytics graph sign. Market analytics symbol. Line icons. Neumorphic buttons with outline signs. Vector
Free with trial Decreasing graph line icon. Neumorphic, Green gradient, 3d pin buttons. Column chart sign. Crisis diagram symbol. Line icons. Neumorphic buttons with outline signs. Vector. Decrease statistics vector icon illustrations Decreasing graph line icon. Crisis chart sign. Line icons. Vector. Decreasing graph line icon. Neumorphic, Green gradient, 3d pin buttons. Column chart sign. Crisis diagram symbol. Line icons. Neumorphic buttons with outline signs. Vector
Free with trial Decreasing graph line icon. Neumorphic, Purple gradient, 3d pin buttons. Column chart sign. Market analytics symbol. Line icons. Neumorphic buttons with outline signs. Vector. Decrease statistics vector icon vectors Decreasing graph line icon. Column chart sign. Line icons. Vector. Decreasing graph line icon. Neumorphic, Purple gradient, 3d pin buttons. Column chart sign. Market analytics symbol. Line icons. Neumorphic buttons with outline signs. Vector
Free with trial This minimalist vector illustration features two identical line graphs, presented in contrasting black and white themes. The left graph displays a black line on a white background, while the right shows a white line on a black background. Both graphs depict a clear downward trend with jagged fluctuations, symbolizing decline, loss, or negative growth over time. This versatile icon set is ideal for illustrating concepts such as economic downturns, financial losses, market crashes, business failures, or any data showing a significant decrease. Perfect for presentations, reports, infographics, and web design. Decrease statistics vector icon vectors Declining Line Graph Icon Set - Black and White. This minimalist vector illustration features two identical line graphs, presented in contrasting black and white themes. The left graph displays a black line on a white background, while the right shows a white line on a black background. Both graphs depict a clear downward trend with jagged fluctuations, symbolizing decline, loss, or negative growth over time. This versatile icon set is ideal for illustrating concepts such as economic downturns, financial losses, market crashes, business failures, or any data showing a significant decrease. Perfect for presentations, reports, infographics, and web design.
Free with trial A simple and bold black curved arrow icon, isolated on a clean white background. This minimalist graphic element points downwards and to the right, symbolizing direction, movement, and flow. It can represent concepts such as decline, decrease, or a downward trend in business charts and infographics. This versatile vector-style illustration is perfect for use as a pointer, a navigation symbol in web design and user interfaces, or to guide attention in presentations and documents. The high contrast and clean design make it easy to integrate into any project. Decrease statistics vector icon vectors Curved Black Arrow Pointing Down and Right Icon. A simple and bold black curved arrow icon, isolated on a clean white background. This minimalist graphic element points downwards and to the right, symbolizing direction, movement, and flow. It can represent concepts such as decline, decrease, or a downward trend in business charts and infographics. This versatile vector-style illustration is perfect for use as a pointer, a navigation symbol in web design and user interfaces, or to guide attention in presentations and documents. The high contrast and clean design make it easy to integrate into any project.
Free with trial A clean and simple vector illustration of a bar chart isolated on a white background. This minimalist graphic features three vertical bars in varying shades of blue, representing data, statistics, or progress. Ideal for business reports, financial presentations, infographics, websites, and educational materials. The flat design symbolizes concepts like growth, analysis, market research, and performance comparison, offering a modern and clear way to visualize information. Ample copy space is available. Decrease statistics vector icon illustrations Simple Blue Bar Chart Vector Icon for Business Data. A clean and simple vector illustration of a bar chart isolated on a white background. This minimalist graphic features three vertical bars in varying shades of blue, representing data, statistics, or progress. Ideal for business reports, financial presentations, infographics, websites, and educational materials. The flat design symbolizes concepts like growth, analysis, market research, and performance comparison, offering a modern and clear way to visualize information. Ample copy space is available.
Free with trial Checklist line icon. Continuous line with 3d star. Graph chart sign. Growth diagram symbol. 3d star in speech bubble. Checklist single line ribbon. Loop curve pattern. Vector. Decrease statistics vector icon vectors Checklist line icon. Graph chart sign. Continuous line with 3d star. Vector. Checklist line icon. Continuous line with 3d star. Graph chart sign. Growth diagram symbol. 3d star in speech bubble. Checklist single line ribbon. Loop curve pattern. Vector
Free with trial Report line icon. Neumorphic, Green gradient, 3d pin buttons. Column graph, pie chart sign. Market analytics symbol. Line icons. Neumorphic buttons with outline signs. Vector. Decrease statistics vector icon vectors Report line icon. Column graph, pie chart sign. Line icons. Vector. Report line icon. Neumorphic, Green gradient, 3d pin buttons. Column graph, pie chart sign. Market analytics symbol. Line icons. Neumorphic buttons with outline signs. Vector
Free with trial Graph phone line icon. Halftone dotted pattern. Gradient icon with grain shadow. Column chart sign. Growth diagram symbol. Line graph phone icon. Various designs. Vector. Decrease statistics vector icon vectors Graph phone line icon. Column chart sign. Halftone dotted pattern. Vector. Graph phone line icon. Halftone dotted pattern. Gradient icon with grain shadow. Column chart sign. Growth diagram symbol. Line graph phone icon. Various designs. Vector
Free with trial Report timer line icon. Halftone dotted pattern. Gradient icon with grain shadow. Column graph sign. Growth diagram chart symbol. Line report timer icon. Various designs. Vector. Decrease statistics vector icon vectors Report timer line icon. Column graph sign. Halftone dotted pattern. Vector. Report timer line icon. Halftone dotted pattern. Gradient icon with grain shadow. Column graph sign. Growth diagram chart symbol. Line report timer icon. Various designs. Vector
Free with trial Report document line icon. Continuous line big heart. Column graph sign. Growth diagram, pie chart symbol. 3d hearts in heart shaped loop. Report document single line ribbon. Vector. Decrease statistics vector icon vectors Report document line icon. Column graph sign. Continuous line big heart. Vector. Report document line icon. Continuous line big heart. Column graph sign. Growth diagram, pie chart symbol. 3d hearts in heart shaped loop. Report document single line ribbon. Vector
Free with trial Presentation board line icon. Neumorphic, Purple gradient, 3d pin buttons. Column graph sign. Growth diagram symbol. Line icons. Neumorphic buttons with outline signs. Vector. Decrease statistics vector icon illustrations Presentation board line icon. Column graph sign. Line icons. Vector. Presentation board line icon. Neumorphic, Purple gradient, 3d pin buttons. Column graph sign. Growth diagram symbol. Line icons. Neumorphic buttons with outline signs. Vector
Free with trial Presentation board line icon. Neumorphic, Purple gradient, 3d pin buttons. Column graph sign. Growth diagram symbol. Line icons. Neumorphic buttons with outline signs. Vector. Decrease statistics vector icon illustrations Presentation board line icon. Column graph sign. Line icons. Vector. Presentation board line icon. Neumorphic, Purple gradient, 3d pin buttons. Column graph sign. Growth diagram symbol. Line icons. Neumorphic buttons with outline signs. Vector
Free with trial Diagram chart line icon. Neumorphic, Orange gradient, 3d pin buttons. Presentation graph sign. Market analytics symbol. Line icons. Neumorphic buttons with outline signs. Vector. Decrease statistics vector icon vectors Diagram chart line icon. Presentation graph sign. Line icons. Vector. Diagram chart line icon. Neumorphic, Orange gradient, 3d pin buttons. Presentation graph sign. Market analytics symbol. Line icons. Neumorphic buttons with outline signs. Vector
Free with trial Diagram chart line icon. Neumorphic, Orange gradient, 3d pin buttons. Presentation graph sign. Market analytics symbol. Line icons. Neumorphic buttons with outline signs. Vector. Decrease statistics vector icon illustrations Diagram chart line icon. Presentation graph sign. Line icons. Vector. Diagram chart line icon. Neumorphic, Orange gradient, 3d pin buttons. Presentation graph sign. Market analytics symbol. Line icons. Neumorphic buttons with outline signs. Vector
Free with trial Analytics graph line icon. Halftone dotted pattern. Gradient icon with grain shadow. Column chart sign. Growth diagram symbol. Line analytics graph icon. Various designs. Vector. Decrease statistics vector icon vectors Analytics graph line icon. Column chart sign. Halftone dotted pattern. Vector. Analytics graph line icon. Halftone dotted pattern. Gradient icon with grain shadow. Column chart sign. Growth diagram symbol. Line analytics graph icon. Various designs. Vector
Free with trial Dot plot graph line icon. Neumorphic, Blue gradient, 3d pin buttons. Presentation chart sign. Market analytics symbol. Line icons. Neumorphic buttons with outline signs. Vector. Decrease statistics vector icon vectors Dot plot graph line icon. Presentation chart sign. Line icons. Vector. Dot plot graph line icon. Neumorphic, Blue gradient, 3d pin buttons. Presentation chart sign. Market analytics symbol. Line icons. Neumorphic buttons with outline signs. Vector
Free with trial Diagram chart line icon. Halftone dotted pattern. Gradient icon with grain shadow. Analytics graph sign. Market analytics symbol. Line analytics chart icon. Various designs. Vector. Decrease statistics vector icon vectors Diagram chart line icon. Analytics graph sign. Halftone dotted pattern. Vector. Diagram chart line icon. Halftone dotted pattern. Gradient icon with grain shadow. Analytics graph sign. Market analytics symbol. Line analytics chart icon. Various designs. Vector
Free with trial Pyramid chart line icon. Continuous line with 3d star. Analytics graph sign. Market analytics symbol. 3d star in speech bubble. Pyramid chart single line ribbon. Loop curve pattern. Vector. Decrease statistics vector icon vectors Pyramid chart line icon. Analytics graph sign. Continuous line with 3d star. Vector. Pyramid chart line icon. Continuous line with 3d star. Analytics graph sign. Market analytics symbol. 3d star in speech bubble. Pyramid chart single line ribbon. Loop curve pattern. Vector
Free with trial Presentation board line icon. Continuous line with share plane. Column graph sign. Growth diagram symbol. 3d star in speech bubble. Presentation board single line ribbon. Loop curve pattern. Vector. Decrease statistics vector icon vectors Presentation board line icon. Column graph sign. Continuous line with plane. Vector. Presentation board line icon. Continuous line with share plane. Column graph sign. Growth diagram symbol. 3d star in speech bubble. Presentation board single line ribbon. Loop curve pattern. Vector
Free with trial Candlestick chart line icon. Continuous line with share plane. Analytics graph sign. Market analytics symbol. 3d heart in speech bubble. Candlestick chart single line ribbon. Vector. Decrease statistics vector icon vectors Candlestick chart line icon. Analytics graph sign. Continuous line with plane. Vector. Candlestick chart line icon. Continuous line with share plane. Analytics graph sign. Market analytics symbol. 3d heart in speech bubble. Candlestick chart single line ribbon. Vector
Free with trial Diagram chart line icon. Halftone dotted pattern. Gradient icon with grain shadow. Presentation graph sign. Market analytics symbol. Line diagram chart icon. Various designs. Vector. Decrease statistics vector icon vectors Diagram chart line icon. Presentation graph sign. Halftone dotted pattern. Vector. Diagram chart line icon. Halftone dotted pattern. Gradient icon with grain shadow. Presentation graph sign. Market analytics symbol. Line diagram chart icon. Various designs. Vector
Free with trial Candlestick chart line icon. Halftone dotted pattern. Gradient icon with grain shadow. Analytics graph sign. Market analytics symbol. Line candlestick chart icon. Various designs. Vector. Decrease statistics vector icon vectors Candlestick chart line icon. Analytics graph sign. Halftone dotted pattern. Vector. Candlestick chart line icon. Halftone dotted pattern. Gradient icon with grain shadow. Analytics graph sign. Market analytics symbol. Line candlestick chart icon. Various designs. Vector
Free with trial Dot plot graph line icon. Halftone dotted pattern. Gradient icon with grain shadow. Presentation chart sign. Market analytics symbol. Line dot plot icon. Various designs. Vector. Decrease statistics vector icon vectors Dot plot graph line icon. Presentation chart sign. Halftone dotted pattern. Vector. Dot plot graph line icon. Halftone dotted pattern. Gradient icon with grain shadow. Presentation chart sign. Market analytics symbol. Line dot plot icon. Various designs. Vector
Free with trial A crisp vector illustration of an orange downward trending line graph, signifying a fall, loss, or negative economic movement. This versatile icon is perfect for financial dashboards, business analysis, or reporting on declining statistics. Its clear visual representation quickly conveys a reduction in values, making it highly effective, vector design Generative AI. Decrease statistics vector icon vectors Orange Downward Trending Financial Graph, vector design Generative AI. A crisp vector illustration of an orange downward trending line graph, signifying a fall, loss, or negative economic movement. This versatile icon is perfect for financial dashboards, business analysis, or reporting on declining statistics. Its clear visual representation quickly conveys a reduction in values, making it highly effective, vector design Generative AI
Free with trial Pie chart line icon. Neumorphic, Red gradient, 3d pin buttons. Presentation graph sign. Market analytics symbol. Line icons. Neumorphic buttons with outline signs. Vector. Decrease statistics vector icon vectors Pie chart line icon. Presentation graph sign. Line icons. Vector. Pie chart line icon. Neumorphic, Red gradient, 3d pin buttons. Presentation graph sign. Market analytics symbol. Line icons. Neumorphic buttons with outline signs. Vector
Free with trial Report document line icon. Neumorphic, Purple gradient, 3d pin buttons. Column graph sign. Growth diagram, pie chart symbol. Line icons. Neumorphic buttons with outline signs. Vector. Decrease statistics vector icon vectors Report document line icon. Column graph sign. Line icons. Vector. Report document line icon. Neumorphic, Purple gradient, 3d pin buttons. Column graph sign. Growth diagram, pie chart symbol. Line icons. Neumorphic buttons with outline signs. Vector
Free with trial Down graphic of business stats outline icon in white and black colors. down graphic of business stats flat vector icon from business collection for web, mobile apps and ui. Decrease statistics vector icon vectors Down graphic of business stats outline icon in white and black colors. down graphic of business stats flat vector icon from
Free with trial Graph laptop line icon. Halftone dotted pattern. Gradient icon with grain shadow. Column chart sign. Growth diagram symbol. Line graph laptop icon. Various designs. Vector. Decrease statistics vector icon illustrations Graph laptop line icon. Column chart sign. Halftone dotted pattern. Vector. Graph laptop line icon. Halftone dotted pattern. Gradient icon with grain shadow. Column chart sign. Growth diagram symbol. Line graph laptop icon. Various designs. Vector
Free with trial Graph line icon. Neumorphic, Orange gradient, 3d pin buttons. Column chart sign. Ab test diagram symbol. Line icons. Neumorphic buttons with outline signs. Vector. Decrease statistics vector icon vectors Graph line icon. Column chart sign. Line icons. Vector. Graph line icon. Neumorphic, Orange gradient, 3d pin buttons. Column chart sign. Ab test diagram symbol. Line icons. Neumorphic buttons with outline signs. Vector
Free with trial Graph line icon. Neumorphic, Blue gradient, 3d pin buttons. Column chart sign. Growth diagram symbol. Line icons. Neumorphic buttons with outline signs. Vector. Decrease statistics vector icon vectors Graph line icon. Column chart sign. Line icons. Vector. Graph line icon. Neumorphic, Blue gradient, 3d pin buttons. Column chart sign. Growth diagram symbol. Line icons. Neumorphic buttons with outline signs. Vector
Free with trial Report document line icon. Halftone dotted pattern. Gradient icon with grain shadow. Column graph sign. Growth diagram, pie chart symbol. Line report document icon. Various designs. Vector. Decrease statistics vector icon vectors Report document line icon. Column graph sign. Halftone dotted pattern. Vector. Report document line icon. Halftone dotted pattern. Gradient icon with grain shadow. Column graph sign. Growth diagram, pie chart symbol. Line report document icon. Various designs. Vector
Free with trial Report document line icon. Halftone dotted pattern. Gradient icon with grain shadow. Column graph sign. Growth diagram, pie chart symbol. Line report document icon. Various designs. Vector. Decrease statistics vector icon vectors Report document line icon. Column graph sign. Halftone dotted pattern. Vector. Report document line icon. Halftone dotted pattern. Gradient icon with grain shadow. Column graph sign. Growth diagram, pie chart symbol. Line report document icon. Various designs. Vector
Free with trial Column 3d graph sign. Salaryman, gender equality and alert bell outline icons. Diagram chart line icon. Market analytics symbol. 3d chart line sign. Spy or profile placeholder icon. Vector. Decrease statistics vector icon vectors Diagram chart line icon. Column 3d graph sign. Salaryman, gender equality and alert bell. Vector. Column 3d graph sign. Salaryman, gender equality and alert bell outline icons. Diagram chart line icon. Market analytics symbol. 3d chart line sign. Spy or profile placeholder icon. Vector
Free with trial Downward arrows icon. Decreasing trend symbol. Vector arrow group. Economic downturn. EPS 10. Decrease statistics vector icon vectors Downward arrows icon. Decreasing trend symbol. Vector arrow group. Economic downturn.
Free with trial Diagram graph line icon. Neumorphic, Red gradient, 3d pin buttons. Column chart sign. Market analytics symbol. Line icons. Neumorphic buttons with outline signs. Vector. Decrease statistics vector icon vectors Diagram graph line icon. Column chart sign. Line icons. Vector. Diagram graph line icon. Neumorphic, Red gradient, 3d pin buttons. Column chart sign. Market analytics symbol. Line icons. Neumorphic buttons with outline signs. Vector
Free with trial Analytics graph line icon. Continuous one line with curl. Column chart sign. Growth diagram symbol. Analytics graph single outline ribbon. Loop curve pattern. Vector. Decrease statistics vector icon illustrations Analytics graph line icon. Column chart sign. Continuous line with curl. Vector. Analytics graph line icon. Continuous one line with curl. Column chart sign. Growth diagram symbol. Analytics graph single outline ribbon. Loop curve pattern. Vector
Free with trial 3D Pie chart icon. Circle divided into parts statistical diagram vector illustration. 3D render. Decrease statistics vector icon vectors 3D Pie chart icon circle divided into parts statistical diagram vector illustration. 3D render.
Free with trial Diagram chart line icon. Neumorphic, Flat shadow, 3d buttons. Presentation graph sign. Market analytics symbol. Line diagram chart icon. Social media icons. Vector. Decrease statistics vector icon vectors Diagram chart line icon. Presentation graph sign. Neumorphic buttons. Vector. Diagram chart line icon. Neumorphic, Flat shadow, 3d buttons. Presentation graph sign. Market analytics symbol. Line diagram chart icon. Social media icons. Vector
Free with trial Pie chart line icon. Halftone dotted pattern. Gradient icon with grain shadow. Presentation graph sign. Market analytics symbol. Line pie chart icon. Various designs. Vector. Decrease statistics vector icon vectors Pie chart line icon. Presentation graph sign. Halftone dotted pattern. Vector. Pie chart line icon. Halftone dotted pattern. Gradient icon with grain shadow. Presentation graph sign. Market analytics symbol. Line pie chart icon. Various designs. Vector
Free with trial Graph line icon. Continuous one line with curl. Column chart sign. Growth diagram symbol. Graph chart single outline ribbon. Loop curve pattern. Vector. Decrease statistics vector icon vectors Graph line icon. Column chart sign. Continuous line with curl. Vector. Graph line icon. Continuous one line with curl. Column chart sign. Growth diagram symbol. Graph chart single outline ribbon. Loop curve pattern. Vector
Free with trial Graph line icon. Continuous one line with curl. Column chart sign. Growth diagram symbol. Graph chart single outline ribbon. Loop curve pattern. Vector. Decrease statistics vector icon vectors Graph line icon. Column chart sign. Continuous line with curl. Vector. Graph line icon. Continuous one line with curl. Column chart sign. Growth diagram symbol. Graph chart single outline ribbon. Loop curve pattern. Vector
Free with trial Graph line icon. Continuous line with share plane. Column chart sign. Growth diagram symbol. 3d heart in speech bubble. Graph chart single line ribbon. Loop curve pattern. Vector. Decrease statistics vector icon illustrations Graph line icon. Column chart sign. Continuous line with plane. Vector. Graph line icon. Continuous line with share plane. Column chart sign. Growth diagram symbol. 3d heart in speech bubble. Graph chart single line ribbon. Loop curve pattern. Vector
Free with trial Declining chart icon. Downward trend symbol. Falling graph illustration. Simple vector design. EPS 10. Decrease statistics vector icon vectors Declining chart icon. Downward trend symbol. Falling graph illustration. Simple vector design.
Free with trial Web report line icon. Continuous one line with curl. Column graph sign. Growth diagram symbol. Web report single outline ribbon. Loop curve pattern. Vector. Decrease statistics vector icon vectors Web report line icon. Column graph sign. Continuous line with curl. Vector. Web report line icon. Continuous one line with curl. Column graph sign. Growth diagram symbol. Web report single outline ribbon. Loop curve pattern. Vector
Free with trial Web report line icon. Continuous one line with curl. Column graph sign. Growth diagram symbol. Web report single outline ribbon. Loop curve pattern. Vector. Decrease statistics vector icon illustrations Web report line icon. Column graph sign. Continuous line with curl. Vector. Web report line icon. Continuous one line with curl. Column graph sign. Growth diagram symbol. Web report single outline ribbon. Loop curve pattern. Vector
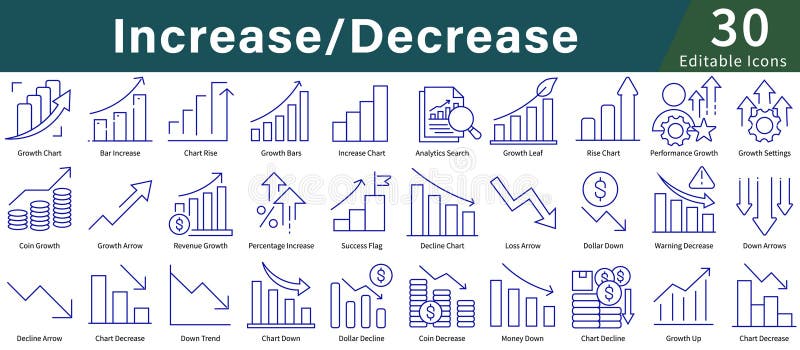
Free with trial Icons illustrating concepts of "Increase Decrease," using simple blue line art. Features include graphs and charts with upward and downward arrows, coins, dollar symbols, and percentage signs. Icons depict growth, decline, analytics, and performance tracking. Suitable for business, finance, or data analysis themes, these icons provide a visual representation of financial trends and statistics, making abstract concepts clear and easily understandable. The design is minimalistic and user-friendly, aimed at enhancing clarity in presentations and reports. Decrease statistics vector icon vectors Increase Decrease Icon Set in Line Style with Editable Vector for Growth, Analytics, Charts, and Data Visualization. Icons illustrating concepts of "Increase Decrease," using simple blue line art. Features include graphs and charts with upward and downward arrows, coins, dollar symbols, and percentage signs. Icons depict growth, decline, analytics, and performance tracking. Suitable for business, finance, or data analysis themes, these icons provide a visual representation of financial trends and statistics, making abstract concepts clear and easily understandable. The design is minimalistic and user-friendly, aimed at enhancing clarity in presentations and reports.
Free with trial Growth chart line icon. Halftone dotted pattern. Gradient icon with grain shadow. Column graph sign. Market analytics symbol. Line growth chart icon. Various designs. Vector. Decrease statistics vector icon vectors Growth chart line icon. Column graph sign. Halftone dotted pattern. Vector. Growth chart line icon. Halftone dotted pattern. Gradient icon with grain shadow. Column graph sign. Market analytics symbol. Line growth chart icon. Various designs. Vector
Free with trial Diagram graph line icon. Halftone dotted pattern. Gradient icon with grain shadow. Column chart sign. Market analytics symbol. Line diagram graph icon. Various designs. Vector. Decrease statistics vector icon illustrations Diagram graph line icon. Column chart sign. Halftone dotted pattern. Vector. Diagram graph line icon. Halftone dotted pattern. Gradient icon with grain shadow. Column chart sign. Market analytics symbol. Line diagram graph icon. Various designs. Vector
Free with trial Diagram graph line icon. Halftone dotted pattern. Gradient icon with grain shadow. Column chart sign. Market analytics symbol. Line diagram graph icon. Various designs. Vector. Decrease statistics vector icon illustrations Diagram graph line icon. Column chart sign. Halftone dotted pattern. Vector. Diagram graph line icon. Halftone dotted pattern. Gradient icon with grain shadow. Column chart sign. Market analytics symbol. Line diagram graph icon. Various designs. Vector
Free with trial Charts and graphs, Presentation and Report. Graph line icons. Analytics linear icon set. Line icons set. Vector. Decrease statistics vector icon illustrations Graph line icons. Charts and graphs, Presentation and Report. Linear icon set. Line icons. Vector. Charts and graphs, Presentation and Report. Graph line icons. Analytics linear icon set. Line icons set. Vector
Free with trial Charts and graphs, Presentation and Report. Graph line icons. Analytics linear icon set. Line icons set. Vector. Decrease statistics vector icon illustrations Graph line icons. Charts and graphs, Presentation and Report. Linear icon set. Line icons. Vector. Charts and graphs, Presentation and Report. Graph line icons. Analytics linear icon set. Line icons set. Vector
Free with trial Column chart sign. Salaryman, gender equality and alert bell outline icons. Decreasing graph line icon. Crisis diagram symbol. Spy or profile placeholder icon. Vector. Decrease statistics vector icon vectors Decreasing graph line icon. Crisis chart sign. Salaryman, gender equality and alert bell. Vector. Column chart sign. Salaryman, gender equality and alert bell outline icons. Decreasing graph line icon. Crisis diagram symbol. Decreasing graph line sign. Spy or profile placeholder icon. Vector
Free with trial Column chart sign. Salaryman, gender equality and alert bell outline icons. Decreasing graph line icon. Crisis diagram symbol. Spy or profile placeholder icon. Vector. Decrease statistics vector icon illustrations Decreasing graph line icon. Crisis chart sign. Salaryman, gender equality and alert bell. Vector. Column chart sign. Salaryman, gender equality and alert bell outline icons. Decreasing graph line icon. Crisis diagram symbol. Decreasing graph line sign. Spy or profile placeholder icon. Vector
Free with trial Set line Financial growth decrease Arrow Pie chart infographic Many ways directional arrow Pyramid infographics and Graph chart diagram icon. Vector. Decrease statistics vector icon illustrations Set line Financial growth decrease, Arrow, Pie chart infographic, Many ways directional arrow, Pyramid infographics, and. Set line Financial growth decrease Arrow Pie chart infographic Many ways directional arrow Pyramid infographics and Graph chart diagram icon. Vector.
Free with trial Column chart sign. Salaryman, gender equality and alert bell outline icons. Diagram graph line icon. Market analytics symbol. Spy or profile placeholder icon. Vector. Decrease statistics vector icon vectors Diagram graph line icon. Column chart sign. Salaryman, gender equality and alert bell. Vector. Column chart sign. Salaryman, gender equality and alert bell outline icons. Diagram graph line icon. Market analytics symbol. Diagram graph line sign. Spy or profile placeholder icon. Vector
Free with trial Loss icon logo sign vector outline in black and white color. Decrease statistics vector icon vectors A bar chart icon with a downward trend, representing financial loss or decrease, often used in business or stock market contexts. loss icon logo sign vector outline in black and white color
Free with trial Set Mountains with flag Financial growth decrease Dollar symbol Pie chart infographic Intersection point Arrow and icon. Vector. Decrease statistics vector icon illustrations Set Mountains with flag, Financial growth decrease, Dollar symbol, Pie chart infographic, Intersection point, Arrow, and. Set Mountains with flag Financial growth decrease Dollar symbol Pie chart infographic Intersection point Arrow and icon. Vector.
Free with trial Decline graph line outline icon isolated on white. Vector illustration. Decrease statistics vector icon vectors Decline graph line outline icon
Free with trial Line icon of decreasing chart representing reduced productivity, low performance, and efficiency decline. Suitable for business, work, stress, and health related topics. Decrease statistics vector icon vectors Reduced Productivity Icon Decrease Performance Efficiency Decline Symbol. Line icon of decreasing chart representing reduced productivity, low performance, and efficiency decline. Suitable for business, work, stress, and health related topics.
Free with trial Line icon of decreasing chart representing reduced productivity, low performance, and efficiency decline. Suitable for business, work, stress, and health related topics. Decrease statistics vector icon vectors Reduced Productivity Icon Decrease Performance Efficiency Decline Symbol black. Line icon of decreasing chart representing reduced productivity, low performance, and efficiency decline. Suitable for business, work, stress, and health related topics.
Free with trial Vibrant vector illustration featuring business data charts and graphs, including bar graphs, line graphs, pie charts, and a roller coaster metaphor for market trends. This eye-catching design is perfect for presentations, infographics, and financial reports. Decrease statistics vector icon illustrations Business Data Charts Graphs Vector Illustration, Statistics. Vibrant vector illustration featuring business data charts and graphs, including bar graphs, line graphs, pie charts, and a roller coaster metaphor for market trends. This eye-catching design is perfect for presentations, infographics, and financial reports.
Free with trial Financial loss solid vector icon. This glyph icon has a downward trend and dollar sign. A clear analytics symbol and data sign for risk and decline icon uses. Decrease statistics vector icon vectors Financial loss solid vector icon
Free with trial Web report line icon. Neumorphic, Flat shadow, 3d buttons. Column graph sign. Growth diagram symbol. Line web report icon. Social media icons. Vector. Decrease statistics vector icon illustrations Web report line icon. Column graph sign. Neumorphic buttons. Vector. Web report line icon. Neumorphic, Flat shadow, 3d buttons. Column graph sign. Growth diagram symbol. Line web report icon. Social media icons. Vector
Free with trial A modern flat design graphic set featuring two icons: opposing arrows indicating increase decrease and a bar chart showing financial growth or decline, perfect for business concepts. Decrease statistics vector icon vectors Increase and decrease arrows with bar chart icon. A modern flat design graphic set featuring two icons: opposing arrows indicating increase decrease and a bar chart showing financial growth or decline, perfect for business concepts
Free with trial Simple black and white vector illustration showing bar charts indicating increase and decrease, perfect for financial or data concepts. Decrease statistics vector icon vectors Bar chart icon showing increase and decrease data. Simple black and white vector illustration showing bar charts indicating increase and decrease, perfect for financial or data concepts
Free with trial Graph laptop line icon. Neumorphic, Flat shadow, 3d buttons. Column chart sign. Growth diagram symbol. Line graph laptop icon. Social media icons. Vector. Decrease statistics vector icon illustrations Graph laptop line icon. Column chart sign. Neumorphic buttons. Vector. Graph laptop line icon. Neumorphic, Flat shadow, 3d buttons. Column chart sign. Growth. Graph laptop line icon. Neumorphic, Flat shadow, 3d buttons. Column chart sign. Growth diagram symbol. Line graph laptop icon. Social media icons. Vector
Free with trial Financial Loss line icon with dollar symbol and downward arrow. Outline vector icon, sign representing decline, risk, and business decrease as a financial symbol. Decrease statistics vector icon vectors Financial Loss line icon
Free with trial Calendar graph line icon. Neumorphic, Flat shadow, 3d buttons. Column chart sign. Growth diagram symbol. Line calendar graph icon. Social media icons. Vector. Decrease statistics vector icon vectors Calendar graph line icon. Column chart sign. Neumorphic buttons. Vector. Calendar graph line icon. Neumorphic, Flat shadow, 3d buttons. Column chart sign. Growth diagram symbol. Line calendar graph icon. Social media icons. Vector
Free with trial Pie chart line icon. Neumorphic, Flat shadow, 3d buttons. Presentation graph sign. Market analytics symbol. Line pie chart icon. Social media icons. Vector. Decrease statistics vector icon vectors Pie chart line icon. Presentation graph sign. Neumorphic buttons. Vector. Pie chart line icon. Neumorphic, Flat shadow, 3d buttons. Presentation graph sign. Market analytics symbol. Line pie chart icon. Social media icons. Vector
Free with trial Pie chart line icon. Neumorphic, Flat shadow, 3d buttons. Presentation graph sign. Market analytics symbol. Line pie chart icon. Social media icons. Vector. Decrease statistics vector icon vectors Pie chart line icon. Presentation graph sign. Neumorphic buttons. Vector. Pie chart line icon. Neumorphic, Flat shadow, 3d buttons. Presentation graph sign. Market analytics symbol. Line pie chart icon. Social media icons. Vector