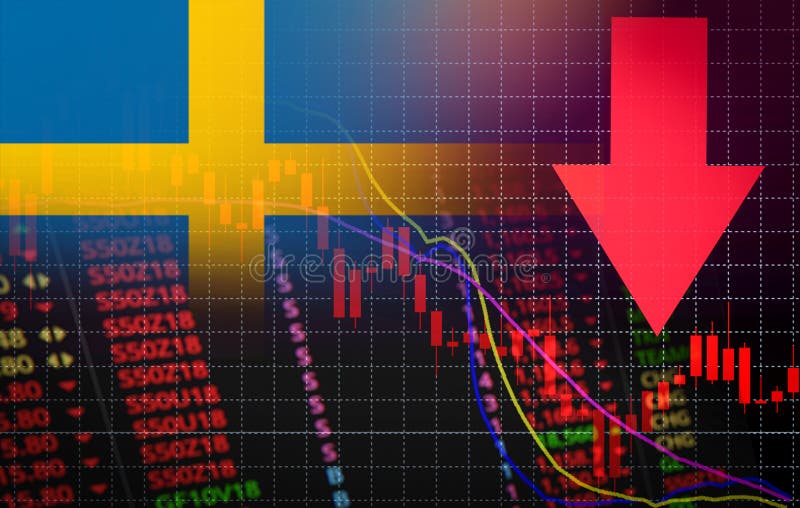
Free with trial Sweden Stock Exchange market crisis red market price down chart fall / Stock analysis or forex charts graph Business and finance money crisis red negative drop in sales economic fall. Decrease stocks illustrations Sweden Stock Exchange market crisis red market price down chart fall Business and finance money crisis red negative drop in sales. Sweden Stock Exchange market crisis red market price down chart fall / Stock analysis or forex charts graph Business and finance money crisis red negative drop in sales economic fall
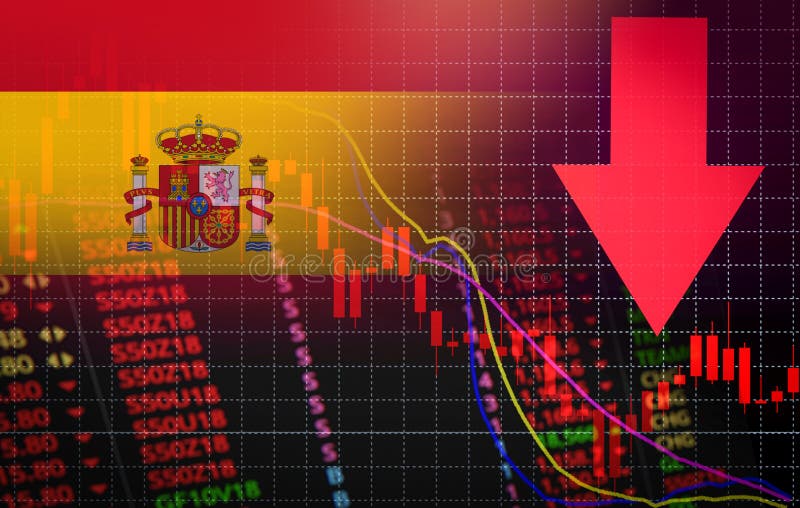
Free with trial Spain Stock Exchange market crisis red market price down chart fall / Stock analysis or forex charts graph Business and finance money crisis red negative drop in sales economic fall. Decrease stocks illustrations Spain Stock Exchange market crisis red market price down chart fall Business and finance money crisis red negative drop in sales. Spain Stock Exchange market crisis red market price down chart fall / Stock analysis or forex charts graph Business and finance money crisis red negative drop in sales economic fall
Free with trial Canada Stock Exchange market crisis red market price down chart fall / Stock analysis or forex charts graph Business and finance money crisis background red negative drop in sales economic fall. Decrease stocks illustrations Canada Stock Exchange market crisis red market price down chart fall Business and finance money crisis background red negative. Canada Stock Exchange market crisis red market price down chart fall / Stock analysis or forex charts graph Business and finance money crisis background red negative drop in sales economic fall
Free with trial 3D Rendering of Crypto currencies market goes down concept. Glowing Bitcoin BTC on red candle stick charts with extreme price drop background. Decrease stocks illustrations Crypto currencies market goes down concept. Glowing Bitcoin BTC on red candle stick charts
Free with trial Image representing American Profit and Financial Crisis. Decrease stocks illustrations American Profit Crisis. Image representing American Profit and Financial Crisis
Free with trial The collapsing and burning building of the American bank against the backdrop of skyscrapers. The collapse of the American economy, inflation, bankruptcy, the destruction of the financial system. Decrease stocks illustrations The collapsing and burning building of the American bank against the backdrop of skyscrapers. The collapse of the
Free with trial Dropping arrows showing decreasing trend in economy in global crisis or downtrend of stocks on the stock exchange in USA. Decrease stocks illustrations Dropping arrows showing decreasing trend in economy or downtrend on the stock exchange in USA. Dropping arrows showing decreasing trend in economy in global crisis or downtrend of stocks on the stock exchange in USA.
Free with trial Fall of the Thailand Economy. Recession graph with a red arrow on the Thailand flag. Economic decline. Decline in the economy of stock trading. Downward trends in the economy. Business. Decrease stocks illustrations Fall of the Thailand Economy. Recession graph with a red arrow on the Thailand flag. Economic decline. Decline in the economy of
Free with trial Dropping arrows showing decreasing trend in economy in global crisis or downtrend of stocks on the stock exchange in Spain. March 2022, San Francisco, USA. Decrease stocks illustrations Dropping arrows showing decreasing trend in economy or downtrend on the stock exchange in Spain. Dropping arrows showing decreasing trend in economy in global crisis or downtrend of stocks on the stock exchange in Spain. March 2022, San Francisco, USA
Free with trial Creative collage picture young businesspeople money economy recession inflation golden coin bankruptcy stocks decrease drawing background. Decrease stocks illustrations Creative collage picture young businesspeople money economy recession inflation golden coin bankruptcy stocks decrease
Free with trial Bear or bearish market trend in crypto currency or stocks. Trade exchange background, down arrow graph for decrease in rates. Cryptocurrency price chart, blockchain technology. Global economy crash. , AI. Decrease stocks illustrations Bear or bearish market trend in crypto currency or stocks. Trade exchange background, down arrow graph for decrease in rates.
Free with trial Bear or bearish market trend in crypto currency or stocks. Trade exchange background, down arrow graph for decrease in rates. Cryptocurrency price chart, blockchain technology. Global economy crash. , AI. Decrease stocks illustrations Bear or bearish market trend in crypto currency or stocks. Trade exchange background, down arrow graph for decrease in rates.
Free with trial Bear or bearish market trend in crypto currency or stocks. Trade exchange background, down arrow graph for decrease in rates. Cryptocurrency price chart, blockchain technology. Global economy crash. , AI. Decrease stocks illustrations Bear or bearish market trend in crypto currency or stocks. Trade exchange background, down arrow graph for decrease in rates.
Free with trial Bear or bearish market trend in crypto currency or stocks. Trade exchange background, down arrow graph for decrease in rates. Cryptocurrency price chart, blockchain technology. Global economy crash. , AI. Decrease stocks illustrations Bear or bearish market trend in crypto currency or stocks. Trade exchange background, down arrow graph for decrease in rates.
Free with trial Bear or bearish market trend in crypto currency or stocks. Trade exchange background, down arrow graph for decrease in rates. Cryptocurrency price chart, blockchain technology. Global economy crash. , AI. Decrease stocks illustrations Bear or bearish market trend in crypto currency or stocks. Trade exchange background, down arrow graph for decrease in rates.
Free with trial Bear or bearish market trend in crypto currency or stocks. Trade exchange background, down arrow graph for decrease in rates. Cryptocurrency price chart, blockchain technology. Global economy crash. , AI. Decrease stocks illustrations Bear or bearish market trend in crypto currency or stocks. Trade exchange background, down arrow graph for decrease in rates.
Free with trial Bear or bearish market trend in crypto currency or stocks. Trade exchange background, down arrow graph for decrease in rates. Cryptocurrency price chart, blockchain technology. Global economy crash. , AI. Decrease stocks illustrations Bear or bearish market trend in crypto currency or stocks. Trade exchange background, down arrow graph for decrease in rates.
Free with trial Bear or bearish market trend in crypto currency or stocks. Trade exchange background, down arrow graph for decrease in rates. Cryptocurrency price chart, blockchain technology. Global economy crash. , AI. Decrease stocks illustrations Bear or bearish market trend in crypto currency or stocks. Trade exchange background, down arrow graph for decrease in rates.
Free with trial Bear or bearish market trend in crypto currency or stocks. Trade exchange background, down arrow graph for decrease in rates. Cryptocurrency price chart, blockchain technology. Global economy crash. , AI. Decrease stocks illustrations Bear or bearish market trend in crypto currency or stocks. Trade exchange background, down arrow graph for decrease in rates.
Free with trial Set line Server Website with stocks market Infographic of city map Laptop browser window Financial growth decrease Browser shield Photo retouching and Secure your HTTPS SSL icon. Vector. Decrease stocks illustrations Set line Server, Website with stocks market, Infographic of city map, Laptop browser window, Financial growth decrease. Set line Server Website with stocks market Infographic of city map Laptop browser window Financial growth decrease Browser shield Photo retouching and Secure your HTTPS SSL icon. Vector.
Free with trial Creative collage young woman trader economy recession crisis bankruptcy golden coin dollar failure investing loss stocks downfall decrease. Decrease stocks illustrations Creative collage young woman trader economy recession crisis bankruptcy golden coin dollar failure investing loss stocks
Free with trial Set line Laptop with browser window Browser Financial growth decrease and Website stocks market. Business infographic template. Vector. Decrease stocks illustrations Set line Laptop with browser window, Browser, Financial growth decrease and Website stocks market. Business infographic
Free with trial Set line Data analysis Financial growth decrease Cloud and shield and Browser with stocks market. Business infographic template. Vector. Decrease stocks illustrations Set line Data analysis, Financial growth decrease, Cloud and shield and Browser with stocks market. Business infographic
Free with trial Set Financial growth decrease Magnifying glass with check mark Graph chart infographic Search engine Website stocks market Browser shield window and Mobile phone icon. Vector. Decrease stocks illustrations Set Financial growth decrease, Magnifying glass with check mark, Graph chart infographic, Search engine, Website stocks. Set Financial growth decrease Magnifying glass with check mark Graph chart infographic Search engine Website stocks market Browser shield window and Mobile phone icon. Vector.
Free with trial Set line Financial growth decrease Data analysis Browser with stocks market Pie chart infographic Coal mine trolley and Cloud computing lock icon. Vector. Decrease stocks vectors Set line Financial growth decrease, Data analysis, Browser with stocks market, Pie chart infographic, Coal mine trolley. Set line Financial growth decrease Data analysis Browser with stocks market Pie chart infographic Coal mine trolley and Cloud computing lock icon. Vector.
Free with trial Set line Website with stocks market Financial growth decrease Browser window and Cloud technology data transfer icon. Vector. Decrease stocks illustrations Set line Website with stocks market, Financial growth decrease, Browser window and Cloud technology data transfer icon
Free with trial Data displays price changes for various stocks. Decrease stocks illustrations Market trends show price movements for stocks and investments over time. Data displays price changes for various stocks
Free with trial Red arrow pointing downwards declining market, financial downturn, investment loss, business crisis. Economic concepts decrease, failure, debt, bankruptcy, recession. Represents. Decrease stocks illustrations Red arrow pointing downwards, declining market, financial downturn, investment loss, business crisis. Economic concepts decrease. Red arrow pointing downwards declining market, financial downturn, investment loss, business crisis. Economic concepts decrease, failure, debt, bankruptcy, recession. Represents.
Free with trial Stock market is falling, icon in line design. Stock, market, falling, decline, crash, loss, decrease on white background vector. Stock market is falling editable stroke icon. Decrease stocks vectors Stock market is falling, icon in line design. Stock, market, falling, decline, crash, loss, decrease on white background
Free with trial Decrease oil prices drop illustration global market, economy trend, plummet crude decrease oil prices drop. Decrease stocks illustrations Decrease oil prices drop
Free with trial Three red percentage symbols are shown with arrows pointing downward, representing a decline. Each symbol is positioned above words: "Economy," "Growth," and "Stocks," indicating a decrease in these areas. The arrows are bold and the symbols feature a glossy finish, emphasizing the visual concept of reduction or negative trend. The overall design highlights financial or economic themes. Decrease stocks illustrations Three red percentage symbols are shown with arrows pointing downward
Free with trial Set Binary code Pie chart infographic Data analysis Coal mine trolley Financial growth decrease and Browser with stocks market icon. Vector. Decrease stocks illustrations Set Binary code, Pie chart infographic, Data analysis, Coal mine trolley, Financial growth decrease, and Browser with. Set Binary code Pie chart infographic Data analysis Coal mine trolley Financial growth decrease and Browser with stocks market icon. Vector.
Free with trial Creative collage picture young man woman economy recession bank loan credit bankruptcy loss finance failure stocks collapse. Decrease stocks illustrations Creative collage picture young man woman economy recession bank loan credit bankruptcy loss finance failure stocks
Free with trial Vertical poster collage young bored businesswoman upset economy crisis recession golden coin dollar stocks downfall loss. Decrease stocks illustrations Vertical poster collage young bored businesswoman upset economy crisis recession golden coin dollar stocks downfall loss
Free with trial Red bear market illustration financial downturn. Bear character sitting near chart, graph, showing decrease. Concept of economic crisis, stock market crash, financial losses trading. Decrease stocks illustrations Red bear market illustration financial downturn. Bear character sitting near chart, graph, showing decrease. Concept of economic
Free with trial Scale with illustrations of cash and home stocks. The concept of inflation. Stock Illustration. Home price is decrease. Decrease stocks vectors Scale with illustrations of cash and home stocks. The concept of inflation. Stock Illustration
Free with trial Set Browser with stocks market Financial growth Pie chart infographic Binary code Cloud computing lock Search data analysis and Data icon. Vector. Decrease stocks vectors Set Browser with stocks market, Financial growth, Pie chart infographic, Binary code, Cloud computing lock, Search data. Set Browser with stocks market Financial. Set Browser with stocks market Financial growth Pie chart infographic Binary code Cloud computing lock Search data analysis and Data icon. Vector.
Free with trial A computer screen displaying stock market notifications for three stocks: Stock A with a 5% increase, Stock B with a 3% decrease, and Stock C that has reached its target. The image features a dark grey computer screen with a light blue background and colorful notification bubbles. Decrease stocks illustrations Stock market notifications on a computer screen. A computer screen displaying stock market notifications for three stocks: Stock A with a 5% increase, Stock B with a 3% decrease, and Stock C that has reached its target. The image features a dark grey computer screen with a light blue background and colorful notification bubbles.
Free with trial The image shows a stock market screen with various stock prices and their changes. Some stocks are highlighted in red, indicating a decrease in price, while others are highlighted in green, indicating an increase. The screen also shows the volume of shares traded for each stock. Decrease stocks illustrations A stock market screen displaying various stock prices and their changes. The image shows a stock market screen with various stock prices and their changes. Some stocks are highlighted in red, indicating a decrease in price, while others are highlighted in green, indicating an increase. The screen also shows the volume of shares traded for each stock
Free with trial The image displays three bold red arrows pointing downward, each containing a percentage symbol. This visual metaphor typically represents a decline, reduction, or drop in percentage-based metrics, often used in financial contexts to indicate decreases in stocks, interest rates, or other economic indicators. Decrease stocks illustrations Three downward arrows symbolizing a decrease in percentage values or financial decline. The image displays three bold red arrows pointing downward, each containing a percentage symbol. This visual metaphor typically represents a decline, reduction, or drop in percentage-based metrics, often used in financial contexts to indicate decreases in stocks, interest rates, or other economic indicators
Free with trial Decreasing stocks bars graphic outline icon in white and black colors. decreasing stocks bars graphic flat vector icon from business collection for web, mobile apps and ui. Decrease stocks vectors Decreasing stocks bars graphic outline icon in white and black colors. decreasing stocks bars graphic flat vector icon from
Free with trial High-Quality Vector Icons Collection with Editable Stroke. Ideal for Professional and Creative Projects. Decrease stocks vectors Increase and decrease icons High-Quality Vector Icons Collection with Editable Stroke. Ideal for Professional and. High-Quality Vector Icons Collection with Editable Stroke. Ideal for Professional and Creative Projects.
Free with trial Bear Market, bearish market trend in stocks. Trade exchange background, down arrow graph for decrease in rates. Global economy crash. Decrease stocks vectors Bear Market
Free with trial Creative collage picture scissors cutting banknote cash hundred dollars statistics arrow decrease profit ciris recession devaluation. Decrease stocks illustrations Creative collage picture scissors cutting banknote cash hundred dollars statistics arrow decrease profit ciris recession
Free with trial Downward trend line color icon. Statistical chart, metric analysis. Performance decrease, data visualization. Isolated vector illustration. Flat colorful symbol design. Editable stroke. Decrease stocks vectors Downward trend line color icon
Free with trial Falling Chart After Its Peak. The Concept Of Not Succeeding And Falling Stocks. Generative AI. Decrease stocks illustrations Falling Chart After Its Peak. The Concept Of Not Succeeding And Falling Stocks. Generative AI
Free with trial Falling Chart With A Rocket Flying Down. The Concept Of Not Succeeding And Falling Stocks. Generative AI. Decrease stocks illustrations Falling Chart With A Rocket Flying Down. The Concept Of Not Succeeding And Falling Stocks. Generative AI
Free with trial Set line Website with stocks market Search engine Browser setting Financial growth increase window Photo retouching and mail and icon. Vector. Decrease stocks vectors Set line Website with stocks market, Search engine, Browser setting, Financial growth increase, window, Photo retouching. Set line Website with stocks market Search engine Browser setting Financial growth increase window Photo retouching and mail and icon. Vector.
Free with trial Increase and decrease icons collection is a vector illustration with editable stroke. Decrease stocks vectors Increase and decrease icons collection is a vector illustration with editable stroke.
Free with trial A bear market, such as stocks or cryptocurrencies, that is in a downtrend , which creates a huge disaster for investors. It is suitable to use the image in articles analyzing various price trends. Decrease stocks illustrations A bear market, such as stocks or cryptocurrencies, that is in a downtrend , which creates a huge disaster for investors. It is
Free with trial A bear market, such as stocks or cryptocurrencies, that is in a downtrend , which creates a huge disaster for investors. It is suitable to use the image in articles analyzing various price trends. Decrease stocks illustrations A bear market, such as stocks or cryptocurrencies, that is in a downtrend , which creates a huge disaster for investors. It is
Free with trial A bear market, such as stocks or cryptocurrencies, that is in a downtrend , which creates a huge disaster for investors. It is suitable to use the image in articles analyzing various price trends. Decrease stocks illustrations A bear market, such as stocks or cryptocurrencies, that is in a downtrend , which creates a huge disaster for investors. It is
Free with trial A bear market, such as stocks or cryptocurrencies, that is in a downtrend , which creates a huge disaster for investors. It is suitable to use the image in articles analyzing various price trends. Decrease stocks illustrations A bear market, such as stocks or cryptocurrencies, that is in a downtrend , which creates a huge disaster for investors. It is
Free with trial A bear market, such as stocks or cryptocurrencies, that is in a downtrend , which creates a huge disaster for investors. It is suitable to use the image in articles analyzing various price trends. Decrease stocks illustrations A bear market, such as stocks or cryptocurrencies, that is in a downtrend , which creates a huge disaster for investors. It is
Free with trial A bear market, such as stocks or cryptocurrencies, that is in a downtrend , which creates a huge disaster for investors. It is suitable to use the image in articles analyzing various price trends. Decrease stocks illustrations A bear market, such as stocks or cryptocurrencies, that is in a downtrend , which creates a huge disaster for investors. It is
Free with trial A bear market, such as stocks or cryptocurrencies, that is in a downtrend , which creates a huge disaster for investors. It is suitable to use the image in articles analyzing various price trends. Decrease stocks illustrations A bear market, such as stocks or cryptocurrencies, that is in a downtrend , which creates a huge disaster for investors. It is
Free with trial A bear market, such as stocks or cryptocurrencies, that is in a downtrend , which creates a huge disaster for investors. It is suitable to use the image in articles analyzing various price trends. Decrease stocks illustrations A bear market, such as stocks or cryptocurrencies, that is in a downtrend , which creates a huge disaster for investors. It is
Free with trial A bear market, such as stocks or cryptocurrencies, that is in a downtrend , which creates a huge disaster for investors. It is suitable to use the image in articles analyzing various price trends. Decrease stocks illustrations A bear market, such as stocks or cryptocurrencies, that is in a downtrend , which creates a huge disaster for investors. It is
Free with trial A bear market, such as stocks or cryptocurrencies, that is in a downtrend , which creates a huge disaster for investors. It is suitable to use the image in articles analyzing various price trends. Decrease stocks illustrations A bear market, such as stocks or cryptocurrencies, that is in a downtrend , which creates a huge disaster for investors. It is
Free with trial A bear market, such as stocks or cryptocurrencies, that is in a downtrend , which creates a huge disaster for investors. It is suitable to use the image in articles analyzing various price trends. Decrease stocks illustrations A bear market, such as stocks or cryptocurrencies, that is in a downtrend , which creates a huge disaster for investors. It is
Free with trial A bear market, such as stocks or cryptocurrencies, that is in a downtrend , which creates a huge disaster for investors. It is suitable to use the image in articles analyzing various price trends. Decrease stocks illustrations A bear market, such as stocks or cryptocurrencies, that is in a downtrend , which creates a huge disaster for investors. It is
Free with trial A bear market, such as stocks or cryptocurrencies, that is in a downtrend , which creates a huge disaster for investors. It is suitable to use the image in articles analyzing various price trends. Decrease stocks illustrations A bear market, such as stocks or cryptocurrencies, that is in a downtrend , which creates a huge disaster for investors. It is
Free with trial A bear market, such as stocks or cryptocurrencies, that is in a downtrend , which creates a huge disaster for investors. It is suitable to use the image in articles analyzing various price trends. Decrease stocks illustrations A bear market, such as stocks or cryptocurrencies, that is in a downtrend , which creates a huge disaster for investors. It is
Free with trial A bear market, such as stocks or cryptocurrencies, that is in a downtrend , which creates a huge disaster for investors. It is suitable to use the image in articles analyzing various price trends. Decrease stocks illustrations A bear market, such as stocks or cryptocurrencies, that is in a downtrend , which creates a huge disaster for investors. It is
Free with trial A bear market, such as stocks or cryptocurrencies, that is in a downtrend , which creates a huge disaster for investors. It is suitable to use the image in articles analyzing various price trends. Decrease stocks illustrations A bear market, such as stocks or cryptocurrencies, that is in a downtrend , which creates a huge disaster for investors. It is
Free with trial A bear market, such as stocks or cryptocurrencies, that is in a downtrend , which creates a huge disaster for investors. It is suitable to use the image in articles analyzing various price trends. Decrease stocks illustrations A bear market, such as stocks or cryptocurrencies, that is in a downtrend , which creates a huge disaster for investors. It is
Free with trial A bear market, such as stocks or cryptocurrencies, that is in a downtrend , which creates a huge disaster for investors. It is suitable to use the image in articles analyzing various price trends. Decrease stocks illustrations A bear market, such as stocks or cryptocurrencies, that is in a downtrend , which creates a huge disaster for investors. It is
Free with trial A bear market, such as stocks or cryptocurrencies, that is in a downtrend , which creates a huge disaster for investors. It is suitable to use the image in articles analyzing various price trends. Decrease stocks illustrations A bear market, such as stocks or cryptocurrencies, that is in a downtrend , which creates a huge disaster for investors. It is
Free with trial A bear market, such as stocks or cryptocurrencies, that is in a downtrend , which creates a huge disaster for investors. It is suitable to use the image in articles analyzing various price trends. Decrease stocks illustrations A bear market, such as stocks or cryptocurrencies, that is in a downtrend , which creates a huge disaster for investors. It is
Free with trial A bear market, such as stocks or cryptocurrencies, that is in a downtrend , which creates a huge disaster for investors. It is suitable to use the image in articles analyzing various price trends. Decrease stocks illustrations A bear market, such as stocks or cryptocurrencies, that is in a downtrend , which creates a huge disaster for investors. It is
Free with trial A bear market, such as stocks or cryptocurrencies, that is in a downtrend , which creates a huge disaster for investors. It is suitable to use the image in articles analyzing various price trends. Decrease stocks illustrations A bear market, such as stocks or cryptocurrencies, that is in a downtrend , which creates a huge disaster for investors. It is
Free with trial A bear market, such as stocks or cryptocurrencies, that is in a downtrend , which creates a huge disaster for investors. It is suitable to use the image in articles analyzing various price trends. Decrease stocks illustrations A bear market, such as stocks or cryptocurrencies, that is in a downtrend , which creates a huge disaster for investors. It is
Free with trial A bear market, such as stocks or cryptocurrencies, that is in a downtrend , which creates a huge disaster for investors. It is suitable to use the image in articles analyzing various price trends. Decrease stocks illustrations A bear market, such as stocks or cryptocurrencies, that is in a downtrend , which creates a huge disaster for investors. It is
Free with trial A bear market, such as stocks or cryptocurrencies, that is in a downtrend , which creates a huge disaster for investors. It is suitable to use the image in articles analyzing various price trends. Decrease stocks illustrations A bear market, such as stocks or cryptocurrencies, that is in a downtrend , which creates a huge disaster for investors. It is
Free with trial A bear market, such as stocks or cryptocurrencies, that is in a downtrend , which creates a huge disaster for investors. It is suitable to use the image in articles analyzing various price trends. Decrease stocks illustrations A bear market, such as stocks or cryptocurrencies, that is in a downtrend , which creates a huge disaster for investors. It is
Free with trial A bear market, such as stocks or cryptocurrencies, that is in a downtrend , which creates a huge disaster for investors. It is suitable to use the image in articles analyzing various price trends. Decrease stocks illustrations A bear market, such as stocks or cryptocurrencies, that is in a downtrend , which creates a huge disaster for investors. It is
Free with trial A bear market, such as stocks or cryptocurrencies, that is in a downtrend , which creates a huge disaster for investors. It is suitable to use the image in articles analyzing various price trends. Decrease stocks illustrations A bear market, such as stocks or cryptocurrencies, that is in a downtrend , which creates a huge disaster for investors. It is
Free with trial A bear market, such as stocks or cryptocurrencies, that is in a downtrend , which creates a huge disaster for investors. It is suitable to use the image in articles analyzing various price trends. Decrease stocks illustrations A bear market, such as stocks or cryptocurrencies, that is in a downtrend , which creates a huge disaster for investors. It is
Free with trial A bear market, such as stocks or cryptocurrencies, that is in a downtrend , which creates a huge disaster for investors. It is suitable to use the image in articles analyzing various price trends. Decrease stocks illustrations A bear market, such as stocks or cryptocurrencies, that is in a downtrend , which creates a huge disaster for investors. It is
Free with trial A bear market, such as stocks or cryptocurrencies, that is in a downtrend , which creates a huge disaster for investors. It is suitable to use the image in articles analyzing various price trends. Decrease stocks illustrations A bear market, such as stocks or cryptocurrencies, that is in a downtrend , which creates a huge disaster for investors. It is