Free with trial This image shows a simple line graph with increasing and decreasing trends, ideal for visualizing data analysis and presenting key findings. The graph uses a clean, minimalist design to highlight the data points and overall trend. Perfect for presentations and reports. Decrease text illustrations Analyze Your Data. This image shows a simple line graph with increasing and decreasing trends, ideal for visualizing data analysis and presenting key findings. The graph uses a clean, minimalist design to highlight the data points and overall trend. Perfect for presentations and reports.
Free with trial Red stock market investment decline chart. Decrease text vectors Red stock market investment decline chart
Free with trial This image features a promotional graphic with a blue and red color scheme. It includes two speech bubbles, each displaying 40% OFF in white text. Decrease text illustrations Promotional announcement highlighting 40% discount with megaphone isolated on white background. This image features a promotional graphic with a blue and red color scheme. It includes two speech bubbles, each displaying 40% OFF in white text
Free with trial A flat design vector illustration depicting a financial market data board or stock ticker. The black-bordered display features various stock symbols, numerical values like '$ ,80K', '$ ,22,50', and indicators of market performance. Prominently highlighted in red is the word 'LOSING', accompanied by a red downward arrow signifying a price drop, and a red downward triangle. Conversely, a green upward arrow indicates a price increase. This icon effectively visualizes concepts of financial loss, gain, market volatility, and investment trends, suitable for business, finance, and economic content. Decrease text illustrations Financial Market Data Board Icon with Loss and Gain Indicators. A flat design vector illustration depicting a financial market data board or stock ticker. The black-bordered display features various stock symbols, numerical values like '$ ,80K', '$ ,22,50', and indicators of market performance. Prominently highlighted in red is the word 'LOSING', accompanied by a red downward arrow signifying a price drop, and a red downward triangle. Conversely, a green upward arrow indicates a price increase. This icon effectively visualizes concepts of financial loss, gain, market volatility, and investment trends, suitable for business, finance, and economic content.
Free with trial A thick, red, zigzagging line, potentially a stock chart, is superimposed over a dark background with glowing green and red data points and lines. Image. Decrease text illustrations Red Zigzag Line Overlaying Financial Data. A thick, red, zigzagging line, potentially a stock chart, is superimposed over a dark background with glowing green and red data points and lines. Image
Free with trial Large billboard featuring the text "TAXES 2026" in bold letters. Positioned against a partly cloudy blue sky, the billboard stands prominently on a metal support structure. The word "TAXES" is written in gray, while "2026" is in red, providing a stark contrast against the white background. The clouds add depth to the scene, suggesting an outdoor, open location. The overall setting implies a public announcement or information campaign. Decrease text illustrations Billboard announcing taxes for the year 2026 against a cloudy sky. Large billboard featuring the text "TAXES 2026" in bold letters. Positioned against a partly cloudy blue sky, the billboard stands prominently on a metal support structure. The word "TAXES" is written in gray, while "2026" is in red, providing a stark contrast against the white background. The clouds add depth to the scene, suggesting an outdoor, open location. The overall setting implies a public announcement or information campaign.
Free with trial Stacks of coins are topped with wooden blocks displaying the numbers 2, 0, 2, and 6, arranged to represent the year 2026. The coins decrease in height from left to right. A magnifying glass with a wooden handle lies beside the stacks, suggesting examination or analysis. The background is a neutral gray, providing a clean, professional look associated with financial themes. Decrease text illustrations Searching for Financial Growth in 2026 - Money and Magnifying Glass. Stacks of coins are topped with wooden blocks displaying the numbers 2, 0, 2, and 6, arranged to represent the year 2026. The coins decrease in height from left to right. A magnifying glass with a wooden handle lies beside the stacks, suggesting examination or analysis. The background is a neutral gray, providing a clean, professional look associated with financial themes.
Free with trial Arrow Direction and Percentage Icons for Business Growth Concept. Decrease text illustrations Arrow Direction and Percentage Icons for Business Growth Concept
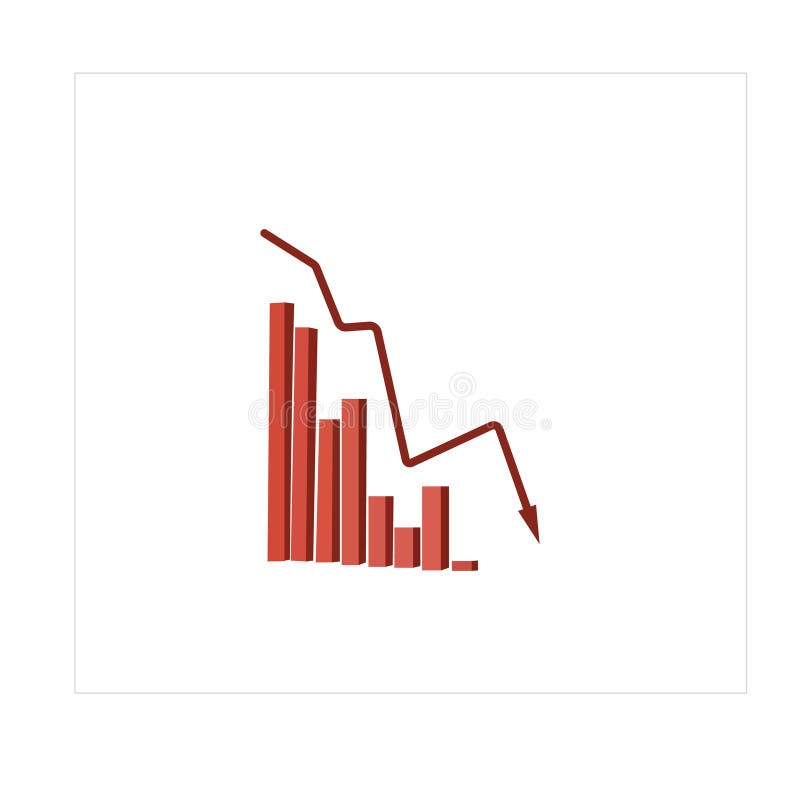
Free with trial Red bar graph with a descending line and arrow on a white background. The graph features four bars of varying heights, depicting a decline in values from left to right. The red line starts at the top of the first bar, dips below the second, rises over the third, then slopes downward with a pronounced arrow pointing to the right, indicating a decrease in data or performance. The image suggests themes of loss or negative financial trends. Decrease text vectors Red bar graph with a descending line and arrow on a white background.
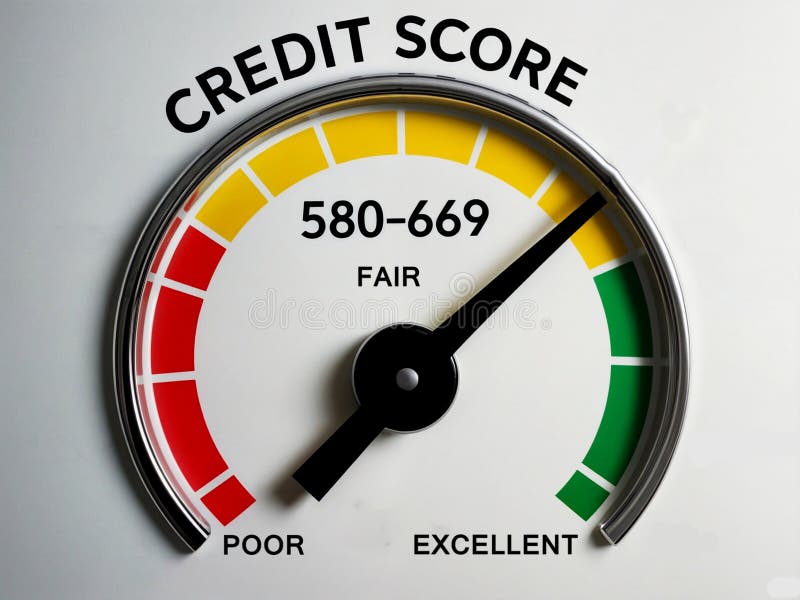
Free with trial 3d render illustration of a credit Score gauge meter within fair range 580 to 669. Decrease text illustrations Credit Score gauge meter within fair range 580 to 669
Free with trial Emission reduction icon. CO2 drop symbol. Carbon fall Vector. Clean air. EPS 10. Decrease text vectors Emission reduction icon. CO2 drop symbol. Carbon fall Vector. Clean air.
Free with trial Line art depicting a magnifying glass focused on a declining sales graph and a thumbs-down gesture. Decrease text illustrations Declining Sales Analysis Magnifying Glass, Downward Trend, Thumbs Down. Line art depicting a magnifying glass focused on a declining sales graph and a thumbs-down gesture.
Free with trial A black arrow points downwards with the word LOS in white letters on its shaft. Clear details and vibrant colo. Decrease text illustrations Black arrow pointing down with the word LOS in white direction symbol. A black arrow points downwards with the word LOS in white letters on its shaft. Clear details and vibrant colo
Free with trial Depreciation down graph fail bankruptcy diagram financial business crisis economy vector. Decrease text vectors Depreciation down graph fail bankruptcy diagram financial business crisis economy
Free with trial A collage of nine distinct charts and graphs, primarily displaying financial data, growth trends, and economic indicators. The visuals feature line graphs, area charts, and bar charts with various colored lines and shaded areas representing different metrics over time. Accompanying text and labels suggest analysis of business performance, economic growth, and financial markets. This collection is ideal for presentations, reports, and articles related to finance, economics, and business analytics. Decrease text illustrations Collection of Financial and Business Growth Charts. A collage of nine distinct charts and graphs, primarily displaying financial data, growth trends, and economic indicators. The visuals feature line graphs, area charts, and bar charts with various colored lines and shaded areas representing different metrics over time. Accompanying text and labels suggest analysis of business performance, economic growth, and financial markets. This collection is ideal for presentations, reports, and articles related to finance, economics, and business analytics.
Free with trial Illustration of a business activities. Decrease text vectors Illustration of a business activities
Free with trial Illustration of a business activities. Decrease text vectors Illustration of a business activities
Free with trial Illustration of a business activities. Decrease text vectors Illustration of a business activities
Free with trial Illustration of a business activities. Decrease text vectors Illustration of a business activities
Free with trial Illustration of a business activities. Decrease text vectors Illustration of a business activities
Free with trial Illustration of a business activities. Decrease text vectors Illustration of a business activities
Free with trial Illustration of a business activities. Decrease text vectors Illustration of a business activities
Free with trial Illustration of a business activities. Decrease text vectors Illustration of a business activities
Free with trial Illustration of a business activities. Decrease text vectors Illustration of a business activities
Free with trial Illustration of a business activities. Decrease text vectors Illustration of a business activities
Free with trial Illustration of a business activities. Decrease text vectors Illustration of a business activities
Free with trial Illustration of a business activities. Decrease text vectors Illustration of a business activities
Free with trial Illustration of a business activities. Decrease text vectors Illustration of a business activities
Free with trial A visual representation of declining performance, with red bars and a descending line graph on a white background. Decrease text illustrations Red bar chart showing downward trend and line graph. A visual representation of declining performance, with red bars and a descending line graph on a white background.
Free with trial A 3D blue bar chart and a dark blue line graph illustrate a significant downward trend, indicating a decline in data over time. Decrease text illustrations Blue bar chart and line graph showing downward trend. A 3D blue bar chart and a dark blue line graph illustrate a significant downward trend, indicating a decline in data over time.
Free with trial 3D model of tax percentage sign. Suitable for financial articles, accounting presentations, tax related blog posts or business websites. 3D Rendering. Decrease text illustrations 3D model of tax percentage sign.
Free with trial A 3D render of a blue circular button with a subtle shadow. A white arrow with a gradient effect points downwards, with the word "Downward" written in black text across its surface. The image has a transparent background. Decrease text illustrations Downward Arrow Icon on Blue Circle direction movement. A 3D render of a blue circular button with a subtle shadow. A white arrow with a gradient effect points downwards, with the word "Downward" written in black text across its surface. The image has a transparent background
Free with trial Abstract 3D render of a financial growth chart. The image features a series of vertical bars, some in teal and others in orange, representing data points on a graph. The bars increase in height towards the right, suggesting positive growth or progress. The chart is set against a dark background with a subtle grid pattern and a reflective surface, adding depth and visual interest. Suitable for illustrating financial reports, market analysis, or business trends. Decrease text illustrations Abstract Financial Growth Chart. Abstract 3D render of a financial growth chart. The image features a series of vertical bars, some in teal and others in orange, representing data points on a graph. The bars increase in height towards the right, suggesting positive growth or progress. The chart is set against a dark background with a subtle grid pattern and a reflective surface, adding depth and visual interest. Suitable for illustrating financial reports, market analysis, or business trends.
Free with trial A man in a suit presents a sign 'Output Loss'. This concept highlights any reduction in productivity, efficiency, or the quantity of results produced. Concept: Inefficiency. Decrease text illustrations Manager Addressing the Issue of Output Loss. A man in a suit presents a sign 'Output Loss'. This concept highlights any reduction in productivity, efficiency, or the quantity of results produced. Concept: Inefficiency
Free with trial Bar chart illustration showing a descending trend. Four vertical bars in gradient hues of orange and blue decrease in height from left to right. A line graph with circles marks the top of each bar, emphasizing the downward trend. The design is simple and uses soft pastel colors, against a white background, highlighting the decreasing business data concept. Decrease text vectors Decreasing Trend Graph: Business Data Chart Illustration. Bar chart illustration showing a descending trend. Four vertical bars in gradient hues of orange and blue decrease in height from left to right. A line graph with circles marks the top of each bar, emphasizing the downward trend. The design is simple and uses soft pastel colors, against a white background, highlighting the decreasing business data concept.
Free with trial Stacks of gold coins rise incrementally, aligning with a candlestick chart. The chart shows alternating red and green candlesticks, increasing in height and following an upward trend. This visual represents financial growth and market analysis. Candlesticks typically illustrate market price movements in trading, where red indicates a decrease and green an increase in value. Decrease text vectors Candlestick Chart & Gold Coins: Rising Stock Market Growth. Stacks of gold coins rise incrementally, aligning with a candlestick chart. The chart shows alternating red and green candlesticks, increasing in height and following an upward trend. This visual represents financial growth and market analysis. Candlesticks typically illustrate market price movements in trading, where red indicates a decrease and green an increase in value.
Free with trial A close-up shot captures a pair of hands using red-handled scissors to cut through a white piece of paper with the bold black word "JOBS" printed on it. Set against a clean, light blue background, this powerful visual metaphor symbolizes job loss, unemployment, layoffs, and economic recession. It's an ideal image for illustrating articles, reports, or presentations related to the struggling job market, corporate downsizing, financial insecurity, career challenges, and the broader economic impact of job cuts. Decrease text illustrations Cutting Jobs: Symbol of Unemployment and Economic Crisis. A close-up shot captures a pair of hands using red-handled scissors to cut through a white piece of paper with the bold black word "JOBS" printed on it. Set against a clean, light blue background, this powerful visual metaphor symbolizes job loss, unemployment, layoffs, and economic recession. It's an ideal image for illustrating articles, reports, or presentations related to the struggling job market, corporate downsizing, financial insecurity, career challenges, and the broader economic impact of job cuts.
Free with trial An troubled stock market investor holds the downward pointing arrow from a market chart in this 3-d illustration about investing. Decrease text illustrations An troubled stock market investor holds the downward pointing arrow from a market chart
Free with trial 3D Orange Percentage Symbol with Subtle Gradient and Shadow. Decrease text vectors 3D Orange Percentage Symbol with Subtle Gradient and Shadow
Free with trial Global Downturn Visualized: A striking graphic representation of economic decline, featuring a world map as the backdrop for a visual depiction of market fluctuations. Decrease text illustrations Global Downturn Visualized: A striking graphic representation
Free with trial Concentric heart shapes in flat vector design with a minimalist style. Black outlines progressively decrease in size, creating a layered effect. The illustration features five hearts centered on a plain white background, symbolizing love and romance. Decrease text illustrations Flat Design Love Vector Illustration Heart Icon Romantic Love Symbol Stock Art. Concentric heart shapes in flat vector design with a minimalist style. Black outlines progressively decrease in size, creating a layered effect. The illustration features five hearts centered on a plain white background, symbolizing love and romance.
Free with trial Featuring "LOW PRICE" text on a lightbox overlaid with downward candlestick charts and percentage performance data. Decrease text illustrations Low price trends and market entry opportunities reflected through real-time financial metrics and volatile trading indicators. Featuring "LOW PRICE" text on a lightbox overlaid with downward candlestick charts and percentage performance data.
Free with trial Concept of low yield of production 3d sign on grey background. Decrease text illustrations Concept of low yield of production 3d sign
Free with trial The background features blurred lights, creating a dramatic effect. financial markets. Decrease text illustrations A red downward arrow symbolizes a decline in financial markets. The background features blurred lights, creating a dramatic effect. financial markets
Free with trial Colorful Percent Symbol with Gradient Slash on White Background. Decrease text vectors Colorful Percent Symbol with Gradient Slash on White Background
Free with trial Blue heart patterns arranged in vertical rows against a white background. Each heart is followed by a vertical line of dots that decrease in size. The repetitive design creates a seamless and uniform appearance, suitable for fabric or wallpaper. Decrease text illustrations Vertical Blue Heart Chain Seamless Pattern on White Background. Blue heart patterns arranged in vertical rows against a white background. Each heart is followed by a vertical line of dots that decrease in size. The repetitive design creates a seamless and uniform appearance, suitable for fabric or wallpaper.
Free with trial Three funnel-shaped arrows�orange, red, and dark blue�decrease in size vertically, leading into a single blue arrow pointing right. Each funnel section tapers downward, representing a flow or process. The arrows contrast against a light background, emphasizing the transition from multiple inputs to a single output. Suitable for illustrating processes like sales funnels or data narrowing. Decrease text vectors Funnel flow chart template with three arrows. Three funnel-shaped arrows�orange, red, and dark blue�decrease in size vertically, leading into a single blue arrow pointing right. Each funnel section tapers downward, representing a flow or process. The arrows contrast against a light background, emphasizing the transition from multiple inputs to a single output. Suitable for illustrating processes like sales funnels or data narrowing.
Free with trial The phrase Wealth Erosion is shown under a tear in blue paper, representing the decrease in the real value of wealth due to factors like inflation or taxes. Concept of value decline. Decrease text illustrations Wealth Erosion the gradual decline in the real value of assets. The phrase Wealth Erosion is shown under a tear in blue paper, representing the decrease in the. The phrase Wealth Erosion is shown under a tear in blue paper, representing the decrease in the real value of wealth due to factors like inflation or taxes. Concept of value decline
Free with trial The question 'Why Your Results Drop' appears in a torn paper window, prompting analysis of declining performance in business or personal goals. Concept of failure analysis. Decrease text illustrations Why Your Results Drop a Question Revealed in Torn Blue Paper. The question 'Why Your Results Drop' appears in a torn paper window, prompting analysis of declining performance in business or personal goals. Concept of failure analysis
Free with trial Concentric circular pattern formed by red dots, arranged from dense center to sparse edges on a white background. The dots increase in number but decrease in size as they radiate outward from the center, creating a ripple effect. The pattern visually represents sound waves or vibrations, emphasizing symmetry and balance. This abstract design might be used in contexts related to sound, technology, or visual arts. Decrease text illustrations Concentric circular pattern formed by red dots
Free with trial Red stock market investment decline chart. Decrease text vectors Red stock market investment decline chart
Free with trial A striking 3D-rendered image featuring a blue hand emerging from the left side, gripping a red zigzag arrow pointing downward against a solid light blue background. The arrow symbolizes a decline in metrics such as financial performance, market trends, or business growth. This image is ideal for use in economic reports, editorial content, business presentations, and visual storytelling focused on loss, downturns, or negative growth. The clean design and bold color contrast make it a powerful metaphor for financial challenges and strategic analysis. Decrease text illustrations . A striking 3D-rendered image featuring a blue hand emerging from the left side, gripping a red zigzag arrow pointing downward against a solid light blue background. The arrow symbolizes a decline in metrics such as financial performance, market trends, or business growth. This image is ideal for use in economic reports, editorial content, business presentations, and visual storytelling focused on loss, downturns, or negative growth. The clean design and bold color contrast make it a powerful metaphor for financial challenges and strategic analysis.
Free with trial Layered heart pattern in shades of pink forming a symmetrical abstract background. The hearts decrease in size, creating a central focal point. Smooth gradients give a sense of depth and movement to the design, suitable for romantic themes like Valentine's Day or weddings. The overall texture is sleek, with a modern aesthetic. Decrease text illustrations Pink heart abstract background, layered heart pattern with smooth gradients, modern romantic illustration. Layered heart pattern in shades of pink forming a symmetrical abstract background. The hearts decrease in size, creating a central focal point. Smooth gradients give a sense of depth and movement to the design, suitable for romantic themes like Valentine's Day or weddings. The overall texture is sleek, with a modern aesthetic.
Free with trial Illustration of a smartphone displaying financial charts and a stack of gold coins with dollar signs. Arrows circulate around the phone, suggesting a cycle of investment and growth. The image represents mobile banking, online trading, and the potential for financial success through digital platforms. Decrease text illustrations Mobile Investment and Financial Growth. Illustration of a smartphone displaying financial charts and a stack of gold coins with dollar signs. Arrows circulate around the phone, suggesting a cycle of investment and growth. The image represents mobile banking, online trading, and the potential for financial success through digital platforms.
Free with trial A financial graph depicting a downward trend with a red arrow, blue bar chart, and white line graph on a dark blue grid background. Ideal for illustrating market decline, revenue loss, or negative performance in business, finance, and economic presentations. Decrease text illustrations Declining Financial Graph Red Arrow and Bar Chart on Dark Grid Background. A financial graph depicting a downward trend with a red arrow, blue bar chart, and white line graph on a dark blue grid background. Ideal for illustrating market decline, revenue loss, or negative performance in business, finance, and economic presentations.
Free with trial Dramatic red arrow shows oil price drop due to an embargo effect on charts and oil barrels Perfect for financial news and global trade articles. Decrease text illustrations Illustration of an oil embargo against a backdrop of declining market graphs. Dramatic red arrow shows oil price drop due to an embargo effect on charts and oil barrels Perfect for financial news and global trade articles
Free with trial A corporate professional holds a card reading 'Deflationary Spiral,' symbolizing a warning about economic downturns, falling prices, and reduced demand. Concept of a negative economic feedback loop. Decrease text illustrations Financial Expert Warning About The Deflationary Spiral Economic Crisis. A corporate professional holds a card reading 'Deflationary Spiral,' symbolizing a warning about economic downturns, falling prices, and reduced demand. Concept of a negative economic feedback loop
Free with trial Circular green halftone pattern consisting of a grid of dots that vary in size. The dots are larger in the center and gradually decrease in size towards the edges, creating a gradient effect. The overall design is set against a white background, with a smooth transition that gives a sense of depth and texture. This is a visual technique often used in graphic design and printing for creating shading and tonal effects. Decrease text vectors Circular green halftone pattern consisting of a grid of dots that vary in size.
Free with trial Red industrial production slows text over yellow sunburst background symbolizing economic downturn. Decrease text illustrations Industrial production slows down affecting global economy. Red industrial production slows text over yellow sunburst background symbolizing economic downturn
Free with trial The word 'Skimpflation' is printed on white paper, unveiled beneath a torn edge of textured dark blue paper. An economic concept image. Concept of stealth inflation. Decrease text illustrations Skimpflation economic term concept revealed under a torn blue paper layer. The word 'Skimpflation' is printed on white paper, unveiled beneath a torn edge of textured dark blue paper. An economic concept image. Concept of stealth inflation
Free with trial Multiple black square shapes arranged in a spiral pattern against a light grey background. Each square is tilted at a different angle, creating a dynamic sense of movement from the center outward. The squares decrease in size as they approach the center point of the spiral, forming a hypnotic geometric pattern. The squares maintain crisp, clean edges throughout the composition, emphasizing the abstract nature of the design. Minimalist art with clean lines and strong geometric forms against a monochromatic background. 32. Decrease text illustrations Abstract shapes. Abstract spiral square shapes, Vector wallpaper design. Multiple black square shapes arranged in a spiral pattern against a light grey background. Each square is tilted at a different angle, creating a dynamic sense of movement from the center outward. The squares decrease in size as they approach the center point of the spiral, forming a hypnotic geometric pattern. The squares maintain crisp, clean edges throughout the composition, emphasizing the abstract nature of the design. Minimalist art with clean lines and strong geometric forms against a monochromatic background.32
Free with trial Multiple black square shapes arranged in a spiral pattern against a light grey background. Each square is tilted at a different angle, creating a dynamic sense of movement from the center outward. The squares decrease in size as they approach the center point of the spiral, forming a hypnotic geometric pattern. The squares maintain crisp, clean edges throughout the composition, emphasizing the abstract nature of the design. Minimalist art with clean lines and strong geometric forms against a monochromatic background. 32. Decrease text illustrations Abstract shapes. Abstract spiral square shapes, Vector wallpaper design. Multiple black square shapes arranged in a spiral pattern against a light grey background. Each square is tilted at a different angle, creating a dynamic sense of movement from the center outward. The squares decrease in size as they approach the center point of the spiral, forming a hypnotic geometric pattern. The squares maintain crisp, clean edges throughout the composition, emphasizing the abstract nature of the design. Minimalist art with clean lines and strong geometric forms against a monochromatic background.32
Free with trial Candlestick charts with red and green bars display a stock market or forex trading pattern. Each candlestick represents data for a specific time period, showing opening, closing, high, and low values. Red indicates a price decrease, while green signifies an increase. The chart analyzes investment trends and is used for financial decisions in business and trading. The background is dark blue, enhancing the visibility of the vibrant candlestick colors. Decrease text illustrations Stock market chart forex trading candlestick pattern investment finance business graph analysis data trend. Candlestick charts with red and green bars display a stock market or forex trading pattern. Each candlestick represents data for a specific time period, showing opening, closing, high, and low values. Red indicates a price decrease, while green signifies an increase. The chart analyzes investment trends and is used for financial decisions in business and trading. The background is dark blue, enhancing the visibility of the vibrant candlestick colors.
Free with trial Visual representation of a financial downturn. A bar chart shows a sharp decline, accompanied by a warning sign and a gold dollar coin, symbolizing economic trouble and risk. Decrease text illustrations Financial crisis alert decreasing bar chart with dollar coin and warning sign. Visual representation of a financial downturn. A bar chart shows a sharp decline, accompanied by a warning sign and a gold dollar coin, symbolizing economic trouble and risk.
Free with trial A cartoon Bitcoin character is presenting a chart showing cryptocurrency market trends. The image is suitable for illustrating financial news, investment advice, or educational materials about Bitcoin and the crypto market. Decrease text illustrations Bitcoin Cartoon Character Explaining Crypto Market Trends. A cartoon Bitcoin character is presenting a chart showing cryptocurrency market trends. The image is suitable for illustrating financial news, investment advice, or educational materials about Bitcoin and the crypto market.
Free with trial A simple black vector illustration of a simple checkmark inside a circle, set against a white background, composed of basic geometric shapes, large circle, two perpendicular lines --chaos 30 --ar 16:9 --v 7 Job ID: e5716674-c7ae-40bc-b54b-07f4d0cf3160. Decrease text illustrations Black Circle with Inner V Symbol. a simple black vector illustration of a simple checkmark inside a circle, set against a white background, composed of basic geometric shapes, large circle, two perpendicular lines --chaos 30 --ar 16:9 --v 7 Job ID: e5716674-c7ae-40bc-b54b-07f4d0cf3160
Free with trial Illustration of a hand holding a magnifying glass over a financial chart showing business growth and success. The image represents data analysis, investment strategy, and market trends in a visually appealing way. Decrease text illustrations Business Growth Analysis Magnifying Glass on Financial Chart. Illustration of a hand holding a magnifying glass over a financial chart showing business growth and success. The image represents data analysis, investment strategy, and market trends in a visually appealing way.
Free with trial A sign with the word eco written on it is surrounded by plants and butterflies. The sign is on a brick surface and is placed on a ledge. Decrease text illustrations A sign with the word eco written on it is surrounded by plants and butterflies
Free with trial Design dehydration water droplet with half water insisiting dehration concept medical illustration icon. Decrease text illustrations Dehydration water droplet with half water insisiting dehration concept medical illustration icon
Free with trial Percentage with arrow up and down. Percentage arrow with percent sign. Design concept for banking, credit, interest rate, finance and money sphere. Decrease text vectors Percentage with arrow up and down. Percentage arrow with percent sign.
Free with trial A high-tech illustration of a glowing blue -2% percentage symbol displayed in a sleek, modern office environment. Surrounded by digital data icons and futuristic charts, this image is perfect for representing concepts like small financial losses, minor discounts, data drops, business trends, or analytical reports. Ideal for presentations, websites, digital marketing, or economic graphics. Decrease text illustrations Glowing -2% Discount Graphic in Modern Office Environment. A high-tech illustration of a glowing blue -2% percentage symbol displayed in a sleek, modern office environment. Surrounded by digital data icons and futuristic charts, this image is perfect for representing concepts like small financial losses, minor discounts, data drops, business trends, or analytical reports. Ideal for presentations, websites, digital marketing, or economic graphics.
Free with trial Three black arrows are arranged vertically on a white background, each featuring double-chevron designs. The arrows decrease in width from left to right, and the chevrons within each arrow create a repetitive, geometric pattern. The simplicity and boldness of the black-and-white contrast enhance the visual impact of the chevron motifs. Decrease text vectors Three black arrows are arranged vertically on a white background, each featuring double-chevron designs.
Free with trial Abstract design featuring flowing red and blue waves on the right side. The background is a gradient of grayish white with dotted patterns that gradually decrease in size, creating a sense of depth and movement. The color contrast highlights the dynamic curves against the subtle background, ideal for contemporary graphic design projects or digital interfaces. Decrease text vectors Blue red abstract waves background design images. Abstract design featuring flowing red and blue waves on the right side. The background is a gradient of grayish white with dotted patterns that gradually decrease in size, creating a sense of depth and movement. The color contrast highlights the dynamic curves against the subtle background, ideal for contemporary graphic design projects or digital interfaces.
Free with trial Visualize cost reduction strategies with this image. A finger touches a glowing hexagon icon with "cost reduction" text, representing business finance and savings. Ideal for corporate presentations on management. Decrease text illustrations Touching a glowing hexagon icon with the words cost reduction on a dark background. Visualize cost reduction strategies with this image. A finger touches a glowing hexagon icon with "cost reduction" text, representing business finance and savings. Ideal for corporate presentations on management
Free with trial Bold red 3D letters spell SOLDE on a vibrant red background with dramatic spotlighting. Decrease text illustrations Bold red 3D letters spell SOLDE on a vibrant red background with dramatic spotlighting
Free with trial Red downward arrows symbolize a decline in financial markets or economic downturn. The background features blurred lights, enhancing the dramatic effect. Decrease text illustrations Red downward arrows symbolize a decline in financial markets or economic downturn.