Free with trial Black Dollar Sign with Downward Arrow Indicating Financial Decline. Decrease trade graph vectors A solid black graphic representing a dollar sign combined with a downward pointing arrow, symbolizing financial decrease, currency. Black Dollar Sign with. Black Dollar Sign with Downward Arrow Indicating Financial Decline
Free with trial Drop down red arrow business market crisis on world map red dark background. Crisis economy and investment loss graph. vector illustration fantastic design. Decrease trade graph vectors Drop down red arrow business market crisis on world map red dark background. Crisis economy and investment loss graph. vector illustration fantastic design
Free with trial Joyful and sad businessman stands next to chart showing growth or decline. Investment statistic. Economy crisis. Financial recession. Business failure. Increase or decrease infographic. Vector concept. Decrease trade graph vectors Joyful and sad businessman stands next to chart showing growth or decline. Investment statistic. Economy crisis. Financial. Recession. Business failure. Joyful and sad businessman stands next to chart showing growth or decline. Investment statistic. Economy crisis. Financial recession. Business failure. Increase or decrease infographic. Vector concept
Free with trial Gold coins with arrows and graphs pointing up or down. Financial growth. Market decline. Crisis and recession. Statistics chart. Finance success. Increase or decrease cash infographic. Vector concept. Decrease trade graph vectors Gold coins with arrows and graphs pointing up or down. Financial growth. Market decline. Crisis and recession. Statistics chart. Finance success. Increase or
Free with trial An abstract representation of a stock market decline is illustrated through a sharply descending red line graph against a dark, grid-like background. The red hues emphasize the severity of the drop, suggesting financial loss. Numerical data points faintly accompany the visual. This image was generat. Decrease trade graph illustrations Red Stock Decline. An abstract representation of a stock market decline is illustrated through a sharply descending red line graph against a dark, grid-like. An abstract representation of a stock market decline is illustrated through a sharply descending red line graph against a dark, grid-like background. The red hues emphasize the severity of the drop, suggesting financial loss. Numerical data points faintly accompany the visual. This image was generat
Free with trial A set of nine black icons depicts various graph representations on a white background. These include upward and downward trend lines, bar charts, and percentage symbols. Each icon visually portrays economic or statistical concepts, with arrows indicating direction—either upward or downward—to suggest growth or decline. The icons are simplistic and monochromatic, enhancing clarity and ease of understanding, suitable for financial, business, or educational contexts. Decrease trade graph vectors A set of Minimal silhouette icon set of percentage growth and decline. A set of nine black icons depicts various graph representations on a white background. A set of nine black icons depicts various graph representations on a white background. These include upward and downward trend lines, bar charts, and percentage symbols. Each icon visually portrays economic or statistical concepts, with arrows indicating direction—either upward or downward—to suggest growth or decline. The icons are simplistic and monochromatic, enhancing clarity and ease of understanding, suitable for financial, business, or educational contexts.
Free with trial Minimalist Bar Graph Arrow Down Icon For Business Finance Loss Concept. Decrease trade graph vectors Black minimalist graphic showing descending financial bars with a downward arrow indicating market crisis or economic decline. Minimalist Bar Graph Arrow Down. Minimalist Bar Graph Arrow Down Icon For Business Finance Loss Concept
Free with trial Metallic financial fluctuation concept with dollar symbol, green arrow pointing up indicating growth, and red arrow pointing down for decrease. Market trends and investment. Economy changes. Decrease trade graph illustrations Metallic Dollar Sign With Green Up Arrow And Red Down Arrow Representing Financial Fluctuation. Metallic financial fluctuation concept with dollar symbol, green. Metallic financial fluctuation concept with dollar symbol, green arrow pointing up indicating growth, and red arrow pointing down for decrease. Market trends and investment. Economy changes
Free with trial Dynamic red line graph on a dark digital screen, symbolizing a dramatic financial crisis, market downturn, and economic recession. Ideal for business, investment, and global economic reports or presentations on financial loss and risk. Decrease trade graph illustrations Financial Crisis: Red Stock Market Chart Reflecting Economic Recession and Global Downturn. Dynamic red line graph on a dark digital screen, symbolizing a. Dynamic red line graph on a dark digital screen, symbolizing a dramatic financial crisis, market downturn, and economic recession. Ideal for business, investment, and global economic reports or presentations on financial loss and risk
Free with trial A close-up of a stock market chart showing a sharp downturn. The orange line graph against a dark background with gridlines illustrates the volatility and potential risks in financial markets. The image captures the urgency and anxiety associated with market fluctuations. The "MA 1000" text is visib. Decrease trade graph illustrations Stock Market Downturn. A close-up of a stock market chart showing a sharp downturn. The orange line graph against a dark background with gridlines illustrates. A close-up of a stock market chart showing a sharp downturn. The orange line graph against a dark background with gridlines illustrates the volatility and potential risks in financial markets. The image captures the urgency and anxiety associated with market fluctuations. The "MA 1000" text is visib
Free with trial A 3D render illustrating the concept of financial decline and economic crisis. The image features a bar chart with progressively smaller bars and a prominent red arrow pointing downwards, signifying a sharp downturn. This visual metaphor represents a stock market crash, business failure, investment loss, or recession. The minimalist design on a yellow background is perfect for financial reports, business presentations, economic news articles, and web graphics discussing negative growth, losses, or bankruptcy. A small stack of coins reinforces the monetary theme. Decrease trade graph illustrations 3D Financial Decline Graph with Downward Arrow. A 3D render illustrating the concept of financial decline and economic crisis. The image features a bar chart. A 3D render illustrating the concept of financial decline and economic crisis. The image features a bar chart with progressively smaller bars and a prominent red arrow pointing downwards, signifying a sharp downturn. This visual metaphor represents a stock market crash, business failure, investment loss, or recession. The minimalist design on a yellow background is perfect for financial reports, business presentations, economic news articles, and web graphics discussing negative growth, losses, or bankruptcy. A small stack of coins reinforces the monetary theme.
Free with trial Blue bar chart with a black arrow bouncing backward vector illustration. Economic recession, financial loss, market crash, business failure, negative growth, setback. Data graph with falling pointer. Decrease trade graph vectors Financial bar chart with a bouncing arrow pointing down economic recession and market loss vector illustration. Blue bar chart with a black arrow bouncing. Blue bar chart with a black arrow bouncing backward vector illustration. Economic recession, financial loss, market crash, business failure, negative growth, setback. Data graph with falling pointer
Free with trial Graphical depiction showing a dollar coin with arrows indicating a downward trend, representing financial decline and economic loss with a flat design. Decrease trade graph vectors Financial decline: A visual representation of economic downturn with dollar and arrows showing decrease. Graphical depiction showing a dollar coin with arrows. Graphical depiction showing a dollar coin with arrows indicating a downward trend, representing financial decline and economic loss with a flat design.
Free with trial Set line Drop in crude oil price, , Mobile stock trading and Dollar rate decrease. Glowing neon icon. Vector. Decrease trade graph vectors Set line Drop in crude oil price, , Mobile stock trading and Dollar rate decrease. Glowing neon icon. Vector.
Free with trial Two simple icons representing financial market performance, one showing a downward trend and the other an upward trend, both with dollar symbols. Decrease trade graph vectors Financial graph icons showing market trends up and down. Two simple icons representing financial market performance, one showing a downward trend and the other. Two simple icons representing financial market performance, one showing a downward trend and the other an upward trend, both with dollar symbols
Free with trial This graphic depicts supply and demand curves balanced by a scale, illustrating economic principles and market equilibrium. It's suitable for business presentations and educational materials. Decrease trade graph vectors Supply and demand graph with balance scale illustration. This graphic depicts supply and demand curves balanced by a scale, illustrating economic principles and. This graphic depicts supply and demand curves balanced by a scale, illustrating economic principles and market equilibrium. It's suitable for business presentations and educational materials
Free with trial Declining business graph. Financial crisis chart. Negative market trend. Black and white economic vector icons. Decrease trade graph vectors Financial loss bar chart icon set with falling arrow and dollar sign for economic recession. Declining business graph. Financial crisis chart. Negative market. Declining business graph. Financial crisis chart. Negative market trend. Black and white economic vector icons
Free with trial A 3D illustration of a financial chart showing a dramatic downward trend. A large red arrow points sharply down over a series of declining blue bar graphs, symbolizing a stock market crash, economic recession, or business failure. The background features complex data and grids, representing financial analysis and market data. This image is perfect for concepts related to economic crisis, investment loss, financial risk, bankruptcy, and negative business reports. Decrease trade graph illustrations Stock Market Crash Financial Graph. A 3D illustration of a financial chart showing a dramatic downward trend. A large red arrow points sharply down over a series. A 3D illustration of a financial chart showing a dramatic downward trend. A large red arrow points sharply down over a series of declining blue bar graphs, symbolizing a stock market crash, economic recession, or business failure. The background features complex data and grids, representing financial analysis and market data. This image is perfect for concepts related to economic crisis, investment loss, financial risk, bankruptcy, and negative business reports.
Free with trial This vibrant image depicts a stock market graph, generated by AI, showcasing a dramatic decline. The fiery red and orange hues emphasize the volatility and potential losses. The futuristic cityscape backdrop adds a layer of technological complexity, suggesting the interconnectedness of global fina. Decrease trade graph illustrations AI-Generated Stock Market Decline. This vibrant image depicts a stock market graph, generated by AI, showcasing a dramatic decline. The fiery red and orange hues. This vibrant image depicts a stock market graph, generated by AI, showcasing a dramatic decline. The fiery red and orange hues emphasize the volatility and potential losses. The futuristic cityscape backdrop adds a layer of technological complexity, suggesting the interconnectedness of global fina
Free with trial Illustration of stock market losses. Bankrupt financial information concept with arrows pointing down. Stock market correction concept. Descending trading graph. Decrease trade graph vectors Illustration of stock market losses. Bankrupt financial information concept with arrows pointing down. Stock market correction. Concept. Descending trading
Free with trial Flat showing an upward zigzag arrow in blue and orange symbolizing economic growth over icons of goods, coins, oil barrel on balance scale, industrial tower and fuel nozzle. Three price tags with red down arrows indicate falling prices and deflation. Isolated on white background. Ideal for articles about inflation, deflation, economy, trade, oil market, finance, business strategy, cost reduction and market trends. Decrease trade graph vectors Rising Growth Arrow with Falling Prices Illustration. Flat showing an upward zigzag arrow in blue and orange symbolizing economic growth over icons of goods. Flat showing an upward zigzag arrow in blue and orange symbolizing economic growth over icons of goods, coins, oil barrel on balance scale, industrial tower and fuel nozzle. Three price tags with red down arrows indicate falling prices and deflation. Isolated on white background. Ideal for articles about inflation, deflation, economy, trade, oil market, finance, business strategy, cost reduction and market trends.
Free with trial Set Dollar rate decrease, Shutdown of factory, Drop in crude oil price and Mobile stock trading. Business infographic template. Vector. Decrease trade graph illustrations Set Dollar rate decrease, Shutdown of factory, Drop in crude oil price and Mobile stock trading. Business infographic. Template. Vector
Free with trial A vibrant and playful collection of hand-drawn financial and business icons. The set includes a bar graph, gold bars, a downward arrow, calculators, a smiley face, and cartoon dollar bills. These icons are perfect for illustrating concepts related to finance, economics, investment, and business growth. The simple and cheerful design makes them ideal for educational materials, presentations, and websites. Decrease trade graph vectors Finance and Business Icons Set. A vibrant and playful collection of hand-drawn financial and business icons. The set includes a bar graph, gold bars, a downward. A vibrant and playful collection of hand-drawn financial and business icons. The set includes a bar graph, gold bars, a downward arrow, calculators, a smiley face, and cartoon dollar bills. These icons are perfect for illustrating concepts related to finance, economics, investment, and business growth. The simple and cheerful design makes them ideal for educational materials, presentations, and websites.
Free with trial A colorful business bar graph illustration showing a downward trend and financial loss. The chart features a red arrow pointing down with dollar sign icons, symbolizing economic recession, bankruptcy, or decreasing revenue in a simple style. Decrease trade graph vectors Business bar chart showing financial decline and money loss with a downward red arrow isolated on white background. A colorful business bar graph illustration. A colorful business bar graph illustration showing a downward trend and financial loss. The chart features a red arrow pointing down with dollar sign icons, symbolizing economic recession, bankruptcy, or decreasing revenue in a simple style
Free with trial This flat vector illustration depicts a rectangular screen displaying a red line graph with a downward pointing arrow. The design uses a clean, minimalist aesthetic with soft pastel background tones and bold outlines. It represents concepts of financial decline, market loss, or negative economic performance in a professional business context. Decrease trade graph vectors A digital icon showing a red downward trend arrow on a screen. This flat vector illustration depicts a rectangular screen displaying a red line graph with a. This flat vector illustration depicts a rectangular screen displaying a red line graph with a downward pointing arrow. The design uses a clean, minimalist aesthetic with soft pastel background tones and bold outlines. It represents concepts of financial decline, market loss, or negative economic performance in a professional business context
Free with trial This minimalist vector illustration depicts a line chart indicating a negative performance or decline. The design features a clean blue line with circular data points connected by segments, ending in a sharp red arrow pointing downwards. The background is a soft, neutral shade, emphasizing the clear visual representation of financial loss or decreasing statistics. Decrease trade graph vectors A simple line graph showing a downward trend with a red arrow. This minimalist vector illustration depicts a line chart indicating a negative performance or. This minimalist vector illustration depicts a line chart indicating a negative performance or decline. The design features a clean blue line with circular data points connected by segments, ending in a sharp red arrow pointing downwards. The background is a soft, neutral shade, emphasizing the clear visual representation of financial loss or decreasing statistics
Free with trial A hand adds to a graph depicting a sharp decline in the global economy, shown as a cracked map. This AI-generated image symbolizes the fragility of the world's financial systems and the potential for widespread economic crisis. The red line emphasizes the severity of the downturn. Decrease trade graph illustrations Global Economic Decline. A hand adds to a graph depicting a sharp decline in the global economy, shown as a cracked map. This AI-generated image symbolizes the. A hand adds to a graph depicting a sharp decline in the global economy, shown as a cracked map. This AI-generated image symbolizes the fragility of the world's financial systems and the potential for widespread economic crisis. The red line emphasizes the severity of the downturn.
Free with trial A 3D rendered image of a descending bar chart with teal and gray bars, each progressively lower than the previous, representing a financial or economic downturn. A bold red arrow slants downward across the bars, symbolizing decline. The graph is displayed against a dark background with white grid lines and axis labels, evoking a business or stock market concept. Isolated on a clean, dark surface. Decrease trade graph illustrations 3D rendered bar chart with red arrow showing financial decline. A 3D rendered image of a descending bar chart with teal and gray bars, each progressively lower. A 3D rendered image of a descending bar chart with teal and gray bars, each progressively lower than the previous, representing a financial or economic downturn. A bold red arrow slants downward across the bars, symbolizing decline. The graph is displayed against a dark background with white grid lines and axis labels, evoking a business or stock market concept. Isolated on a clean, dark surface.
Free with trial A 3D rendering of the COVID-19 virus in red, prominently displayed on the left side of the image, with a downward-trending stock market graph in the background. The graph features red lines and bars, indicating a decline in market performance. The dark background emphasizes the negative impact of the pandemic on the economy. This image can be used to illustrate the effects of COVID-19 on global markets, economic downturns, or the relationship between public health crises and financial instability. Decrease trade graph illustrations COVID-19 Impact on Financial Markets. A 3D rendering of the COVID-19 virus in red, prominently displayed on the left side of the image, with a downward-trending. A 3D rendering of the COVID-19 virus in red, prominently displayed on the left side of the image, with a downward-trending stock market graph in the background. The graph features red lines and bars, indicating a decline in market performance. The dark background emphasizes the negative impact of the pandemic on the economy. This image can be used to illustrate the effects of COVID-19 on global markets, economic downturns, or the relationship between public health crises and financial instability.
Free with trial Dramatic red arrow shows oil price drop due to an embargo effect on charts and oil barrels Perfect for financial news and global trade articles. Decrease trade graph illustrations Illustration of an oil embargo against a backdrop of declining market graphs. Dramatic red arrow shows oil price drop due to an embargo effect on charts and oil. Dramatic red arrow shows oil price drop due to an embargo effect on charts and oil barrels Perfect for financial news and global trade articles
Free with trial This graphic illustration depicts a declining financial trend using a bar chart and a line graph. The visual features red bars decreasing in height alongside a red line pointing downward, symbolizing economic loss or market contraction. Various currency symbols are positioned near arrows to emphasize the negative movement against a dark background. Decrease trade graph vectors A financial chart showing a downward trend with red bars and arrows. This graphic illustration depicts a declining financial trend using a bar chart and a line. This graphic illustration depicts a declining financial trend using a bar chart and a line graph. The visual features red bars decreasing in height alongside a red line pointing downward, symbolizing economic loss or market contraction. Various currency symbols are positioned near arrows to emphasize the negative movement against a dark background
Free with trial This minimalist vector illustration depicts a financial chart with a prominent red arrow pointing downwards, symbolizing a significant decline in value or performance. The graphic features clean lines and a simple color palette, emphasizing the negative trend against a neutral backdrop. Below the chart, numerical data points are displayed in a rectangular box, highlighting the extent of the loss. Decrease trade graph vectors A red line graph showing a sharp downward trend on a white background. This minimalist vector illustration depicts a financial chart with a prominent red arrow. This minimalist vector illustration depicts a financial chart with a prominent red arrow pointing downwards, symbolizing a significant decline in value or performance. The graphic features clean lines and a simple color palette, emphasizing the negative trend against a neutral backdrop. Below the chart, numerical data points are displayed in a rectangular box, highlighting the extent of the loss.
Free with trial Collection of twenty-four colorful line icons related to oil industry economics and fuel market trading on white background. Includes symbols of barrels, gas pumps, tanker trucks, cargo ships, pipelines, money bags, dollar coins, charts, arrows, graphs, handshake deals and global trade. Flat outline style in orange, brown and black colors. Ideal for financial reports, energy business presentations, infographics, websites and articles about petroleum prices, investment and logistics. Decrease trade graph vectors Oil Price Market Icons Set Illustration. Collection of twenty-four colorful line icons related to oil industry economics and fuel market trading on white. Collection of twenty-four colorful line icons related to oil industry economics and fuel market trading on white background. Includes symbols of barrels, gas pumps, tanker trucks, cargo ships, pipelines, money bags, dollar coins, charts, arrows, graphs, handshake deals and global trade. Flat outline style in orange, brown and black colors. Ideal for financial reports, energy business presentations, infographics, websites and articles about petroleum prices, investment and logistics.
Free with trial A set of minimalist icons representing data visualization elements. Includes bar graphs in black, white, red, yellow, and green, alongside line charts with connected nodes. Suitable for financial, business, or analytical presentations, infographics, or app interfaces. Decrease trade graph vectors Colorful Bar Graph and Line Chart Icons. A set of minimalist icons representing data visualization elements. Includes bar graphs in black, white, red, yellow. A set of minimalist icons representing data visualization elements. Includes bar graphs in black, white, red, yellow, and green, alongside line charts with connected nodes. Suitable for financial, business, or analytical presentations, infographics, or app interfaces.
Free with trial A 3D representation of a bar chart shows a series of purple bars increasing in height from left to right. However, a yellow arrow curves downwards from the top of the chart, indicating a negative trend or decline. A single gold coin is positioned above the tallest bar, suggesting a connection to financial performance. The entire graphic is presented on a white background. Decrease trade graph illustrations 3D Bar Chart with Downward Trend Arrow and Gold Coin Keywords: business, finance, chart, graph, bar chart, data, statistics, trend. A 3D representation of a bar. A 3D representation of a bar chart shows a series of purple bars increasing in height from left to right. However, a yellow arrow curves downwards from the top of the chart, indicating a negative trend or decline. A single gold coin is positioned above the tallest bar, suggesting a connection to financial performance. The entire graphic is presented on a white background
Free with trial Economic crisis and fall down stock market concept. With digital downward yellow and red financial graph on dark background with dots. 3D rendering. Decrease trade graph illustrations Economic crisis and fall down stock market concept. With digital downward yellow and red financial graph on dark background with dots. 3D rendering
Free with trial A collection of twenty-four colorful flat line icons arranged in a grid on white background, featuring finance, economy and logistics symbols including globe, delivery trucks, gas pump, charts, graphs, money, dollar coins, magnifying glass, money bag and clipboard. Green, blue and beige palette with dark outlines. Perfect for business presentations, financial reports, infographics, websites, apps and marketing materials related to banking, investment, trade, shipping and market analysis. Decrease trade graph vectors Set of Financial Economy and Logistics Icons. A collection of twenty-four colorful flat line icons arranged in a grid on white background, featuring finance. A collection of twenty-four colorful flat line icons arranged in a grid on white background, featuring finance, economy and logistics symbols including globe, delivery trucks, gas pump, charts, graphs, money, dollar coins, magnifying glass, money bag and clipboard. Green, blue and beige palette with dark outlines. Perfect for business presentations, financial reports, infographics, websites, apps and marketing materials related to banking, investment, trade, shipping and market analysis.
Free with trial A collection of twenty-eight colorful flat business and finance icons arranged in a grid on white background, featuring upward and downward trend arrows, bar charts, dollar signs, coins, factory, truck, real estate, tax, balance scale, and mobile payment symbols. Ideal for illustrating economic growth, market analysis, investment, trade, and financial reports in presentations, websites, infographics, and marketing materials. Decrease trade graph vectors Set of Colorful Business Finance Growth Icons. A collection of twenty-eight colorful flat business and finance icons arranged in a grid on white background. A collection of twenty-eight colorful flat business and finance icons arranged in a grid on white background, featuring upward and downward trend arrows, bar charts, dollar signs, coins, factory, truck, real estate, tax, balance scale, and mobile payment symbols. Ideal for illustrating economic growth, market analysis, investment, trade, and financial reports in presentations, websites, infographics, and marketing materials.
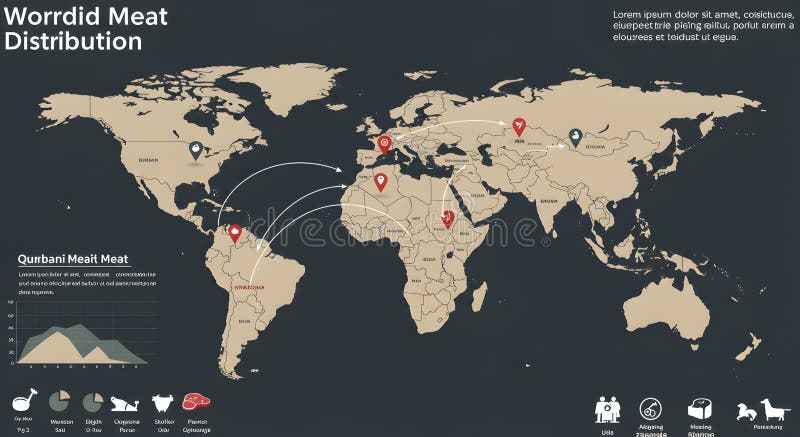
Free with trial A world map showing meat distribution, featuring Qurbani meat data, a graph, and icons representing different animals. Decrease trade graph illustrations World Meat Distribution Map with Qurbani Meat Data and Animal Ic. A world map showing meat distribution, featuring Qurbani meat data, a graph, and icons. A world map showing meat distribution, featuring Qurbani meat data, a graph, and icons representing different animals
Free with trial A 3D financial visualization showing a sharp economic decline. A red downward arrow crashes through green and red bar charts, representing market loss, recession, and the impact on workforce and societ. Decrease trade graph illustrations 3D Economic Crisis Graph with Falling Red Arrow and People Icons. A 3D financial visualization showing a sharp economic decline. A red downward arrow crashes. A 3D financial visualization showing a sharp economic decline. A red downward arrow crashes through green and red bar charts, representing market loss, recession, and the impact on workforce and societ
Free with trial A 3D financial visualization showing a sharp economic decline. A red downward arrow crashes through green and red bar charts, representing market loss, recession, and the impact on workforce and societ. Decrease trade graph illustrations 3D Economic Crisis Graph with Falling Red Arrow and People Icons. A 3D financial visualization showing a sharp economic decline. A red downward arrow crashes. A 3D financial visualization showing a sharp economic decline. A red downward arrow crashes through green and red bar charts, representing market loss, recession, and the impact on workforce and societ
Free with trial A 3D financial visualization showing a sharp economic decline. A red downward arrow crashes through green and red bar charts, representing market loss, recession, and the impact on workforce and societ. Decrease trade graph illustrations 3D Economic Crisis Graph with Falling Red Arrow and People Icons. A 3D financial visualization showing a sharp economic decline. A red downward arrow crashes. A 3D financial visualization showing a sharp economic decline. A red downward arrow crashes through green and red bar charts, representing market loss, recession, and the impact on workforce and societ
Free with trial A colorful set of flat line business and finance icons isolated on white background including newspaper, bar charts, pie chart, dollar coins, money bags, growth arrows, delivery trucks, cargo ships, trains and investment symbols. Designed in red, blue, orange and gray tones. Perfect concept for economy, trade, logistics, banking, market analysis, financial news and e-commerce. Ideal for presentations, websites, apps and infographics. Decrease trade graph vectors Business Finance Logistics Icon Set Collection. A colorful set of flat line business and finance icons isolated on white background including newspaper, bar. A colorful set of flat line business and finance icons isolated on white background including newspaper, bar charts, pie chart, dollar coins, money bags, growth arrows, delivery trucks, cargo ships, trains and investment symbols. Designed in red, blue, orange and gray tones. Perfect concept for economy, trade, logistics, banking, market analysis, financial news and e-commerce. Ideal for presentations, websites, apps and infographics.
Free with trial Collection of thirty-two colorful flat line icons related to business, finance and economy on white background. Includes symbols for money, banking, investment, charts, growth, taxes, bills, shopping carts, shipping, logistics, real estate and analytics. Designed in orange, red, blue and yellow outline style. Perfect concept for financial reports, presentations, websites, mobile apps, infographics and marketing materials illustrating global trade, commerce and economic trends. Decrease trade graph vectors Colorful Business Finance and Economy Icon Set. Collection of thirty-two colorful flat line icons related to business, finance and economy on white background. Collection of thirty-two colorful flat line icons related to business, finance and economy on white background. Includes symbols for money, banking, investment, charts, growth, taxes, bills, shopping carts, shipping, logistics, real estate and analytics. Designed in orange, red, blue and yellow outline style. Perfect concept for financial reports, presentations, websites, mobile apps, infographics and marketing materials illustrating global trade, commerce and economic trends.
Free with trial A set of twenty-eight flat line icons in orange, black and gray illustrating energy crisis, fuel prices, and economic trends. Includes symbols for oil pumps, gas stations, power grids, solar panels, wind turbines, batteries, rising and falling charts, dollars, inflation, supply chain breaks, global trade, and consumer stress. Isolated on white background. Ideal for financial reports, news articles, presentations, and websites covering energy markets, inflation, sustainability, and economic forecasting. Decrease trade graph vectors Energy Crisis Market Trends Icon Collection Set. A set of twenty-eight flat line icons in orange, black and gray illustrating energy crisis, fuel prices, and. A set of twenty-eight flat line icons in orange, black and gray illustrating energy crisis, fuel prices, and economic trends. Includes symbols for oil pumps, gas stations, power grids, solar panels, wind turbines, batteries, rising and falling charts, dollars, inflation, supply chain breaks, global trade, and consumer stress. Isolated on white background. Ideal for financial reports, news articles, presentations, and websites covering energy markets, inflation, sustainability, and economic forecasting.
Free with trial Collection of colorful line icons related to finance, economy and logistics on white background, featuring money bags, dollar coins, banknotes, bar charts with up and down arrows, calculator, briefcase, delivery truck, cargo ship, boxes and location pins. Large central icon shows falling graph over money and bars symbolizing recession, loss and market crash. Ideal for business presentations, economic reports, banking, investment, accounting and supply chain concepts. Decrease trade graph vectors Financial crisis icons set with declining chart. Collection of colorful line icons related to finance, economy and logistics on white background, featuring money. Collection of colorful line icons related to finance, economy and logistics on white background, featuring money bags, dollar coins, banknotes, bar charts with up and down arrows, calculator, briefcase, delivery truck, cargo ship, boxes and location pins. Large central icon shows falling graph over money and bars symbolizing recession, loss and market crash. Ideal for business presentations, economic reports, banking, investment, accounting and supply chain concepts.
Free with trial Colorful flat showing a rising zigzag arrow symbolizing inflation and economic growth, combined with warning signs, downward arrows, shopping cart, factory, bar charts, coins, people icons and gears on white background. Concept represents rising prices, cost of living crisis, market volatility and financial risk. Ideal for business, finance, economy articles, presentations, news reports and educational materials about inflation. Decrease trade graph vectors Rising Inflation Graph with Economic Warning Icons. Colorful flat showing a rising zigzag arrow symbolizing inflation and economic growth, combined with warning. Colorful flat showing a rising zigzag arrow symbolizing inflation and economic growth, combined with warning signs, downward arrows, shopping cart, factory, bar charts, coins, people icons and gears on white background. Concept represents rising prices, cost of living crisis, market volatility and financial risk. Ideal for business, finance, economy articles, presentations, news reports and educational materials about inflation.
Free with trial Economic crisis icon of economy depreciation and business downturn, vector line symbol. Banking investment recession, stock exchange trade fall and money value inflation icon of financial crisis. Decrease trade graph vectors Economic crisis icon economy business depreciation. Economic crisis icon of economy depreciation and business downturn, vector line symbol. Banking investment. Economic crisis icon of economy depreciation and business downturn, vector line symbol. Banking investment recession, stock exchange trade fall and money value inflation icon of financial crisis
Free with trial A collection of flat line finance and investment icons on white background featuring money bags, dollar signs, coins, banknotes, calculators, charts and percentage arrows in green orange and blue tones. Central large icon shows hand holding money bag with falling percent arrow. Perfect for banking, inflation, interest rates, profit loss, budgeting and economic concepts for websites, presentations, apps and infographics. Decrease trade graph vectors Financial Icons Set Money Growth Decrease Symbols. A collection of flat line finance and investment icons on white background featuring money bags, dollar signs. A collection of flat line finance and investment icons on white background featuring money bags, dollar signs, coins, banknotes, calculators, charts and percentage arrows in green orange and blue tones. Central large icon shows hand holding money bag with falling percent arrow. Perfect for banking, inflation, interest rates, profit loss, budgeting and economic concepts for websites, presentations, apps and infographics.
Free with trial A collection of forty colorful flat line icons arranged in a grid on white background featuring financial, logistics and food cost symbols. Includes dollar coins, money bags, banknotes, growth charts, delivery trucks, shipping containers, and restaurant plates with coins. Designed in orange, green and red tones with brown outlines. Perfect for illustrating economy, trade, inflation, transport, business finance, e-commerce and food price concepts in presentations, websites and infographics. Decrease trade graph vectors Colorful Finance Logistics and Food Cost Icons Set. A collection of forty colorful flat line icons arranged in a grid on white background featuring financial. A collection of forty colorful flat line icons arranged in a grid on white background featuring financial, logistics and food cost symbols. Includes dollar coins, money bags, banknotes, growth charts, delivery trucks, shipping containers, and restaurant plates with coins. Designed in orange, green and red tones with brown outlines. Perfect for illustrating economy, trade, inflation, transport, business finance, e-commerce and food price concepts in presentations, websites and infographics.
Free with trial Flat depicting global energy and logistics economy with oil barrels, refinery plant, cargo truck, container ship and airplane. Large orange upward futures arrow and red downward arrow show market volatility, surrounded by gears, currency symbols, bar charts and financial data. Ideal for articles on oil prices, trade, supply chain, transportation, stock market, economic forecasting and industrial growth concepts. Decrease trade graph vectors Global Oil Market Trends with Logistics Illustration. Flat depicting global energy and logistics economy with oil barrels, refinery plant, cargo truck, container. Flat depicting global energy and logistics economy with oil barrels, refinery plant, cargo truck, container ship and airplane. Large orange upward futures arrow and red downward arrow show market volatility, surrounded by gears, currency symbols, bar charts and financial data. Ideal for articles on oil prices, trade, supply chain, transportation, stock market, economic forecasting and industrial growth concepts.
Free with trial Vector depicting economic crisis and industrial decline with large blue gears breaking apart under pressure from a sharp red downward arrow. Surrounding elements include bar charts, line graphs, cargo ship, fuel pump, dollar symbols and network icons in blue, red and gray on white background. Concept of recession, market crash, manufacturing failure. Ideal for financial reports, business presentations, news articles about economy, trade and industry. Decrease trade graph vectors Economic Downturn Concept with Falling Market Graphs. Vector depicting economic crisis and industrial decline with large blue gears breaking apart under pressure. Vector depicting economic crisis and industrial decline with large blue gears breaking apart under pressure from a sharp red downward arrow. Surrounding elements include bar charts, line graphs, cargo ship, fuel pump, dollar symbols and network icons in blue, red and gray on white background. Concept of recession, market crash, manufacturing failure. Ideal for financial reports, business presentations, news articles about economy, trade and industry.
Free with trial A clean, minimalist of a financial chart and graph exhibiting a distinct downward trend and market decline. The graphic features red and orange descending arrows and bars against an isolated white background, symbolizing economic recession, crisis, stock market crash, loss, failure, bankruptcy, and negative financial growth. Perfect for business presentations, corporate reports, economic articles, and financial analysis designs. Decrease trade graph vectors Financial Business Chart Showing Market Downward Trend. A clean, minimalist of a financial chart and graph exhibiting a distinct downward trend and market. A clean, minimalist of a financial chart and graph exhibiting a distinct downward trend and market decline. The graphic features red and orange descending arrows and bars against an isolated white background, symbolizing economic recession, crisis, stock market crash, loss, failure, bankruptcy, and negative financial growth. Perfect for business presentations, corporate reports, economic articles, and financial analysis designs.
Free with trial A collection of flat line finance and business icons arranged in a grid on white background with a large central folder and calculator symbol. Includes symbols for charts, graphs, piggy bank, safe, money, calendar, credit card, warehouse, global trade, and analytics. Designed in muted green, orange, gray and red tones. Perfect concept for accounting, banking, investment, budgeting, reporting, and economic growth. Ideal for websites, presentations, apps, and infographics illustrating financial management. Decrease trade graph vectors Set of Colorful Financial Business Management Icons. A collection of flat line finance and business icons arranged in a grid on white background with a large. A collection of flat line finance and business icons arranged in a grid on white background with a large central folder and calculator symbol. Includes symbols for charts, graphs, piggy bank, safe, money, calendar, credit card, warehouse, global trade, and analytics. Designed in muted green, orange, gray and red tones. Perfect concept for accounting, banking, investment, budgeting, reporting, and economic growth. Ideal for websites, presentations, apps, and infographics illustrating financial management.
Free with trial A conceptual illustration showing stacks of gold coins arranged in a descending graph pattern with a large red arrow pointing downwards, symbolizing economic loss, financial crisis, market decline, and reduced business revenue. Decrease trade graph vectors A red arrow pointing down over stacks of gold coins representing falling profits and decreasing financial business growth isolated. A conceptual illustration. A conceptual illustration showing stacks of gold coins arranged in a descending graph pattern with a large red arrow pointing downwards, symbolizing economic loss, financial crisis, market decline, and reduced business revenue
Free with trial The image features a large black Euro currency symbol with a green upward arrow and a red downward arrow, set against a white background. The green arrow suggests growth or increase, while the red arrow indicates decline or decrease. This visual representation can be used to illustrate financial concepts such as fluctuating currency values, economic trends, or market performance. Decrease trade graph vectors Euro currency symbol with green up and red down arrows. The image features a large black Euro currency symbol with a green upward arrow and a red downward arrow. The image features a large black Euro currency symbol with a green upward arrow and a red downward arrow, set against a white background. The green arrow suggests growth or increase, while the red arrow indicates decline or decrease. This visual representation can be used to illustrate financial concepts such as fluctuating currency values, economic trends, or market performance.
Free with trial A set of 24 colorful flat line icons related to logistics, supply chain and global trade isolated on white background. Includes symbols for delivery truck, warehouse, shipping container, cargo ship, conveyor belt, graphs, currency exchange, fuel, and distribution network. Modern outline style with orange, blue and red colors. Perfect for business presentations, websites, mobile apps, infographics and marketing materials about transportation, warehousing, import export and e-commerce fulfillment. Decrease trade graph vectors Colorful Logistics Supply Chain Management Icons Set. A set of 24 colorful flat line icons related to logistics, supply chain and global trade isolated on white. A set of 24 colorful flat line icons related to logistics, supply chain and global trade isolated on white background. Includes symbols for delivery truck, warehouse, shipping container, cargo ship, conveyor belt, graphs, currency exchange, fuel, and distribution network. Modern outline style with orange, blue and red colors. Perfect for business presentations, websites, mobile apps, infographics and marketing materials about transportation, warehousing, import export and e-commerce fulfillment.
Free with trial Flat of a balance scale weighing economic instability against stability. Left side shows declining chart, rocket, house for sale, money bags and crisis symbols in red. Right side displays rising bar charts, stability arrow, cargo ship, delivery truck and happy people holding coins. Center features hand holding gear. Concept of financial balance, trade, growth and risk management. Ideal for business, finance, economics presentations, articles and marketing materials. Decrease trade graph vectors Balanced Scale Comparing Economic Crisis and Stability. Flat of a balance scale weighing economic instability against stability. Left side shows declining chart. Flat of a balance scale weighing economic instability against stability. Left side shows declining chart, rocket, house for sale, money bags and crisis symbols in red. Right side displays rising bar charts, stability arrow, cargo ship, delivery truck and happy people holding coins. Center features hand holding gear. Concept of financial balance, trade, growth and risk management. Ideal for business, finance, economics presentations, articles and marketing materials.
Free with trial Vector showing economic concept of government subsidy affecting cost of living and production. Features rising arrow graph with business people carrying money bags, large hand placing dollar coin labeled subsidy, family car near house, factory industry worker, market stall, and bus. Visualizes inflation, financial support, industrial growth, and household expenses. Ideal for articles, presentations, and educational materials about economics, finance, policy, and development. Decrease trade graph vectors Economic Subsidy Impact on Cost of Living Illustration. Vector showing economic concept of government subsidy affecting cost of living and production. Features. Vector showing economic concept of government subsidy affecting cost of living and production. Features rising arrow graph with business people carrying money bags, large hand placing dollar coin labeled subsidy, family car near house, factory industry worker, market stall, and bus. Visualizes inflation, financial support, industrial growth, and household expenses. Ideal for articles, presentations, and educational materials about economics, finance, policy, and development.
Free with trial Collection of colorful flat line business and finance icons isolated on white background including handshake, money bag, piggy bank, credit card, bar charts with upward arrows, dollar signs, mortgage documents, house, delivery truck, cargo ship, calculator, and tropical island symbols. Perfect for illustrating banking, investment, growth, real estate, trade, accounting concepts in presentations, websites, apps, and marketing materials. Decrease trade graph vectors Financial Business Icons Set Growth Investment Charts. Collection of colorful flat line business and finance icons isolated on white background including. Collection of colorful flat line business and finance icons isolated on white background including handshake, money bag, piggy bank, credit card, bar charts with upward arrows, dollar signs, mortgage documents, house, delivery truck, cargo ship, calculator, and tropical island symbols. Perfect for illustrating banking, investment, growth, real estate, trade, accounting concepts in presentations, websites, apps, and marketing materials.
Free with trial Illustration of traditional Indonesian market stalls decreasing in size from large to small, symbolizing economic decline of small businesses. Vendors serve customers with vegetables, rice and groceries while stacks of Rupiah coins shrink. Red upward and downward arrows represent market fluctuation. Concept of MSME crisis, inflation, purchasing power, and retail struggle. Ideal for articles on economy, finance, small business, Southeast Asia trade, and financial charts. Decrease trade graph vectors Indonesian Market Stalls Showing Economic Decline Trend. Illustration of traditional Indonesian market stalls decreasing in size from large to small, symbolizing. Illustration of traditional Indonesian market stalls decreasing in size from large to small, symbolizing economic decline of small businesses. Vendors serve customers with vegetables, rice and groceries while stacks of Rupiah coins shrink. Red upward and downward arrows represent market fluctuation. Concept of MSME crisis, inflation, purchasing power, and retail struggle. Ideal for articles on economy, finance, small business, Southeast Asia trade, and financial charts.
Free with trial Several stacks of coins are positioned along a blue line graph on a white background, illustrating financial progress and positive market trends. Decrease trade graph illustrations Coins arranged on a financial chart indicating progress. Several stacks of coins are positioned along a blue line graph on a white background, illustrating. Several stacks of coins are positioned along a blue line graph on a white background, illustrating financial progress and positive market trends
Free with trial A comprehensive set of black grunge-textured icons representing the US Dollar (USD) and its market dynamics. The collection features various symbols indicating upward trends, downward trends, stability, and currency exchange or circulation, often incorporating arrows and graph-like elements. Ideal for financial reports, economic analyses, investment platforms, business presentations, and any design requiring visual representation of money flow, market performance, or currency value changes in a distinct, distressed style. Decrease trade graph vectors Grunge USD Dollar Market Movement and Exchange Icons Set. A comprehensive set of black grunge-textured icons representing the US Dollar (USD) and its market. A comprehensive set of black grunge-textured icons representing the US Dollar (USD) and its market dynamics. The collection features various symbols indicating upward trends, downward trends, stability, and currency exchange or circulation, often incorporating arrows and graph-like elements. Ideal for financial reports, economic analyses, investment platforms, business presentations, and any design requiring visual representation of money flow, market performance, or currency value changes in a distinct, distressed style.
Free with trial A colorful collection of flat line icons related to inflation, rising costs and economic trends on white background. Includes symbols for grocery prices, fuel, housing, mortgage, banking, savings, factory expenses, trade, shipping and employment. Features upward arrows, dollar signs, charts, scales and piggy banks in red, green and orange tones. Ideal for financial articles, business presentations, economic reports and educational materials about cost of living. Decrease trade graph vectors Inflation Economy Icons Set Illustrating Rising Prices. A colorful collection of flat line icons related to inflation, rising costs and economic trends on white. A colorful collection of flat line icons related to inflation, rising costs and economic trends on white background. Includes symbols for grocery prices, fuel, housing, mortgage, banking, savings, factory expenses, trade, shipping and employment. Features upward arrows, dollar signs, charts, scales and piggy banks in red, green and orange tones. Ideal for financial articles, business presentations, economic reports and educational materials about cost of living.
Free with trial Person types on a laptop with financial growth symbols displayed representing investment strategy business success online trading stock market analysis and data driven decision making for financial p. Decrease trade graph illustrations Financial growth investment strategy business success online trading stock market analysis data chart graph money. Person types on a laptop with financial growth. Person types on a laptop with financial growth symbols displayed representing investment strategy business success online trading stock market analysis and data driven decision making for financial p
Free with trial Visualizing india's economic downturn with a stock market crash chart. the red arrow indicates a financial crisis, recession, and potential business losses, highlighting investment risks. Decrease trade graph illustrations India economic crisis stock market crash recession financial downfall business loss investment risk chart graph. Visualizing india's economic downturn with a. visualizing india's economic downturn with a stock market crash chart. the red arrow indicates a financial crisis, recession, and potential business losses, highlighting investment risks.
Free with trial Plummeting bar chart graph with declining downward arrow. AI generated detailed line icon of financial plunge, market loss, and downward chart trend. Decrease trade graph vectors Plummeting bar chart graph with declining downward arrow. AI generated detailed line icon of financial plunge, market loss, and downward chart trend
Free with trial A collection of thirty-two colorful flat line icons arranged in grid on white background illustrating inflation and economic concepts including price changes, housing costs, interest rates, banking, taxes, trade, production, transportation, savings, and market growth. Features symbols like dollar coins, graphs, arrows, factories, ships, and safes in blue orange red palette. Ideal for financial reports, economic presentations, educational materials, business articles, and infographics about recession, finance, and global economy. Decrease trade graph vectors Colorful Economic Inflation Finance Icon Set Collection. A collection of thirty-two colorful flat line icons arranged in grid on white background illustrating. A collection of thirty-two colorful flat line icons arranged in grid on white background illustrating inflation and economic concepts including price changes, housing costs, interest rates, banking, taxes, trade, production, transportation, savings, and market growth. Features symbols like dollar coins, graphs, arrows, factories, ships, and safes in blue orange red palette. Ideal for financial reports, economic presentations, educational materials, business articles, and infographics about recession, finance, and global economy.
Free with trial A comprehensive set of black and white icons for graphs and charts, illustrating various data visualization types and business-related concepts for digital and print media. Decrease trade graph vectors Diverse collection of graph and chart icons representing data analysis and business growth. A comprehensive set of black and white icons for graphs and charts. A comprehensive set of black and white icons for graphs and charts, illustrating various data visualization types and business-related concepts for digital and print media
Free with trial Vector depicting rising and falling fuel costs in Eurozone economy featuring large gas pump nozzle dispensing euro coins, hand holding giant euro coin, red arrow graph trending downward, upward arrows in clouds, cars, delivery truck, house, shopping cart, factory and gears on white background. Symbolizes inflation, energy crisis, transportation expense. Ideal for financial news, economic articles, business presentations about gasoline prices, cost of living and consumer spending. Decrease trade graph vectors Rising Fuel Prices Impacting Euro Economy Illustration. Vector depicting rising and falling fuel costs in Eurozone economy featuring large gas pump nozzle. Vector depicting rising and falling fuel costs in Eurozone economy featuring large gas pump nozzle dispensing euro coins, hand holding giant euro coin, red arrow graph trending downward, upward arrows in clouds, cars, delivery truck, house, shopping cart, factory and gears on white background. Symbolizes inflation, energy crisis, transportation expense. Ideal for financial news, economic articles, business presentations about gasoline prices, cost of living and consumer spending.
Free with trial Flat showing rising logistics and delivery costs impacting business profitability. A delivery worker pushes a truck up a rising cost graph with icons for fuel, maintenance and money. On the right, revenue from stacked parcels funnels down to small profit on a balance scale. Concept of inflation, supply chain expenses, e-commerce challenges. Ideal for business, finance, logistics articles, presentations and marketing about cost management. Decrease trade graph vectors Rising Delivery Costs Reducing Business Profit Illustration. Flat showing rising logistics and delivery costs impacting business profitability. A delivery worker. Flat showing rising logistics and delivery costs impacting business profitability. A delivery worker pushes a truck up a rising cost graph with icons for fuel, maintenance and money. On the right, revenue from stacked parcels funnels down to small profit on a balance scale. Concept of inflation, supply chain expenses, e-commerce challenges. Ideal for business, finance, logistics articles, presentations and marketing about cost management.
Free with trial Vector depicting economic instability with upward and downward trend arrows. Includes icons of a house with coins and price tags, oil barrels, fuel pumps, steel beams, grain sacks, and a cargo ship with falling arrows on waves. Represents concepts of inflation, recession, rising commodity prices, housing costs, and declining trade. Isolated on white background. Ideal for financial articles, economic reports, business presentations, and news about global markets. Decrease trade graph vectors Economic Downturn with Rising Commodity Prices Illustration. Vector depicting economic instability with upward and downward trend arrows. Includes icons of a. Vector depicting economic instability with upward and downward trend arrows. Includes icons of a house with coins and price tags, oil barrels, fuel pumps, steel beams, grain sacks, and a cargo ship with falling arrows on waves. Represents concepts of inflation, recession, rising commodity prices, housing costs, and declining trade. Isolated on white background. Ideal for financial articles, economic reports, business presentations, and news about global markets.
Free with trial Colorful flat line icon set illustrating finance, business, logistics and energy concepts including graphs, calculator, safe, piggy bank, money, credit card, handshake, truck, ship, forklift, factory, building, shopping cart and housing symbols, alongside a large conceptual of inflation as a blue wave with rising red arrow and falling black arrow crushing money, house, fuel and retail icons. Ideal for articles, presentations and marketing about inflation, economy, trade and cost of living. Decrease trade graph vectors Financial Inflation Icons and Economic Crisis Illustration. Colorful flat line icon set illustrating finance, business, logistics and energy concepts including. Colorful flat line icon set illustrating finance, business, logistics and energy concepts including graphs, calculator, safe, piggy bank, money, credit card, handshake, truck, ship, forklift, factory, building, shopping cart and housing symbols, alongside a large conceptual of inflation as a blue wave with rising red arrow and falling black arrow crushing money, house, fuel and retail icons. Ideal for articles, presentations and marketing about inflation, economy, trade and cost of living.
Free with trial Colorful flat infographic illustrating global supply chain concepts including logistics, shipping, rail freight and last-mile delivery. Features truck, cargo ship, train and van icons above red and orange bar charts showing growth and decline trends with arrows. Central globe on balance scale surrounded by factory, fuel and shopping symbols represents global trade balance. Ideal for business presentations, logistics reports, e-commerce articles, transportation marketing and economic analysis visuals. Decrease trade graph vectors Global Logistics Shipping Freight Delivery Infographic Chart. Colorful flat infographic illustrating global supply chain concepts including logistics, shipping. Colorful flat infographic illustrating global supply chain concepts including logistics, shipping, rail freight and last-mile delivery. Features truck, cargo ship, train and van icons above red and orange bar charts showing growth and decline trends with arrows. Central globe on balance scale surrounded by factory, fuel and shopping symbols represents global trade balance. Ideal for business presentations, logistics reports, e-commerce articles, transportation marketing and economic analysis visuals.
Free with trial This image depicts a sharp decrease in wealth and investment value illustrated by tumbling currency alongside a plummeting chart signifying market instability. Decrease trade graph illustrations A dramatic financial downturn with falling gold coins and declining market graph representing economic recession. This image depicts a sharp decrease in wealth. This image depicts a sharp decrease in wealth and investment value illustrated by tumbling currency alongside a plummeting chart signifying market instability
Free with trial Visual representation of the indian economy facing a downturn, with a declining arrow and falling charts, indicating a potential recession and financial crisis. it highlights the challenges and risks. Decrease trade graph illustrations Indian economy crisis rupee symbol stock market crash recession financial downfall economic depression chart graph. Visual representation of the indian economy. visual representation of the indian economy facing a downturn, with a declining arrow and falling charts, indicating a potential recession and financial crisis. it highlights the challenges and risks.
Free with trial This infographic illustrates the industrial production and supply chain process. It features a factory emitting smoke, a large oil barrel, and circular icons representing raw materials like timber, labor, and packaged goods. Arrows depict the flow of materials from production to packaging and distribution. A downward-trending graph suggests economic or production metrics. The design uses a clean, flat style with a blue, orange, and grey color palette, suitable for presentations or reports on manufacturing, logistics, and industrial economics. Decrease trade graph vectors Industrial Factory Supply Chain and Production Flow Infographic. This infographic illustrates the industrial production and supply chain process. It features a. This infographic illustrates the industrial production and supply chain process. It features a factory emitting smoke, a large oil barrel, and circular icons representing raw materials like timber, labor, and packaged goods. Arrows depict the flow of materials from production to packaging and distribution. A downward-trending graph suggests economic or production metrics. The design uses a clean, flat style with a blue, orange, and grey color palette, suitable for presentations or reports on manufacturing, logistics, and industrial economics.
Free with trial Colorful flat depicting rising logistics and transportation costs. A delivery worker pushes a falling dollar bar while a blue delivery truck is squeezed between large boxes symbolizing increasing fuel prices and operating expenses. Elements include a balance scale with packages, upward trend graph, city road and buildings. Perfect concept for inflation, supply chain crisis, e-commerce shipping, economic pressure. Ideal for business articles, finance blogs, and logistics presentations. Decrease trade graph vectors Rising Delivery Costs Crushing Logistics Business Illustration. Colorful flat depicting rising logistics and transportation costs. A delivery worker pushes a. Colorful flat depicting rising logistics and transportation costs. A delivery worker pushes a falling dollar bar while a blue delivery truck is squeezed between large boxes symbolizing increasing fuel prices and operating expenses. Elements include a balance scale with packages, upward trend graph, city road and buildings. Perfect concept for inflation, supply chain crisis, e-commerce shipping, economic pressure. Ideal for business articles, finance blogs, and logistics presentations.
Free with trial A 3D financial visualization showing a sharp economic decline. A red downward arrow crashes through green and red bar charts, representing market loss, recession, and the impact on workforce and societ. Decrease trade graph illustrations 3D Economic Crisis Graph with Falling Red Arrow and People Icons. A 3D financial visualization showing a sharp economic decline. A red downward arrow crashes. A 3D financial visualization showing a sharp economic decline. A red downward arrow crashes through green and red bar charts, representing market loss, recession, and the impact on workforce and societ
Free with trial Financial graph showing rise and fall with stacks of gold coins. Red arrows illustrate upward and downward trends among scattered gold coins and stacks. Decrease trade graph vectors Financial graph showing rise and fall with stacks of gold coins. Red arrows illustrate upward and downward trends among scattered gold coins and stacks
 Sign in