Free with trial Credit card decline financial chart with downward arrow. Economic and financial crisis symbol. AI generated. Decrease trade graph vectors Credit card decline financial chart with downward arrow. Economic and financial crisis symbol. AI generated
Free with trial This image was created using Generative AI. Symbol of financial loss with a red downward arrow over blue bars. Visual representation of market decline and economic recession. Suitable for business charts and reports. Decrease trade graph vectors Financial Loss Icon With Downward Trend Arrow Symbol. This image was created using Generative AI. Symbol of financial loss with a red downward arrow over blue. This image was created using Generative AI. Symbol of financial loss with a red downward arrow over blue bars. Visual representation of market decline and economic recession. Suitable for business charts and reports
Free with trial Colorful flat line icon collection illustrating inflation and rising costs concept on white background, featuring symbols for price tags, banks, wages, energy bills, shipping disruption, shopping carts, housing, groceries, fuel, savings, and global markets with up and down arrows. Ideal for financial articles, economic reports, business presentations, news media, and educational materials explaining cost of living, recession, and monetary policy. Decrease trade graph vectors Inflation Economy Icons Set Price Increase Symbols. Colorful flat line icon collection illustrating inflation and rising costs concept on white background. Colorful flat line icon collection illustrating inflation and rising costs concept on white background, featuring symbols for price tags, banks, wages, energy bills, shipping disruption, shopping carts, housing, groceries, fuel, savings, and global markets with up and down arrows. Ideal for financial articles, economic reports, business presentations, news media, and educational materials explaining cost of living, recession, and monetary policy.
Free with trial A professional 3D rendering of a bar chart illustrating a significant financial decline. The chart features a series of vertical bars that decrease in height, transitioning from grey to red, topped by a prominent red arrow pointing downwards. This visual metaphor effectively communicates concepts like economic recession, market crash, loss of profit, budget cuts, or negative business performance. The clean, modern aesthetic makes it an ideal choice for financial reports, news articles, investment presentations, and business analysis materials focusing on risk management and economic downturns. Decrease trade graph illustrations 3D Bar Chart Showing Financial Market Downtrend. A professional 3D rendering of a bar chart illustrating a significant financial decline. The chart features a. A professional 3D rendering of a bar chart illustrating a significant financial decline. The chart features a series of vertical bars that decrease in height, transitioning from grey to red, topped by a prominent red arrow pointing downwards. This visual metaphor effectively communicates concepts like economic recession, market crash, loss of profit, budget cuts, or negative business performance. The clean, modern aesthetic makes it an ideal choice for financial reports, news articles, investment presentations, and business analysis materials focusing on risk management and economic downturns.
Free with trial A minimal, simple line style illustration of a decreasing bar chart with an arrow pointing downwards, indicating a decline or loss. Perfect for business, finance, and economic themes. Decrease trade graph vectors Simple Line Style Decreasing Bar Chart with Arrow Sign Icon. A minimal, simple line style illustration of a decreasing bar chart with an arrow pointing downwards. A minimal, simple line style illustration of a decreasing bar chart with an arrow pointing downwards, indicating a decline or loss. Perfect for business, finance, and economic themes.
Free with trial A high-quality 3D rendered bar chart on a dark background, illustrating a significant financial decline. The grey bars decrease in height, following a sharp, downward-pointing red arrow that signifies loss, recession, or negative market trends. This conceptual image is ideal for business presentations, financial reports, economic analysis, or articles discussing market volatility, bankruptcy, investment risks, and corporate downturns. The minimalist design provides a clear, professional visual metaphor for negative performance and economic instability in global markets. Decrease trade graph illustrations 3D Bar Chart Showing Financial Decline and Loss. A high-quality 3D rendered bar chart on a dark background, illustrating a significant financial decline. The. A high-quality 3D rendered bar chart on a dark background, illustrating a significant financial decline. The grey bars decrease in height, following a sharp, downward-pointing red arrow that signifies loss, recession, or negative market trends. This conceptual image is ideal for business presentations, financial reports, economic analysis, or articles discussing market volatility, bankruptcy, investment risks, and corporate downturns. The minimalist design provides a clear, professional visual metaphor for negative performance and economic instability in global markets.
Free with trial A set of 28 colorful flat line icons illustrating oil crisis, energy shortage and petroleum market concepts on white background. Includes oil barrels, pumpjacks, pipelines, offshore rigs, tankers, gas station, price charts with arrows, dollar signs, warning signs, factory, trucks, newspaper, storage tank, scales and stressed businessmen. Perfect for business, finance, economy, environment and energy presentations, infographics, websites and editorial use. Decrease trade graph vectors Oil Crisis Energy Icons Collection Set Illustration. A set of 28 colorful flat line icons illustrating oil crisis, energy shortage and petroleum market concepts. A set of 28 colorful flat line icons illustrating oil crisis, energy shortage and petroleum market concepts on white background. Includes oil barrels, pumpjacks, pipelines, offshore rigs, tankers, gas station, price charts with arrows, dollar signs, warning signs, factory, trucks, newspaper, storage tank, scales and stressed businessmen. Perfect for business, finance, economy, environment and energy presentations, infographics, websites and editorial use.
Free with trial A set of six arrows, both upward and downward, in blue, black, and white, each with three dollar sign icons. The arrows represent financial trends, economic growth, decline, or market fluctuations. Ideal for business, finance, or investment-related designs, presentations, or infographics. Decrease trade graph vectors Financial Growth and Decline Arrows with Dollar Signs. A set of six arrows, both upward and downward, in blue, black, and white, each with three dollar sign. A set of six arrows, both upward and downward, in blue, black, and white, each with three dollar sign icons. The arrows represent financial trends, economic growth, decline, or market fluctuations. Ideal for business, finance, or investment-related designs, presentations, or infographics.
Free with trial Viewing Progress Icon Line Design Style Finance and Business Symbol. Vector Illustrations. Decrease trade graph vectors Viewing Progress Icon Line Design Style Finance and Business Symbol. Vector Illustrations
Free with trial An informative business infographic illustrating the financial impact of delivery delays on company revenue. The visual outlines causes including unforeseen delays, supply chain disruptions, and logistics issues. Consequences feature customer dissatisfaction, cancelled orders, and loss of sales. Business impact highlights decreased revenue, profit reduction, and increased operational costs. Central imagery shows a delivery truck descending a zigzag arrow, scattered late packages, and a stressed businessman viewing a thirty percent revenue drop on his laptop screen, making it ideal for logistics, supply chain, and business management presentations. Decrease trade graph vectors Business Revenue Loss From Delivery Delays Infographic. An informative business infographic illustrating the financial impact of delivery delays on company. An informative business infographic illustrating the financial impact of delivery delays on company revenue. The visual outlines causes including unforeseen delays, supply chain disruptions, and logistics issues. Consequences feature customer dissatisfaction, cancelled orders, and loss of sales. Business impact highlights decreased revenue, profit reduction, and increased operational costs. Central imagery shows a delivery truck descending a zigzag arrow, scattered late packages, and a stressed businessman viewing a thirty percent revenue drop on his laptop screen, making it ideal for logistics, supply chain, and business management presentations.
Free with trial A colorful flat line icon set illustrating business finance concepts including profit, loss, revenue, cost, savings and investment. Icons feature calculators, piggy bank, bar charts, scales, invoices, cash register, handshake, factory, shopping cart, target and money symbols in orange, blue and green tones on white background. Perfect for accounting presentations, financial reports, economic articles, business infographics and educational materials about money management. Decrease trade graph vectors Financial Profit Cost Business Icons Collection Set. A colorful flat line icon set illustrating business finance concepts including profit, loss, revenue, cost. A colorful flat line icon set illustrating business finance concepts including profit, loss, revenue, cost, savings and investment. Icons feature calculators, piggy bank, bar charts, scales, invoices, cash register, handshake, factory, shopping cart, target and money symbols in orange, blue and green tones on white background. Perfect for accounting presentations, financial reports, economic articles, business infographics and educational materials about money management.
Free with trial Vector of a tipped black oil barrel spilling crude oil with falling and rising market arrows, pumpjacks, power lines, gears, trucks, cargo ship, and financial symbols. Represents oil price volatility, energy crisis, economic downturn, and industrial disruption. Isolated on white background. Ideal for business, finance, energy, stock market, inflation, and environmental pollution articles, presentations, and editorial use. Decrease trade graph vectors Oil Price Crash Impact on Global Economy Illustration. Vector of a tipped black oil barrel spilling crude oil with falling and rising market arrows, pumpjacks. Vector of a tipped black oil barrel spilling crude oil with falling and rising market arrows, pumpjacks, power lines, gears, trucks, cargo ship, and financial symbols. Represents oil price volatility, energy crisis, economic downturn, and industrial disruption. Isolated on white background. Ideal for business, finance, energy, stock market, inflation, and environmental pollution articles, presentations, and editorial use.
Free with trial Colorful flat showing a large metal vise labeled costs and expenses squeezing a delivery worker with packages, symbolizing shrinking profit margin. Surrounded by rising red arrows, coins, fuel pumps, bar charts and graphs representing inflation, revenue decline and financial pressure. Concept of economic squeeze, logistics challenges and business struggle. Ideal for articles on inflation, supply chain, accounting, small business finance and economic crisis. Decrease trade graph vectors Business Profit Squeezed by Rising Costs Illustration. Colorful flat showing a large metal vise labeled costs and expenses squeezing a delivery worker with. Colorful flat showing a large metal vise labeled costs and expenses squeezing a delivery worker with packages, symbolizing shrinking profit margin. Surrounded by rising red arrows, coins, fuel pumps, bar charts and graphs representing inflation, revenue decline and financial pressure. Concept of economic squeeze, logistics challenges and business struggle. Ideal for articles on inflation, supply chain, accounting, small business finance and economic crisis.
Free with trial A futuristic robotic hand reaches towards interactive financial charts, showcasing cutting-edge technology in data analysis and stock market trends with vivid color accents. Scalp. Decrease trade graph illustrations Advanced robotic hand interacting with dynamic financial charts and graphs, artificial intelligence analysis, stock. A futuristic robotic hand reaches towards. A futuristic robotic hand reaches towards interactive financial charts, showcasing cutting-edge technology in data analysis and stock market trends with vivid color accents. Scalp
Free with trial Flat showing an economic imbalance scale comparing rising fuel prices and declining purchasing power for groceries. One side holds gas cans, pump icon and upward chart, the other holds food basket, wallet, coins and worried couple with downward trend. Includes road, price signs and dark cloud. Ideal for articles on inflation, recession, cost of living, energy crisis and household budgeting. Decrease trade graph vectors Inflation Concept With Rising Fuel and Food Prices. Flat showing an economic imbalance scale comparing rising fuel prices and declining purchasing power for. Flat showing an economic imbalance scale comparing rising fuel prices and declining purchasing power for groceries. One side holds gas cans, pump icon and upward chart, the other holds food basket, wallet, coins and worried couple with downward trend. Includes road, price signs and dark cloud. Ideal for articles on inflation, recession, cost of living, energy crisis and household budgeting.
Free with trial A striking financial concept image featuring a series of white downward-pointing arrows decreasing in size, set against a dark red background with glowing abstract data charts. This powerful visual metaphor represents economic decline, market crash, decreasing stocks, financial loss, and negative trends. Ideal for corporate presentations, financial reports, economic news articles, and risk management illustrations, this high-quality 3D render effectively communicates concepts of recession, downfall, and business failure. Decrease trade graph illustrations Financial Market Drop With Downward Arrows Showing Loss. A striking financial concept image featuring a series of white downward-pointing arrows decreasing in. A striking financial concept image featuring a series of white downward-pointing arrows decreasing in size, set against a dark red background with glowing abstract data charts. This powerful visual metaphor represents economic decline, market crash, decreasing stocks, financial loss, and negative trends. Ideal for corporate presentations, financial reports, economic news articles, and risk management illustrations, this high-quality 3D render effectively communicates concepts of recession, downfall, and business failure.
Free with trial A 3D rendered financial concept image showcasing two contrasting arrows against a clean white background. On the left, a red downward-pointing arrow represents loss and negative expenses, labeled with the words 'LOSS' and 'EXPENSES -21%'. On the right, a vibrant green upward-pointing arrow symbolizes profit and growth, accompanied by the text 'PROFIT' and '+34%'. This conceptual stock photo is ideal for business presentations, financial reports, economic analysis, corporate performance reviews, and investment strategy marketing materials. Decrease trade graph illustrations Loss versus Profit Financial Growth and Decline Arrows. A 3D rendered financial concept image showcasing two contrasting arrows against a clean white background. A 3D rendered financial concept image showcasing two contrasting arrows against a clean white background. On the left, a red downward-pointing arrow represents loss and negative expenses, labeled with the words 'LOSS' and 'EXPENSES -21%'. On the right, a vibrant green upward-pointing arrow symbolizes profit and growth, accompanied by the text 'PROFIT' and '+34%'. This conceptual stock photo is ideal for business presentations, financial reports, economic analysis, corporate performance reviews, and investment strategy marketing materials.
Free with trial This image was created using Generative AI. A minimalist financial bar chart icon featuring a downward pointing arrow and a money bag symbol, representing business loss, economic recession, and budget cuts. Decrease trade graph vectors Financial Bar Chart Showing Declining Profits and Decreasing Revenue Growth Rate. This image was created using Generative AI. A minimalist financial bar chart. This image was created using Generative AI. A minimalist financial bar chart icon featuring a downward pointing arrow and a money bag symbol, representing business loss, economic recession, and budget cuts
Free with trial A collection of nine flat vector icons for data visualization including bar graphs, line charts, pie charts, and performance meters isolated on a white background. Decrease trade graph vectors Simple black data analysis and business chart icon set. A collection of nine flat vector icons for data visualization including bar graphs, line charts, pie. A collection of nine flat vector icons for data visualization including bar graphs, line charts, pie charts, and performance meters isolated on a white background
Free with trial Flat of a businesswoman pushing a grocery cart filled with food while carrying housing and energy bills under a large falling arrow with percent and dollar symbols. Includes home icon, fuel nozzle, money, and shopping items symbolizing inflation, cost of living crisis, recession and financial stress. Isolated on white background. Ideal for articles, blogs and presentations about economy, budgeting, consumer prices and household expenses. Decrease trade graph vectors Woman Struggling With Rising Living Costs Illustration. Flat of a businesswoman pushing a grocery cart filled with food while carrying housing and energy bills. Flat of a businesswoman pushing a grocery cart filled with food while carrying housing and energy bills under a large falling arrow with percent and dollar symbols. Includes home icon, fuel nozzle, money, and shopping items symbolizing inflation, cost of living crisis, recession and financial stress. Isolated on white background. Ideal for articles, blogs and presentations about economy, budgeting, consumer prices and household expenses.
Free with trial A bustling market scene with stalls displaying upward and downward financial trends represented by glowing green and red arrows, symbolizing economic activity. Decrease trade graph illustrations Market stalls with financial growth and decline indicators. A bustling market scene with stalls displaying upward and downward financial trends represented by. A bustling market scene with stalls displaying upward and downward financial trends represented by glowing green and red arrows, symbolizing economic activity
Free with trial A dynamic black and white background pattern featuring a collection of hand-drawn financial and economic elements. The design includes various currency symbols like the Dollar, Euro, and Yen, alongside upward and downward arrows, zig-zag lines representing market volatility, and simple bar charts indicating growth or decline. Scattered ink splatters add a grunge, artistic touch to the overall composition. This versatile illustration is ideal for conveying concepts related to global finance, business trends, investment, stock market fluctuations, economic data, and wealth management in a creative and engaging way. Decrease trade graph vectors Hand Drawn Financial Market Elements Background Pattern. A dynamic black and white background pattern featuring a collection of hand-drawn financial and economic. A dynamic black and white background pattern featuring a collection of hand-drawn financial and economic elements. The design includes various currency symbols like the Dollar, Euro, and Yen, alongside upward and downward arrows, zig-zag lines representing market volatility, and simple bar charts indicating growth or decline. Scattered ink splatters add a grunge, artistic touch to the overall composition. This versatile illustration is ideal for conveying concepts related to global finance, business trends, investment, stock market fluctuations, economic data, and wealth management in a creative and engaging way.
Free with trial Four icons depict bar charts with line graphs and arrows. Each icon features three bars in different colors—blue, red, green, and yellow. Arrows indicate upward and downward trends. Two icons use color while the other two are in black and white. These symbols represent financial or data analysis concepts, illustrating fluctuations or comparisons within datasets through simple, clear visual representations. Decrease trade graph vectors Four Profit Growth and Decline Icons Line and Silhouette Set. Four icons depict bar charts with line graphs and arrows. Each icon features three bars in. Four icons depict bar charts with line graphs and arrows. Each icon features three bars in different colors—blue, red, green, and yellow. Arrows indicate upward and downward trends. Two icons use color while the other two are in black and white. These symbols represent financial or data analysis concepts, illustrating fluctuations or comparisons within datasets through simple, clear visual representations.
Free with trial A set of colorful flat line business and finance icons arranged in rows on white background, including shopping cart, gears, pie charts, bar graphs with upward arrows, dollar coins, money bags, factory buildings, delivery trucks, calendar, hand holding coin, house and businessman. Modern minimal outline style with orange, green, blue and red colors. Perfect for economic reports, banking, investment, e-commerce, marketing presentations, websites and mobile apps. Decrease trade graph vectors Colorful Business Finance Economy Icon Set Collection. A set of colorful flat line business and finance icons arranged in rows on white background, including. A set of colorful flat line business and finance icons arranged in rows on white background, including shopping cart, gears, pie charts, bar graphs with upward arrows, dollar coins, money bags, factory buildings, delivery trucks, calendar, hand holding coin, house and businessman. Modern minimal outline style with orange, green, blue and red colors. Perfect for economic reports, banking, investment, e-commerce, marketing presentations, websites and mobile apps.
Free with trial Reciprocal tariffs and stock market crashes and economic decline or falling stock market prices Inflation and economic decline. Decrease trade graph illustrations Reciprocal tariffs and stock market crashes and economic decline or falling stock market prices Inflation and economic decline.
Free with trial Flat showing a yellow wallet being squeezed by a large red downward arrow, with banknotes and coins falling out on white background. Below is a declining bar chart symbolizing loss. Represents financial crisis, recession, inflation, bankruptcy, budget cuts and economic downturn. Ideal for articles, presentations and marketing materials about personal finance, investment risk, debt and money management. Decrease trade graph vectors Financial Crisis Concept With Empty Wallet Illustration. Flat showing a yellow wallet being squeezed by a large red downward arrow, with banknotes and coins. Flat showing a yellow wallet being squeezed by a large red downward arrow, with banknotes and coins falling out on white background. Below is a declining bar chart symbolizing loss. Represents financial crisis, recession, inflation, bankruptcy, budget cuts and economic downturn. Ideal for articles, presentations and marketing materials about personal finance, investment risk, debt and money management.
Free with trial Flat depicting energy market volatility with oil barrels, gasoline pumps, electric vehicle charging stations, gas pipelines, power transmission towers, fuel tanker trucks, money bags, and fluctuating arrow charts. Orange, black and gray icons on white background symbolize price instability, supply crisis, inflation and global demand. Ideal for financial reports, news articles, presentations and educational materials about oil, gas, electricity and economic trends. Decrease trade graph vectors Energy Market Volatility with Oil Gas Electricity Icons. Flat depicting energy market volatility with oil barrels, gasoline pumps, electric vehicle charging. Flat depicting energy market volatility with oil barrels, gasoline pumps, electric vehicle charging stations, gas pipelines, power transmission towers, fuel tanker trucks, money bags, and fluctuating arrow charts. Orange, black and gray icons on white background symbolize price instability, supply crisis, inflation and global demand. Ideal for financial reports, news articles, presentations and educational materials about oil, gas, electricity and economic trends.
Free with trial Colorful infographic showing how inflation erodes business profits. A red flame monster labeled inflation devours blocks representing operational costs, while factory workers handle fuel and labor expenses. Blue bar charts labeled profits rise then crumble, with a red downward arrow indicating profit erosion and a worried worker. Ideal for articles on economics, manufacturing challenges, rising costs, financial crisis, and business strategy presentations. Decrease trade graph vectors Inflation Causing Profit Erosion in Industrial Business. Colorful infographic showing how inflation erodes business profits. A red flame monster labeled. Colorful infographic showing how inflation erodes business profits. A red flame monster labeled inflation devours blocks representing operational costs, while factory workers handle fuel and labor expenses. Blue bar charts labeled profits rise then crumble, with a red downward arrow indicating profit erosion and a worried worker. Ideal for articles on economics, manufacturing challenges, rising costs, financial crisis, and business strategy presentations.
Free with trial People drive the stock market. And that is the theme of this illustration of people on an up and down stock market chart. Decrease trade graph illustrations People drive the stock market. And that is the theme of this illustration of people on an up and down stock market chart
Free with trial This image was created using Generative AI. Two black icons with white percentage signs and arrows indicating increase or decrease. Decrease trade graph vectors Percentage signs with arrows indicating change or update. This image was created using Generative AI. Two black icons with white percentage signs and arrows. This image was created using Generative AI. Two black icons with white percentage signs and arrows indicating increase or decrease
Free with trial This image was created using Generative AI. Black and white financial graphs illustrating decline in profits and earnings. Decrease trade graph vectors Financial graphs showing decline in profits and earnings. This image was created using Generative AI. Black and white financial graphs illustrating decline in. This image was created using Generative AI. Black and white financial graphs illustrating decline in profits and earnings
Free with trial Professional Vector Logo Design High-Resolution & Fully Editable This high-quality vector logo is designed with precision and creativity making it ideal for modern businesses, startups, and creative professionals The design is clean, scalable, and easy to customize—perfect for branding marketing materials, websites, and print applications. Key Features:100% Vector format (AI EPS SVG)Fully editable (colors, text, and shapes)High resolution – perfect for both web and print Modern, professional, and versatile design Ready for branding and promotional use Elevate your brand with this premium quality logo!. Decrease trade graph vectors Gear with drop down arrow trade crisis economy oil price crash gradient style icon Free Vector. Professional Vector Logo Design High-Resolution & Fully Editable. Professional Vector Logo Design High-Resolution & Fully Editable This high-quality vector logo is designed with precision and creativity making it ideal for modern businesses, startups, and creative professionals The design is clean, scalable, and easy to customize—perfect for branding marketing materials, websites, and print applications. Key Features:100% Vector format (AI EPS SVG)Fully editable (colors, text, and shapes)High resolution – perfect for both web and print Modern, professional, and versatile design Ready for branding and promotional use Elevate your brand with this premium quality logo!
Free with trial Colorful flat depicting inflation and rising cost of living concept. A balance scale compares a heavy money bag with dollar euro pound symbols against groceries, housing and fuel. Surrounding icons include factories, shopping carts, thermometer, upward arrows, charts and gears. Ideal for financial articles, economic reports, business presentations and news about price increases, purchasing power and global economy. Decrease trade graph vectors Inflation Concept with Rising Prices and Economy Balance. Colorful flat depicting inflation and rising cost of living concept. A balance scale compares a heavy. Colorful flat depicting inflation and rising cost of living concept. A balance scale compares a heavy money bag with dollar euro pound symbols against groceries, housing and fuel. Surrounding icons include factories, shopping carts, thermometer, upward arrows, charts and gears. Ideal for financial articles, economic reports, business presentations and news about price increases, purchasing power and global economy.
Free with trial Vector infographic showing economic crisis and market downturn on white background. Top red bar chart with falling arrow and warning signs branches into orange and blue trends. Icons include shopping cart, gas pump, fuel cans, delivery truck, coins, dollar symbols, bar graphs and declining arrows. Concept represents inflation, rising fuel prices, logistics costs and financial recession. Ideal for business, finance, news, education and economic analysis presentations. Decrease trade graph vectors Economic Downturn Infographic with Market Decline Charts. Vector infographic showing economic crisis and market downturn on white background. Top red bar chart. Vector infographic showing economic crisis and market downturn on white background. Top red bar chart with falling arrow and warning signs branches into orange and blue trends. Icons include shopping cart, gas pump, fuel cans, delivery truck, coins, dollar symbols, bar graphs and declining arrows. Concept represents inflation, rising fuel prices, logistics costs and financial recession. Ideal for business, finance, news, education and economic analysis presentations.
Free with trial Financial Decline Bar Chart Downward Arrow Crisis Concept, illustration. Decrease trade graph illustrations Financial Decline Bar Chart Downward Arrow Crisis Concept. Illustration
Free with trial Vector infographic showing fuel price dynamics with supply, price, and demand concepts. Features gas station, fuel pump, oil pumpjack, tanker truck, barrels, nozzles, cars, trucks, buses, rising arrows, bar charts, pie chart, gauges and dollar symbols in orange, brown and black colors. Visualizes limited supply, increasing prices and growing demand. Ideal for energy crisis, economy, inflation, transportation and oil industry articles, presentations and educational materials. Decrease trade graph vectors Fuel Price Supply and Demand Infographic Illustration. Vector infographic showing fuel price dynamics with supply, price, and demand concepts. Features gas. Vector infographic showing fuel price dynamics with supply, price, and demand concepts. Features gas station, fuel pump, oil pumpjack, tanker truck, barrels, nozzles, cars, trucks, buses, rising arrows, bar charts, pie chart, gauges and dollar symbols in orange, brown and black colors. Visualizes limited supply, increasing prices and growing demand. Ideal for energy crisis, economy, inflation, transportation and oil industry articles, presentations and educational materials.
Free with trial Oil pumpjack monitors stock market with candlestick chart. Dark green oil pumpjack operates against a black background with glowing red and green candlestick. Decrease trade graph illustrations Oil pumpjack monitors stock market with candlestick chart. Dark green oil pumpjack operates against a black background with glowing red and green candlestick
Free with trial Flat showing the economic impact of rising fuel prices on logistics and retail. Features gas pump icons, upward cost arrows, a large red downward arrow, delivery truck, cargo ship, shopping cart, cash register, coins and percentage symbols. Concept visualizes supply chain costs, inflation, and declining retail profit in euros. Isolated on white background, ideal for business, finance, energy crisis, and economic articles, presentations, and reports. Decrease trade graph vectors Rising Fuel Costs Impacting Retail Profit Illustration. Flat showing the economic impact of rising fuel prices on logistics and retail. Features gas pump icons. Flat showing the economic impact of rising fuel prices on logistics and retail. Features gas pump icons, upward cost arrows, a large red downward arrow, delivery truck, cargo ship, shopping cart, cash register, coins and percentage symbols. Concept visualizes supply chain costs, inflation, and declining retail profit in euros. Isolated on white background, ideal for business, finance, energy crisis, and economic articles, presentations, and reports.
Free with trial Green Global economic crisis icon isolated on green background. World finance crisis. Long shadow style. Vector. Decrease trade graph vectors Green Global economic crisis icon isolated on green background. World finance crisis. Long shadow style. Vector.
Free with trial Growth financial business on white background. Isolated 3D illustration. Decrease trade graph illustrations Growth financial business on white background. Isolated 3D illustration.
Free with trial A red arrow drop-down with table on white background. Businese concept. Decrease trade graph vectors A red arrow drop-down with table on white background. Businese concept. A red arrow drop-down with table on a white background. Businese concept
Free with trial Set line Falling property prices, Shutdown of factory, Drop crude oil and Global economic crisis news icon. Vector. Decrease trade graph illustrations Set line Falling property prices, Shutdown of factory, Drop crude oil and Global economic crisis news icon. Vector.
Free with trial Infographic divided into two sections showing Rising Fuel Costs and Economic Impact and Solutions with upward orange and red arrows and downward black arrows surrounded by icons of truck, factory, cargo ship, gas pumps, bar charts, pie chart, gears and wallet on white background representing energy price inflation, transportation expense, industrial production and financial crisis concept ideal for business, finance, logistics and environmental articles. Decrease trade graph vectors Rising Fuel Costs Economic Impact Infographic Illustration. Infographic divided into two sections showing Rising Fuel Costs and Economic Impact and Solutions. Infographic divided into two sections showing Rising Fuel Costs and Economic Impact and Solutions with upward orange and red arrows and downward black arrows surrounded by icons of truck, factory, cargo ship, gas pumps, bar charts, pie chart, gears and wallet on white background representing energy price inflation, transportation expense, industrial production and financial crisis concept ideal for business, finance, logistics and environmental articles.
Free with trial A flat depicting a businessman pushing a large gold coin toward a series of coin stacks of varying heights. Above each stack, there are circular icons with downward-pointing arrows, suggesting a decrease in value, savings, or investment returns. The clean, minimalist design uses a soft color palette, making it ideal for financial reports, business articles, investment blogs, banking websites, or educational materials about economic trends, personal finance management, and strategic capital allocation. The image effectively communicates themes of growth, investment, savings, and financial planning in a modern, professional style. Decrease trade graph vectors Businessman Pushing Large Gold Coin Towards Coin Stacks. A flat depicting a businessman pushing a large gold coin toward a series of coin stacks of varying. A flat depicting a businessman pushing a large gold coin toward a series of coin stacks of varying heights. Above each stack, there are circular icons with downward-pointing arrows, suggesting a decrease in value, savings, or investment returns. The clean, minimalist design uses a soft color palette, making it ideal for financial reports, business articles, investment blogs, banking websites, or educational materials about economic trends, personal finance management, and strategic capital allocation. The image effectively communicates themes of growth, investment, savings, and financial planning in a modern, professional style.
Free with trial Illustration of bear and arrow up. Ai illustration. Decrease trade graph illustrations Illustration of bear and arrow up Ai illustration. Illustration of bear and arrow up. Ai illustration. Illustration of bear and arrow up. Ai illustration.
Free with trial Comprehensive featuring business and financial infographic elements, bar charts, growth arrows, currency symbols, money bags, coins, documents, lightbulbs, and analytical graphs. Designed with a clean flat line art style on a white background, this graphic is ideal for corporate presentations, financial reports, business strategy concepts, economic analysis, banking promotions, and marketing materials related to investment, profit, and success. Decrease trade graph vectors Infographic Elements With Financial Charts And Business Icons. Comprehensive featuring business and financial infographic elements, bar charts, growth arrows. Comprehensive featuring business and financial infographic elements, bar charts, growth arrows, currency symbols, money bags, coins, documents, lightbulbs, and analytical graphs. Designed with a clean flat line art style on a white background, this graphic is ideal for corporate presentations, financial reports, business strategy concepts, economic analysis, banking promotions, and marketing materials related to investment, profit, and success.
Free with trial Vector showing a large balance scale representing supply, stability and market equilibrium. One side holds rising arrows, price tag and growth symbols, the other holds anchor and weights symbolizing costs and falling prices. Small business people adjust gears and mechanisms around demand charts. Flat design in blue, orange and gray on white background. Ideal for finance, economics, business strategy, inflation and market analysis concepts. Decrease trade graph vectors Business Balance Between Supply Demand and Market Stability. Vector showing a large balance scale representing supply, stability and market equilibrium. One side. Vector showing a large balance scale representing supply, stability and market equilibrium. One side holds rising arrows, price tag and growth symbols, the other holds anchor and weights symbolizing costs and falling prices. Small business people adjust gears and mechanisms around demand charts. Flat design in blue, orange and gray on white background. Ideal for finance, economics, business strategy, inflation and market analysis concepts.
Free with trial Reciprocal tariffs and stock market crashes and economic decline or falling stock market prices. Decrease trade graph illustrations Reciprocal tariffs and stock market crashes and economic decline or falling stock market prices.
Free with trial A clean, black and white representing climate forecasting and predictive analytics. The design features a stylized globe intertwined with upward-trending and downward-trending data graphs, economic arrows, and a small cloud symbol. This conceptual icon is perfect for use in environmental studies, corporate sustainability reports, financial forecasting presentations, weather analytics applications, and global data science projects requiring professional infographics and modern symbolic imagery. Decrease trade graph illustrations Climate Forecasting and Predictive Analytics Concept Vector. A clean, black and white representing climate forecasting and predictive analytics. The design. A clean, black and white representing climate forecasting and predictive analytics. The design features a stylized globe intertwined with upward-trending and downward-trending data graphs, economic arrows, and a small cloud symbol. This conceptual icon is perfect for use in environmental studies, corporate sustainability reports, financial forecasting presentations, weather analytics applications, and global data science projects requiring professional infographics and modern symbolic imagery.
Free with trial Range Breakout vector Candlestick Chart icon or symbol. Decrease trade graph vectors Range Breakout vector Candlestick Chart icon or symbol. Range Breakout vector Candlestick Chart concept icon or symbol
Free with trial Illustration of economic growth is depicted by a green staircase ascending toward light, symbolizing progress and increased prosperity. Decrease trade graph vectors Illustration of economic growth is depicted by a green staircase ascending toward light. Symbolizing progress and increased prosperity
Free with trial Three coin stacks on yellow background represent decline. Stacks reduce in size indicating financial loss or decreasing trends. Concept of budget crisis economic, downturn visualized. Decrease trade graph illustrations Three coin stacks on yellow background represent decline. Stacks reduce in size indicating financial loss or decreasing trends. Concept of budget crisis
Free with trial This illustration represents retail economics, featuring a shopping cart, price tag, head with dollar sign, and coin with arrow, symbolizing financial concepts. Decrease trade graph vectors Vector art of illustration showcasing retail economics with shopping cart, price tag, head with dollar sign, and coin with upward. This illustration represents. This illustration represents retail economics, featuring a shopping cart, price tag, head with dollar sign, and coin with arrow, symbolizing financial concepts
Free with trial Flat depicting economic concepts of inflation, rising prices and market volatility. Central rising and falling arrows on a chart background surrounded by icons including shopping cart with groceries, house with price tag, delivery truck, stacks of coins with office building, and confused consumer with empty pockets. Ideal for finance, economy, recession, cost of living, real estate and business articles, presentations and educational materials. Decrease trade graph vectors Inflation and Economic Growth Concept Illustration with Graphs. Flat depicting economic concepts of inflation, rising prices and market volatility. Central. Flat depicting economic concepts of inflation, rising prices and market volatility. Central rising and falling arrows on a chart background surrounded by icons including shopping cart with groceries, house with price tag, delivery truck, stacks of coins with office building, and confused consumer with empty pockets. Ideal for finance, economy, recession, cost of living, real estate and business articles, presentations and educational materials.
Free with trial Vector showing a large hand pushing down a red declining arrow onto a broken road filled with congested cars, buses, trucks and motorcycles. Bar charts rise in background while gold coins scatter. A heavy chain with dollar symbols surrounds the scene, symbolizing supply chain disruption, logistics crisis, traffic congestion, inflation and economic recession. Ideal for business, finance, transportation and economic articles, presentations and marketing materials. Decrease trade graph vectors Supply Chain Disruption Causing Economic Downturn Illustration. Vector showing a large hand pushing down a red declining arrow onto a broken road filled with. Vector showing a large hand pushing down a red declining arrow onto a broken road filled with congested cars, buses, trucks and motorcycles. Bar charts rise in background while gold coins scatter. A heavy chain with dollar symbols surrounds the scene, symbolizing supply chain disruption, logistics crisis, traffic congestion, inflation and economic recession. Ideal for business, finance, transportation and economic articles, presentations and marketing materials.
Free with trial Vector of a worried businessman reacting to a sharp red downward arrow over collapsing bar charts, falling coins, gears and broken puzzle pieces with down arrows on white background. Symbolizes financial crisis, recession, stock market crash, business failure and economic loss. Modern flat style in red, orange and gray. Ideal for finance articles, business presentations, investment risk, bankruptcy and economic analysis concepts. Decrease trade graph vectors Businessman Facing Economic Downturn Market Crash Illustration. Vector of a worried businessman reacting to a sharp red downward arrow over collapsing bar charts. Vector of a worried businessman reacting to a sharp red downward arrow over collapsing bar charts, falling coins, gears and broken puzzle pieces with down arrows on white background. Symbolizes financial crisis, recession, stock market crash, business failure and economic loss. Modern flat style in red, orange and gray. Ideal for finance articles, business presentations, investment risk, bankruptcy and economic analysis concepts.
Free with trial An detailed set of stock market financial trends and business growth line icons for data analysis and reporting. Decrease trade graph vectors Stock market financial trends and business growth line icons. An ai generated detailed set of stock market financial trends and business growth line icons for. An detailed set of stock market financial trends and business growth line icons for data analysis and reporting
Free with trial Businessman in suit jumps between cliffs with red downward and green upward arrows, symbolizing market recovery and financial success. Decrease trade graph illustrations Businessman jumping from financial crisis to success with red downward and green upward arrows. Businessman in suit jumps between cliffs with red downward and. Businessman in suit jumps between cliffs with red downward and green upward arrows, symbolizing market recovery and financial success
Free with trial A shopping cart filled with financial symbols and graphs, representing economic growth and market trends. Decrease trade graph illustrations Illustration of shopping cart with financial symbols and graphs. A shopping cart filled with financial symbols and graphs, representing economic growth and. A shopping cart filled with financial symbols and graphs, representing economic growth and market trends
Free with trial A conceptual image featuring a miniature shopping trolley with a large red jagged arrow pointing downwards, symbolizing falling prices, economic recession, or retail discounts on a wooden surface. Decrease trade graph illustrations Red Downward Arrow in Shopping Cart Symbolizing Falling Prices. A conceptual image featuring a miniature shopping trolley with a large red jagged arrow pointing. A conceptual image featuring a miniature shopping trolley with a large red jagged arrow pointing downwards, symbolizing falling prices, economic recession, or retail discounts on a wooden surface
Free with trial SP 500 stock with red arrow point down. 3d rendering. Decrease trade graph illustrations SP 500 stock with red arrow point down. 3d rendering
Free with trial Colorful blocks in decreasing order on a blue surface. Represents decline or recession in a vibrant, illustrative manner. Stock photo. Decrease trade graph illustrations Colorful blocks in decreasing order on a blue surface. Represents decline or recession in a vibrant, illustrative manner. Stock photo
Free with trial Detailed illustration featuring a variety of hand drawn style financial charts and data analysis line icons including growth curves and market trends. Decrease trade graph vectors Collection of business data and financial analytics line icons. AI generated detailed illustration featuring a variety of hand drawn style financial charts and. detailed illustration featuring a variety of hand drawn style financial charts and data analysis line icons including growth curves and market trends
Free with trial A minimalist black icon depicting a stack of coins with a dollar sign and a downward arrow pointing towards it. Decrease trade graph vectors Black Icon Showing A Stack Of Coins With A Downward Arrow Symbol. A minimalist black icon depicting a stack of coins with a dollar sign and a downward arrow. A minimalist black icon depicting a stack of coins with a dollar sign and a downward arrow pointing towards it
Free with trial The image shows a golden dollar sign placed at the intersection of a downward red arrow and an upward green arrow, symbolizing economic decline and growth or contrasting financial performance. Decrease trade graph illustrations Financial trends depicted by contrasting arrows and dollar symbol. The image shows a golden dollar sign placed at the intersection of a downward red arrow and an. The image shows a golden dollar sign placed at the intersection of a downward red arrow and an upward green arrow, symbolizing economic decline and growth or contrasting financial performance
Free with trial An detailed set of professional financial line graphs and business reporting icons for data visualization and statistics. Decrease trade graph vectors Professional financial line graphs and business reporting icons. An ai generated detailed set of professional financial line graphs and business reporting icons. An detailed set of professional financial line graphs and business reporting icons for data visualization and statistics
Free with trial Person's hand points to stock market data displayed on laptop screen indicating analysis Use for finance or investment themes. Decrease trade graph illustrations Analyzing Stock Market Data on Laptop Screen with Hand Pointing. Person's hand points to stock market data displayed on laptop screen indicating analysis Use for. Person's hand points to stock market data displayed on laptop screen indicating analysis Use for finance or investment themes
Free with trial This AI-generated image shows a financial professional facing economic loss. Perfect for analysts needing to visualize market downturns, it highlights risk management in a modern corporate setting. Decrease trade graph illustrations Businessman holding a declining financial bar chart with a red arrow. This AI-generated image shows a financial professional facing economic loss. Perfect for. This AI-generated image shows a financial professional facing economic loss. Perfect for analysts needing to visualize market downturns, it highlights risk management in a modern corporate setting.
Free with trial Icons on a white background depict percentage symbols combined with arrows and bar graphs. The top row includes red, blue, and yellow arrows with percentage symbols. The middle row shows a multicolored bar graph, green percentage symbols, and a black percentage symbol with a black arrow. The bottom row contains a black bar graph, a downward arrow, and a large black percentage symbol. These elements visually represent data trends, growth, and decline. Decrease trade graph vectors Percentage Growth and Decline Arrow Icon Set Multi Color and Silhouette. Icons on a white background depict percentage symbols combined with arrows and bar. Icons on a white background depict percentage symbols combined with arrows and bar graphs. The top row includes red, blue, and yellow arrows with percentage symbols. The middle row shows a multicolored bar graph, green percentage symbols, and a black percentage symbol with a black arrow. The bottom row contains a black bar graph, a downward arrow, and a large black percentage symbol. These elements visually represent data trends, growth, and decline.
Free with trial A blue line drop-down with red bar chart on white background. Business concept. Decrease trade graph vectors A blue line drop-down with red bar chart on white background. Business concept. A blue line drop-down with red bar chart on a white background. Businese concept
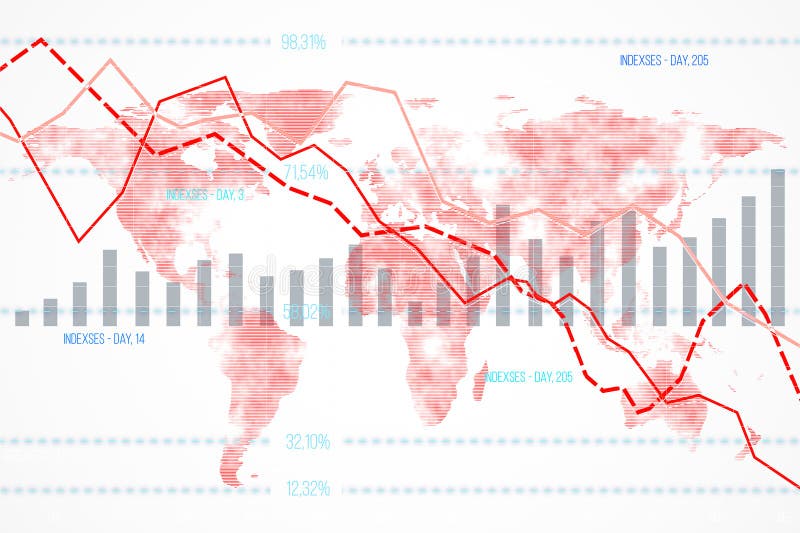
Free with trial Financial data chart featuring declining indexes and bar graphs overlaid on a world map background. Concept of global economic downturn. 3D Rendering. Decrease trade graph illustrations Financial data chart with declining indexes on a world map background. 3D Rendering. Financial data chart featuring declining indexes and bar graphs overlaid on. Financial data chart featuring declining indexes and bar graphs overlaid on a world map background. Concept of global economic downturn. 3D Rendering
Free with trial Broken coin showing a red arrow pointing down, representing economic decline and financial loss. Decrease trade graph illustrations Broken coin featuring red downturn arrow symbolizing financial crisis. Broken coin showing a red arrow pointing down, representing economic decline and financial. Broken coin showing a red arrow pointing down, representing economic decline and financial loss
Free with trial An image depicting a red arrow pointing downwards above a stack of gold coins that decreases in size, symbolizing financial decline or loss. Decrease trade graph illustrations A descending red arrow above a diminishing stack of gold coins. An image depicting a red arrow pointing downwards above a stack of gold coins that decreases in. An image depicting a red arrow pointing downwards above a stack of gold coins that decreases in size, symbolizing financial decline or loss
Free with trial Red arrow pointing down on a financial chart showing a sharp drop or decline in stock market trends and values. Decrease trade graph illustrations Red downward trending stock market arrow with sharp decline on chart. Red arrow pointing down on a financial chart showing a sharp drop or decline in stock. Red arrow pointing down on a financial chart showing a sharp drop or decline in stock market trends and values
Free with trial Downward arrows set. Financial decline percent. Economic crisis concept. Vector business analysis. EPS 10. Decrease trade graph vectors Downward arrows set. Financial decline percent. Economic crisis concept. Vector business analysis. EPS 10
Free with trial Low interest text with a downward arrow in a blurred office background. A 3D rendering of low interest text indicating a decline in finance. Decrease trade graph illustrations Low interest text with a downward arrow in a blurred office background. A 3D rendering of low interest text indicating a decline in finance
Free with trial Green stock chart growth and upward trend on a vibrant green background ,Generative ai. Decrease trade graph illustrations Green stock chart indicates upward growth trend in a bull market on green background. Green stock chart growth and upward trend on a vibrant green background. Green stock chart growth and upward trend on a vibrant green background ,Generative ai
Free with trial Car value drop line icon detailed image. Decrease trade graph vectors Automobile with downward financial trend arrow showing car depreciation. Car value drop line icon AI generated detailed image. Car value drop line icon detailed image
Free with trial Real-Time Market Data Analysis with Candlestick Chart vector icon or symbol. Decrease trade graph vectors Real-Time Market Data Analysis with Candlestick Chart vector icon or symbol. Real-Time Market Data Analysis with Candlestick Chart vector concept icon or symbol
Free with trial Set line Global economic crisis, and Calculation of expenses on seamless pattern. Vector. Decrease trade graph illustrations Set line Global economic crisis, and Calculation of expenses on seamless pattern. Vector.
 Sign in