Free with trial GHG, reducing greenhouse gas icon with a graph, eps 10 file, easy to edit. Decrease vector icon vectors GHG, reducing greenhouse gas icon with a graph
Free with trial This simple icon depicts a line graph with one line trending upwards and one trending downwards. Decrease vector icon vectors Line graph showing upward and downward trends icon. This simple icon depicts a line graph with one line trending upwards and one trending downwards
Free with trial Reducing waste line icon with a trash bin, eps 10 file, easy to edit. Decrease vector icon vectors Reducing waste line icon with a trash bin
Free with trial Cost reduction icon with dollar, linear design, eps 10 file, easy to edit. Decrease vector icon vectors Cost reduction icon with dollar, linear design
Free with trial Carbon management icon, co2 gas emission, linear design, eps 10 file, easy to edit. Decrease vector icon vectors Carbon management icon, co2 gas emission, linear
Free with trial Reducing waste icon with a chart, linear design, eps 10 file, easy to edit. Decrease vector icon vectors Reducing waste icon with a chart, linear design
Free with trial 3D Isometric Flat Vector Illustration of Cost Reduction , Business Finance Crisis. Decrease vector icon vectors 3D Isometric Flat Vector Illustration of Cost Reduction
Free with trial A minimalistic black-and-white vector graphic characterized by its straightforward lines and an eye-catching use of contrasting shades - Artificial intelligence crafted illustration. Decrease vector icon vectors Fall - high quality vector logo - vector illustration ideal for t-shirt graphic. A minimalistic black-and-white vector graphic characterized by its straightforward lines and an eye-catching use of contrasting shades - Artificial intelligence crafted illustration
Free with trial Scissors cutting, Certificate icons. Chef hat, Customer survey, Approved application line icons. Interest rate, gluten free. Linear set. Line icons set. Vector. Decrease vector icon illustrations Chef hat, Customer survey, Approved application line icons. Scissors cutting, Certificate. Linear set Vector. Scissors cutting, Certificate icons. Chef hat, Customer survey, Approved application line icons. Interest rate, gluten free. Linear set. Line icons set. Vector
Free with trial Investing and Trading vector concept seamless pattern in thin line style. Decrease vector icon vectors Investing and Trading vector seamless pattern in thin line style
Free with trial Dehydration icon with a human head, linear design, eps 10 file, easy to edit. Decrease vector icon vectors Dehydration icon with a human head, linear design
Free with trial Up and down arrow line icon set on black circle. Upward and downward concept. Decrease vector icon vectors Up and down arrow line icon set on black circle
Free with trial A minimalist black and white icon representing a financial growth chart. It features a series of vertical bars of varying heights, symbolizing data points or periods, overlaid with a line graph connecting circular nodes. This graphic effectively conveys concepts of financial analysis, business growth, performance tracking, and data visualization. Ideal for presentations, reports, websites, and applications related to finance, economics, and business intelligence. Decrease vector icon vectors Growth Analysis Finance Chart Icon. A minimalist black and white icon representing a financial growth chart. It features a series of vertical bars of varying. A minimalist black and white icon representing a financial growth chart. It features a series of vertical bars of varying heights, symbolizing data points or periods, overlaid with a line graph connecting circular nodes. This graphic effectively conveys concepts of financial analysis, business growth, performance tracking, and data visualization. Ideal for presentations, reports, websites, and applications related to finance, economics, and business intelligence.
Free with trial Forest carbon multi color concept icon. Emissions decrease, pollution. Air quality, ecology. Round shape line illustration. Abstract idea. Graphic design. Easy to use in brochure, booklet. Decrease vector icon vectors Forest carbon multi color concept icon
Free with trial A simple, flat design icon depicting a downward trend. The image features a red graph line descending from the top left to the bottom right, with an arrow indicating the direction. The graph is set against a clean white background, emphasizing the visual impact of the trend. This graphic is suitable for illustrating concepts such as financial decline, decreasing sales, or negative performance in business, economics, or data analysis. Decrease vector icon vectors Downward Trend Graph Icon. A simple, flat design icon depicting a downward trend. The image features a red graph line descending from the top left to the bottom right, with an arrow indicating the direction. The graph is set against a clean white background, emphasizing the visual impact of the trend. This graphic is suitable for illustrating concepts such as financial decline, decreasing sales, or negative performance in business, economics, or data analysis.
Free with trial Forest carbon blue gradient concept icon. Emissions decrease, pollution. Air quality, ecology. Round shape line illustration. Abstract idea. Graphic design. Easy to use in brochure, booklet. Decrease vector icon vectors Forest carbon blue gradient concept icon
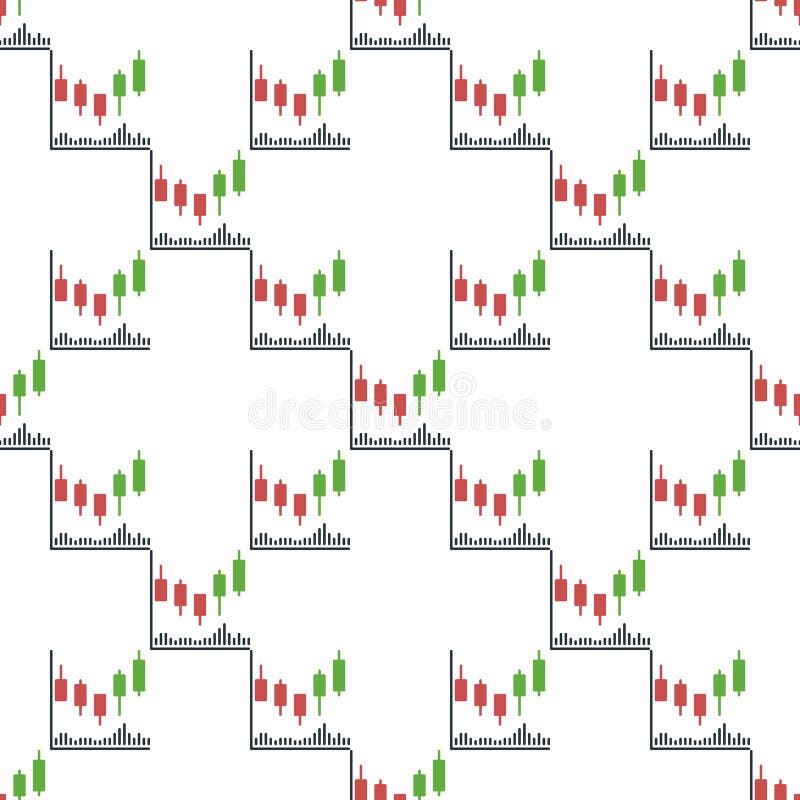
Free with trial Trend and Candlestick Chart vector Crypto Investment concept seamless pattern. Decrease vector icon vectors Trend and Candlestick Chart vector Crypto Investment seamless pattern
Free with trial Carbon emissions cost line icon with euro, eps 10 file, easy to edit. Decrease vector icon vectors Carbon emissions cost line icon with euro
Free with trial Minus, Subtract or Decrease simple icons set designed in filled, outline, line and stroke style. Decrease vector icon vectors Minus, Subtract or Decrease simple icons set designed in filled and stroke style. Minus, Subtract or Decrease simple icons set designed in filled, outline, line and stroke style
Free with trial Candlestick Chart Analysis vector Crypto Trading concept colored seamless pattern. Decrease vector icon vectors Candlestick Chart Analysis vector Crypto Trading colored seamless pattern
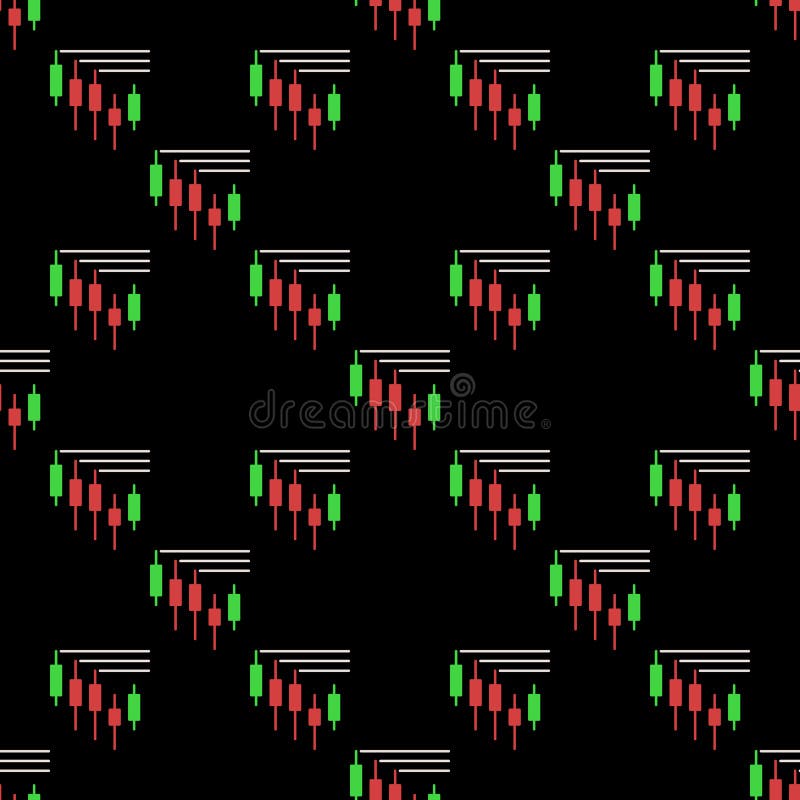
Free with trial Range or Levels Breakout vector Candlestick Chart concept colored seamless pattern. Decrease vector icon vectors Range or Levels Breakout vector Candlestick Chart colored seamless pattern
Free with trial A solid icon depicting a stack of coins with an arrow pointing downwards, presented isolated on a clean white background. Decrease vector icon vectors Money loss coins down solid icon. A solid icon depicting a stack of coins with an arrow pointing downwards, presented isolated on a clean white background
Free with trial A simple, hand-drawn icon representing the importance of reducing salt intake for a healthier lifestyle. Decrease vector icon vectors Reduce Salt Intake Health Icon. A simple, hand-drawn icon representing the importance of reducing salt intake for a healthier lifestyle
Free with trial Icon glyph colors ribbon discount ten percent, half price,seventy percent and ninety percent, label tag price off. Editable file. Decrease vector icon illustrations Icon glyph colors ribbon discount
Free with trial Text size icon Logo sign in thin line outline set and group collection. Decrease vector icon vectors Text size icon flat editable icon mark set. Text size icon Logo sign in thin line outline set and group collection
Free with trial Carbon emissions cost icon, co2 gas price in pounds, eps 10 file, easy to edit. Decrease vector icon vectors Carbon emissions cost icon, co2 price in pounds. carbon emissions cost icon, co2 gas price in pounds, eps 10 file, easy to edit
Free with trial Zoom out icon Black line art vector in black and white outline set collection sign. Decrease vector icon vectors Zoom out icon Thin line art collection. Zoom out icon Black line art vector in black and white outline set collection sign
Free with trial Real-Time Market Data Analysis with Candlestick Chart vector concept seamless pattern. Decrease vector icon vectors Real-Time Market Data Analysis with Candlestick Chart vector seamless pattern
Free with trial Music equalizer round sticker. Aspect of audio tuning, abstract techno circle icon for modern and retro technological design. Simple color vector pictogram isolated on white background. Decrease vector icon vectors Music Equalizer Round Sticker Audio Tuning. Music equalizer round sticker. Aspect of audio tuning, abstract techno circle icon for modern and retro technological design. Simple color vector pictogram isolated on white background
Free with trial Arrows on white background vector eps 10. Decrease vector icon vectors Arrows on white background vector
Free with trial A simple and clear line icon representing the action of turning the volume down. Decrease vector icon vectors Minimalist Volume Down Line Icon. A simple and clear line icon representing the action of turning the volume down
Free with trial Icon solid or glyph ribbon discount ten percent, half price,seventy percent and ninety percent, label tag price off. Editable file. Decrease vector icon illustrations Icon solid or glyph ribbon discount
Free with trial Money loss and economic crisis, money market crash and global financial downturn, vector line icons. Economic crisis icons of bankruptcy, price decrease with money inflation and unemployment growth. Decrease vector icon vectors Money loss and economic crisis, money market crash
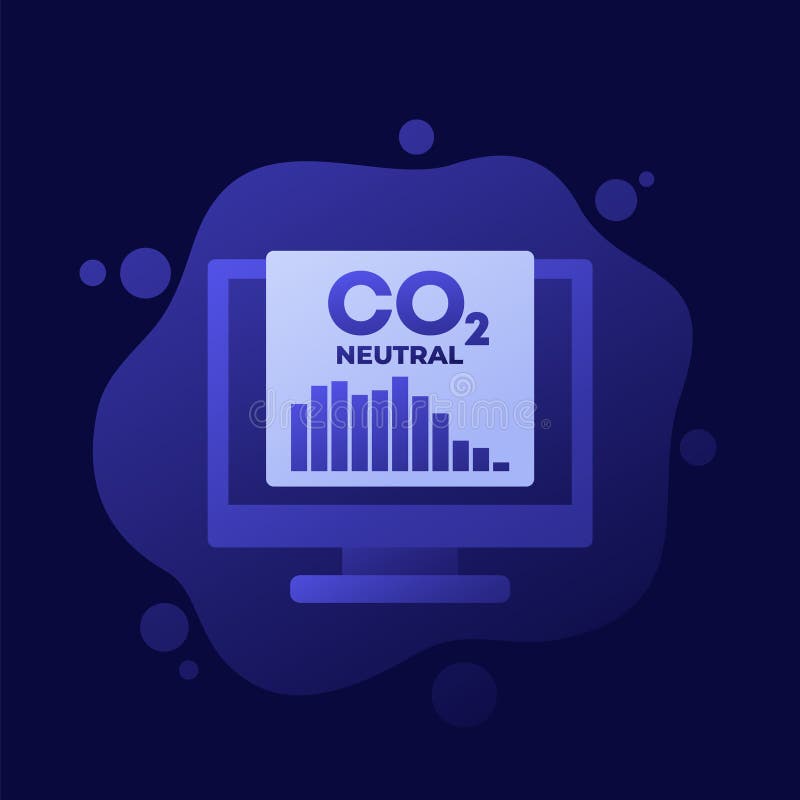
Free with trial Carbon neutral, co2 gas emissions reduction, vector design, eps 10 file, easy to edit. Decrease vector icon vectors Carbon neutral, co2 gas emissions reduction vector. carbon neutral, co2 gas emissions reduction, vector design, eps 10 file, easy to edit
Free with trial A versatile and modern icon representing the dynamic control of audio levels. Decrease vector icon vectors Dynamic Volume Control Sound Icon. A versatile and modern icon representing the dynamic control of audio levels
Free with trial A minimalist vector icon representing a downturn in the housing market. Decrease vector icon vectors Real Estate Price Reduction Symbol. A minimalist vector icon representing a downturn in the housing market
Free with trial A visual representation of a business downturn. This blue bar chart with a descending arrow illustrates a period of negative growth, financial loss, or economic recession. Decrease vector icon vectors Business Decline Graph Vector Icon. A visual representation of a business downturn. This blue bar chart with a descending arrow illustrates a period of negative growth, financial loss, or economic recession
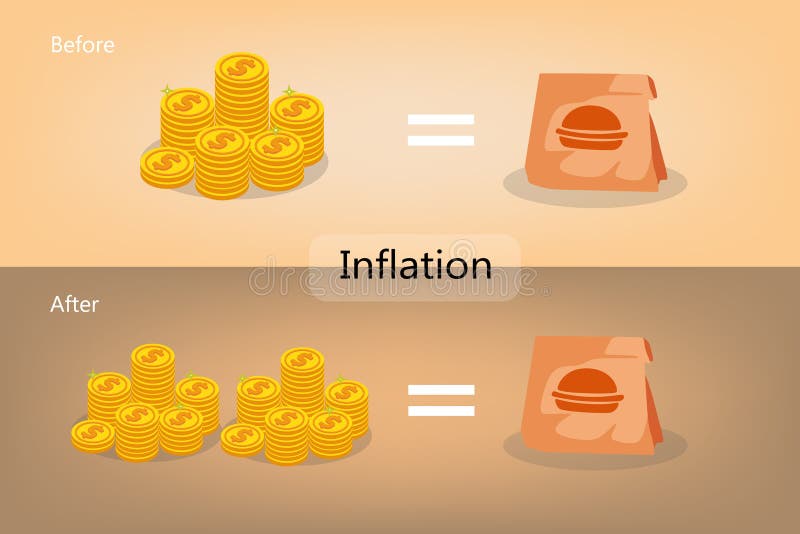
Free with trial Inflation situation is a decrease in the purchasing power of money. Decrease vector icon illustrations Inflation situation is a decrease in the purchasing power of money
Free with trial Icon flat line colors ribbon discount ten percent, half price,seventy percent and ninety percent, label tag price off. Editable file. Decrease vector icon illustrations Icon flat line colors ribbon discount
Free with trial Negative sign icon linear logo mark set collection in black and white for web. Decrease vector icon vectors Negative sign icon linear logo isolated. Negative sign icon linear logo mark set collection in black and white for web
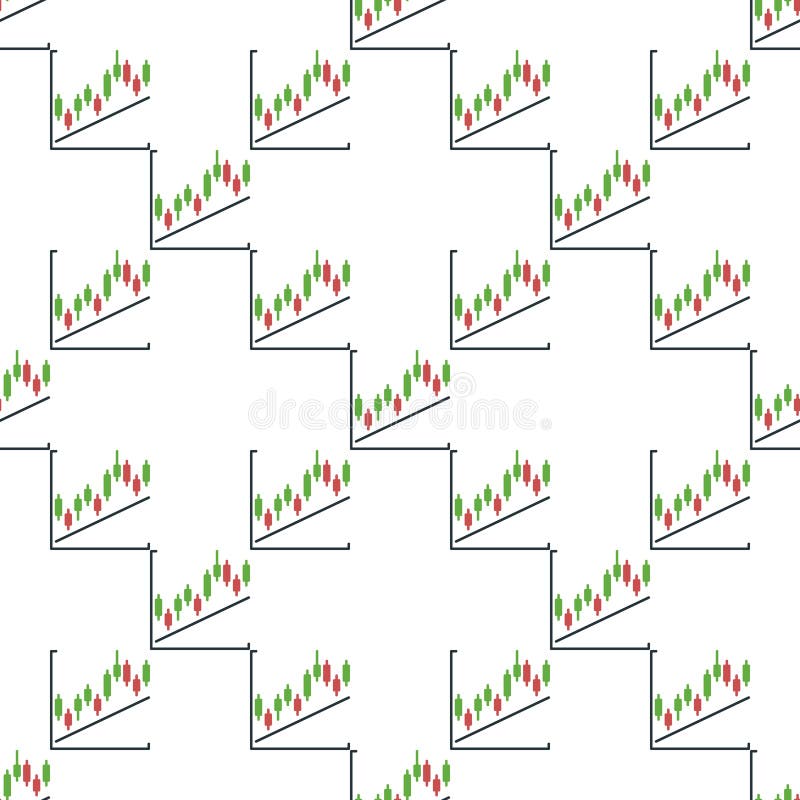
Free with trial Trend Line and Candlestick Chart vector Crypto Trading concept colored seamless pattern. Decrease vector icon vectors Trend Line and Candlestick Chart vector Crypto Trading colored seamless pattern
Free with trial Up and down arrow white linear icon for dark theme. Concepts of direction, choice and movement. Upward and backward pointer. Thin line illustration. Isolated symbol for night mode. Editable stroke. Decrease vector icon vectors Up and down arrow white linear icon for dark theme
Free with trial Icon line ribbon discount ten percent, half price,seventy percent and ninety percent, label tag price off. Editable file. Decrease vector icon illustrations Icon line ribbon discount
Free with trial Candlestick Chart on PC Screen vector Crypto Investment concept colored seamless pattern. Decrease vector icon vectors Candlestick Chart on PC Screen vector Crypto Investment colored seamless pattern
Free with trial Co2, carbon emission reducing line icon, eps 10 file, easy to edit. Decrease vector icon vectors Co2, carbon emission reducing line icon
Free with trial Up and down arrow vector eps 10. Decrease vector icon vectors Up and down arrow vector
Free with trial An abstract icon representing a dynamic process of elimination and simplification. Decrease vector icon vectors Abstract Process of Elimination Icon. An abstract icon representing a dynamic process of elimination and simplification
Free with trial Vector icon of a downward arrow or falling graph, symbolizing financial decline, loss trends, market crash, and negative economic performance. Ideal for finance apps, investment platforms, business reports, stock market analysis, and economic infographics. Clean, impactful, and scalable for both digital and print use. Decrease vector icon vectors Financial Decline Trend Loss Graph Icon. Vector icon of a downward arrow or falling graph, symbolizing financial decline, loss trends, market crash, and negative economic performance. Ideal for finance apps, investment platforms, business reports, stock market analysis, and economic infographics. Clean, impactful, and scalable for both digital and print use.
Free with trial Energy related vector linear icons set. Contains such icons as battery, electric car, globe, lightning, solar energy, energy, power and more. Isolated icon collection of energy on white background. Decrease vector icon illustrations Energy related vector linear icons set. Contains such battery, electric car, globe, lightning and more. Energy related vector linear icons set. Contains such icons as battery, electric car, globe, lightning, solar energy, energy, power and more. Isolated icon collection of energy on white background
Free with trial Up and down arrow icon set on square background. Upward and downward with long shadow. Decrease vector icon vectors Up and down arrow icon set on square background
Free with trial Shrink database icon Flat set in black and white color outline vector. Decrease vector icon vectors Shrink database icon Logo symbol outline set. Shrink database icon Flat set in black and white color outline vector
Free with trial Co2, carbon offset line icon, eps 10 file, easy to edit. Decrease vector icon vectors Co2, carbon offset line icon
Free with trial 29 points test score, twenty nine points exam results, vector illustration. Decrease vector icon vectors 29 points test score, twenty nine points exam results, vector illustration
Free with trial Up and down direction arrow icon illustration in black square. Decrease vector icon vectors Up and down direction arrow icon in black square. Up and down direction arrow icon illustration in black square
Free with trial A minimalist icon representing a professional or user providing critical feedback or a negative comment. Decrease vector icon vectors Icon of a Man Giving Negative Feedback. A minimalist icon representing a professional or user providing critical feedback or a negative comment
Free with trial A conceptual vector illustration representing the goal of reducing one's carbon footprint. Decrease vector icon vectors Reducing Carbon Footprint Concept Icon. A conceptual vector illustration representing the goal of reducing one's carbon footprint
Free with trial Crypto Trading Data Visualization vector Candlestick Chart concept colored seamless pattern. Decrease vector icon vectors Crypto Trading Data Visualization vector Candlestick Chart colored seamless pattern
Free with trial Plus Minus Add Subtract Round Circle Line Outline Button Math Zoom In Out Positive Negative Set Icon Sign Symbol Black White Illustration Graphic. Decrease vector icon vectors Plus Minus Add Subtract Round Circle Line Outline Button Math Zoom In Out Positive Negative Set Icon
Free with trial Uptrend and downtrend arrow icon set. Vectors. Decrease vector icon illustrations Uptrend and downtrend arrow icon set. Vectors
Free with trial A versatile set of business and finance icons isolated on a white background. This collection features various data visualization elements, including bar charts, line graphs, pie charts, and diagrams. The clean, vector style represents concepts like statistical analysis, market growth, financial reporting, and economic trends. These infographic elements are perfect for presentations, business reports, websites, and marketing materials to illustrate progress, performance, and data-driven insights. Decrease vector icon vectors Business and Finance Chart and Graph Icon Set. A versatile set of business and finance icons isolated on a white background. This collection features various data visualization elements, including bar charts, line graphs, pie charts, and diagrams. The clean, vector style represents concepts like statistical analysis, market growth, financial reporting, and economic trends. These infographic elements are perfect for presentations, business reports, websites, and marketing materials to illustrate progress, performance, and data-driven insights.
Free with trial Minus or negative sign vector illustration, cute mathematical symbol. Decrease vector icon vectors Minus or negative sign vector illustration, cute mathematical symbol
Free with trial Negative Less Minus Zoom Out Subtract Round Circle Circular Button Math Mathematics Minimize No Icon Sign Symbol Black White Illustration Graphic. Decrease vector icon vectors Negative Less Minus Zoom Out Subtract Round Circle Circular Button Math Mathematics Minimize No Icon
Free with trial Red Down arrow icon web design logo set collection in flat vector. Decrease vector icon vectors Red Down arrow icon Outline vector for web ui. red Down arrow icon web design logo set collection in flat vector
Free with trial Economic crisis line icons of global financial downturn and business bankruptcy, vector banner. Money loss and banking crisis icons of depreciation, unemployment and price decrease of pandemic crisis. Decrease vector icon vectors Economic crisis icons of global financial downturn. Economic crisis line icons of global financial downturn and business bankruptcy, vector banner. Money loss and banking crisis icons of depreciation, unemployment and price decrease of pandemic crisis
Free with trial A minimalist icon representing the sense of hearing. Decrease vector icon vectors Simple Icon for Hearing and Sound Volume. A minimalist icon representing the sense of hearing
Free with trial Candlestick Chart vector Professional Financial Trading concept seamless pattern. Decrease vector icon vectors Candlestick Chart vector Professional Financial Trading seamless pattern
Free with trial Minus Icon (2) Black line art vector in black and white outline set collection sign. Decrease vector icon vectors Minus Icon (2) Thin line art collection. Minus Icon (2) Black line art vector in black and white outline set collection sign
Free with trial Hand drawn down arrow featuring a squiggly line, pointing downwards in a simple and minimalistic vector illustration set against a clean white background. Decrease vector icon vectors Hand drawn down arrow featuring a squiggly line, pointing downwards in a simple and minimalistic vector illustration set
Free with trial 40 points test score, forty points mark, bad exam results illustration - Vector. Decrease vector icon vectors 40 points test score, forty points mark, bad exam results illustration - Vector
Free with trial Reduction chart icon web design logo set collection in flat vector. Decrease vector icon vectors Reduction chart icon Outline vector for web ui. Reduction chart icon web design logo set collection in flat vector
Free with trial Up and down direction arrow icon set on circle line. Upward and downward concept. Decrease vector icon vectors Up and down direction arrow icon set on circle line
Free with trial Statistic Up icon outline collection or set in black and white. Decrease vector icon vectors Statistic Up icon Line Art Logo set. Statistic Up icon outline collection or set in black and white
Free with trial Line icon illustration representing a global wheat crisis with a downward arrow symbolizing decreasing production. Decrease vector icon illustrations Global wheat crisis icon showing decreasing production. Line icon illustration representing a global wheat crisis with a downward arrow symbolizing decreasing production
Free with trial Minus icon set in thin line outline style and linear vector sign. Decrease vector icon vectors Minus icon Flat simple outline set. Minus icon set in thin line outline style and linear vector sign
Free with trial A stylized icon representing the action of removing an item from a digital shopping cart. The minus symbol clearly indicates subtraction or deletion, a crucial step in the online checkout process. Decrease vector icon vectors Remove from Cart Web Icon with Long Shadow. A stylized icon representing the action of removing an item from a digital shopping cart. The minus symbol clearly indicates subtraction or deletion, a crucial step in the online checkout process
Free with trial A vector illustration symbolizing a controlled descent or arrival. Decrease vector icon vectors Parachute Descent with Downward Arrow Icon. A vector illustration symbolizing a controlled descent or arrival
Free with trial Economic Loss icon outline collection or set in black and white. Decrease vector icon vectors Economic Loss icon Line Art Logo set. Economic Loss icon outline collection or set in black and white
Free with trial Online Candlestick Chart vector Professional Financial Trading concept colored seamless pattern. Decrease vector icon vectors Online Candlestick Chart vector Professional Financial Trading colored seamless pattern
Free with trial Candlestick Chart inside Magnifier vector Investing and Trading concept colored seamless pattern. Decrease vector icon vectors Candlestick Chart inside Magnifier vector Investing and Trading colored seamless pattern