Free with trial This impactful 3D illustration portrays the cost cutting concept using scissors strategically cutting a dollar bill, symbolizing financial savings and budget reduction. The image effectively visualizes the core of finance and budget management, representing the act of reducing expenses. Key elements like the money, the dollar, and the action of the cut are meticulously designed. The image is ideal. Decrease vector illustrations Cost cutting concept depicted with scissors cutting a dollar bill representing financial savings or budget reduction. This impactful 3D illustration portrays the cost cutting concept using scissors strategically cutting a dollar bill, symbolizing financial savings and budget reduction. The image effectively visualizes the core of finance and budget management, representing the act of reducing expenses. Key elements like the money, the dollar, and the action of the cut are meticulously designed. The image is ideal
Free with trial A magnifying glass focuses on a declining bar graph and an exclamation point, symbolizing a potential problem or risk. Decrease vector illustrations Declining Sales Alert Magnifying Glass on Downward Graph. A magnifying glass focuses on a declining bar graph and an exclamation point, symbolizing a potential problem or risk.
Free with trial A diverse set of icons representing financial growth, market trends, and business analytics, including line graphs, bar charts, pie charts, and currency symbols. Decrease vector vectors Collection of Financial and Business Growth Icons and Charts. A diverse set of icons representing financial growth, market trends, and business analytics, including line graphs, bar charts, pie charts, and currency symbols
Free with trial Set of black and white vector icons featuring downward trending bar graphs, magnifying glass analysis, and presentation charts illustrating data decline. Generative AI. Decrease vector vectors Black and white icons of declining bar graph data and analysis. Set of black and white vector icons featuring downward trending bar graphs, magnifying glass analysis, and presentation charts illustrating data decline. Generative AI
Free with trial A bold red downward arrow targeting a pyramid of shiny gold coins, symbolizing decline or financial loss. Decrease vector illustrations Red downward arrow pointing at stack of gold coins. A bold red downward arrow targeting a pyramid of shiny gold coins, symbolizing decline or financial loss
Free with trial This 3D illustration features a series of vertical bars arranged in a descending sequence, representing a decline in data. A smooth, continuous line graph follows the top of the bars, emphasizing the negative trajectory. The color palette uses shades of blue and light gray against a clean white background, creating a professional and minimalist aesthetic suitable for financial or analytical. Decrease vector vectors A three dimensional bar chart showing a downward trend with a line graph overlay. This 3D illustration features a series of vertical bars arranged in a descending sequence, representing a decline in data. A smooth, continuous line graph follows the top of the bars, emphasizing the negative trajectory. The color palette uses shades of blue and light gray against a clean white background, creating a professional and minimalist aesthetic suitable for financial or analytical
Free with trial A modern minimalist digital illustration depicts an oval-shaped light bulb with a curved top and pointed bottom containing a three-dimensional bar graph showing a clear downward trend with bars of varying heights representing different business metrics decreasing in value against a clean background symbolizing negative performance, decline, or economic downturn in corporate or financial contexts. Decrease vector illustrations Modern light bulb icon with declining bar graph inside representing business concept and negative trend. A modern minimalist digital illustration depicts an oval-shaped light bulb with a curved top and pointed bottom containing a three-dimensional bar graph showing a clear downward trend with bars of varying heights representing different business metrics decreasing in value against a clean background symbolizing negative performance, decline, or economic downturn in corporate or financial contexts
Free with trial This image showcases a variety of modern, flat-design charts and graphs commonly used in business, finance, and data analysis. It includes bar charts, pie charts, and line graphs, presented in a clean, minimalist style with teal and gray color accents. These visual representations are ideal for illustrating trends, statistics, performance, and financial data in presentations, reports, and web content. Decrease vector illustrations Collection of Business and Financial Charts and Graphs. This image showcases a variety of modern, flat-design charts and graphs commonly used in business, finance, and data analysis. It includes bar charts, pie charts, and line graphs, presented in a clean, minimalist style with teal and gray color accents. These visual representations are ideal for illustrating trends, statistics, performance, and financial data in presentations, reports, and web content.
Free with trial A clean, minimalist 3D rendering of a descending bar graph composed of sleek, white rectangular prisms. The graph is set against a bright, neutral background, creating a modern and versatile image ideal for presentations, reports, or website design related to business, finance, or data visualization. The image offers a clean, uncluttered aesthetic. Decrease vector illustrations Abstract White Bar Graph: Minimalist 3D Render. A clean, minimalist 3D rendering of a descending bar graph composed of sleek, white rectangular prisms. The graph is set against a bright, neutral background, creating a modern and versatile image ideal for presentations, reports, or website design related to business, finance, or data visualization. The image offers a clean, uncluttered aesthetic.
Free with trial Elderly woman suffers from dementia and memory loss and is in need of specialized caregivers. Sad female pensioner is sick with dementia due to advancing age or lot of psychological stress in youth. Decrease vector vectors Elderly woman suffers from dementia and memory loss and is in need of specialized caregivers
Free with trial Businesswoman reduces cost to get more income and invest in profitable areas, cuts sheet of paper with scissors. Concept of skills to reduce cost in business, to avoid bankruptcy and cheaper goods. Decrease vector vectors Businesswoman reduces cost to get more income and invest, cuts paper with scissors. Businesswoman reduces cost to get more income and invest in profitable areas, cuts sheet of paper with scissors. Concept of skills to reduce cost in business, to avoid bankruptcy and cheaper goods
Free with trial Three stacks of gold coins reducing in size next to a downward red arrow indicating decline. Decrease vector illustrations Decreasing stacks of gold coins with downward arrow. Three stacks of gold coins reducing in size next to a downward red arrow indicating decline
Free with trial A dynamic collection of eight distinct dollar sign symbols, each uniquely rendered in a bold, grunge, and street art style. Featuring dripping ink effects, distressed textures, and halftone patterns, these black and white icons are integrated with various arrows depicting financial trends. The arrows illustrate upward growth, downward decline, and fluctuating market movements, conveying concepts of profit, loss, and economic change. This versatile set is perfect for modern designs related to finance, investment, business, and urban culture, suitable for web, print, and creative projects. Decrease vector vectors Grunge Dollar Signs with Financial Trend Arrows Set. A dynamic collection of eight distinct dollar sign symbols, each uniquely rendered in a bold, grunge, and street art style. Featuring dripping ink effects, distressed textures, and halftone patterns, these black and white icons are integrated with various arrows depicting financial trends. The arrows illustrate upward growth, downward decline, and fluctuating market movements, conveying concepts of profit, loss, and economic change. This versatile set is perfect for modern designs related to finance, investment, business, and urban culture, suitable for web, print, and creative projects.
Free with trial Bar graph growth and decline icon in flat style. Up and down arrow chart symbol. Infographic elements illustration. Decrease vector vectors Bar graph growth and decline icon in flat style. Up and down arrow chart symbol. Infographic elements
Free with trial Bar chart is showing growth and decline with blue and purple bars. Decrease vector vectors Blue and purple bar chart showing growth and decline. Bar chart is showing growth and decline with blue and purple bars
Free with trial Cartoon illustration of frustrated businessman in front of the computer. Decrease vector vectors Frustrated businessman in front of the computer
Free with trial A comprehensive set of black silhouette icons representing various aspects of auctions, e-commerce, and financial transactions. This collection includes symbols like gavels, money, shopping carts, sold signs, and security shields, making it ideal for websites, apps, or presentations related to online marketplaces, retail, finance, and legal services. Decrease vector vectors Auction and E-commerce Business Icons for Buying and Selling. A comprehensive set of black silhouette icons representing various aspects of auctions, e-commerce, and financial transactions. This collection includes symbols like gavels, money, shopping carts, sold signs, and security shields, making it ideal for websites, apps, or presentations related to online marketplaces, retail, finance, and legal services.
Free with trial A red hand holding green dollar bills with a black coin, next to a red medical plus symbol and downward arrow. Decrease vector illustrations Hand holding money with medical plus down arrow icon. A red hand holding green dollar bills with a black coin, next to a red medical plus symbol and downward arrow
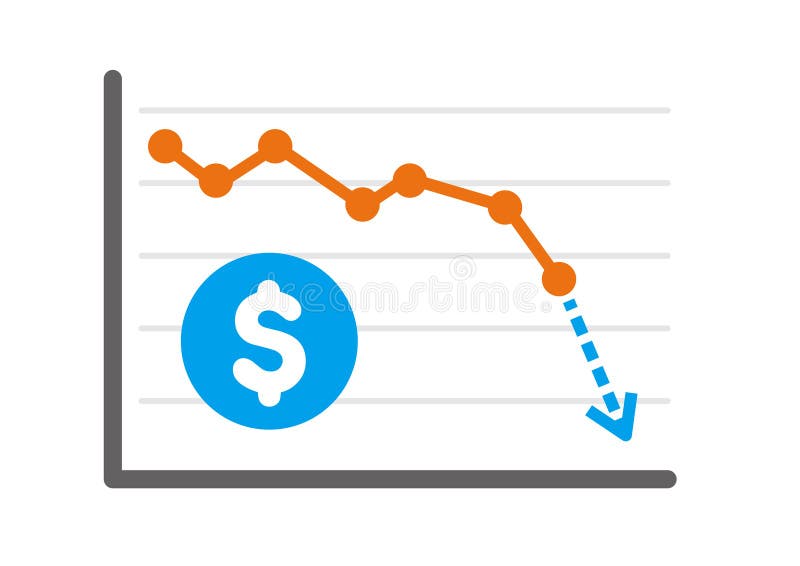
Free with trial US Dollar Exchange Chart Illustration Falling. Decrease vector illustrations US Dollar Exchange Chart Illustration Falling
Free with trial 3D illustration showing Bitcoin symbol with green upward and red downward arrows indicating price trends and market movement. Decrease vector illustrations Bitcoin price rising and falling with up and down arrows. 3D illustration showing Bitcoin symbol with green upward and red downward arrows indicating price trends and market movement
Free with trial This minimalist graphic illustration features a vertical bar chart with a prominent red arrow indicating a declining trend. The bars are rendered in varying shades of gray, arranged in descending order of height. A small blue globe icon is positioned near the arrow, symbolizing international or worldwide context. The overall design is clean, professional and suitable for business or financial. Decrease vector vectors A simple bar chart showing a downward trend with a global icon on a white background. This minimalist graphic illustration features a vertical bar chart with a prominent red arrow indicating a declining trend. The bars are rendered in varying shades of gray, arranged in descending order of height. A small blue globe icon is positioned near the arrow, symbolizing international or worldwide context. The overall design is clean, professional and suitable for business or financial
Free with trial This minimalist graphic illustration features a bold red line chart trending downwards against a clean background. Several small downward-pointing arrows are positioned along the slope to emphasize the decline. The composition uses a flat design aesthetic with high contrast, conveying a clear message of loss, reduction, or negative performance in a professional context. Decrease vector vectors A red line graph showing a sharp downward trend with multiple directional arrows. This minimalist graphic illustration features a bold red line chart trending downwards against a clean background. Several small downward-pointing arrows are positioned along the slope to emphasize the decline. The composition uses a flat design aesthetic with high contrast, conveying a clear message of loss, reduction, or negative performance in a professional context
Free with trial 3D rendered pyramid chart with a pie chart overlay and data icons on a light background. Useful for infographics and business presentations. Decrease vector illustrations 3d pyramid infographic with pie chart and data icons. 3D rendered pyramid chart with a pie chart overlay and data icons on a light background. Useful for infographics and business presentations
Free with trial Simple black arrow pointing downward with a subtle shadow. Minimalist design on plain white surface. Decrease vector vectors Downward black arrow on white background with shadow. Simple black arrow pointing downward with a subtle shadow. Minimalist design on plain white surface
Free with trial A minimalist line icon depicting strategic analysis. Decrease vector illustrations Strategic Analysis Knight, Graph, Magnifying Glass Icon. A minimalist line icon depicting strategic analysis.
Free with trial Black magnifying glass icon with a minus sign inside. The design, simple and bold, is set against a white background, representing a zoom-out or decrease function in user interfaces or applications. The handle is angled downward to the right, typical for magnifying glass icons. Decrease vector vectors Black magnifying glass icon with a minus sign inside.
Free with trial 3D yellow arrow pointing downward featuring a percent symbol in white on a plain background. Decrease vector illustrations Yellow percentage down arrow icon with percent symbol. 3D yellow arrow pointing downward featuring a percent symbol in white on a plain background
Free with trial A bar graph illustrating a decline in values with an orange downward arrow indicating loss. Decrease vector illustrations Graph showing decline and loss with orange bars and arrow. A bar graph illustrating a decline in values with an orange downward arrow indicating loss
Free with trial A simple graphic representing a downward trend in business or finance. Shows a bar chart with decreasing heights and a clear arrow indicating a fall. Perfect for representing loss or decline. Decrease vector vectors Down trend bar chart arrow icon business finance drop. A simple graphic representing a downward trend in business or finance. Shows a bar chart with decreasing heights and a clear arrow indicating a fall. Perfect for representing loss or decline.
Free with trial A minimalist black outline arrow pointing directly downwards, set against a clean white background. This simple graphic element is ideal for indicating direction, flow, download, reduction, or a downward trend. Its clean design makes it versatile for various digital and print applications, including user interfaces, presentations, infographics, and instructional materials. The clear, uncluttered composition ensures easy integration into any project. Generated by AI. Decrease vector illustrations Vertical Downward Arrow Line Icon on White Background. A minimalist black outline arrow pointing directly downwards, set against a clean white background. This simple graphic element is ideal for indicating direction, flow, download, reduction, or a downward trend. Its clean design makes it versatile for various digital and print applications, including user interfaces, presentations, infographics, and instructional materials. The clear, uncluttered composition ensures easy integration into any project. Generated by AI
Free with trial A flat style pie chart displays market shares in teal, green, and yellow, with a dollar coin icon representing financial data. Decrease vector vectors Flat design pie chart illustration representing business finance and market share analysis. A flat style pie chart displays market shares in teal, green, and yellow, with a dollar coin icon representing financial data.
Free with trial Inequality icon linear logo mark set collection in black and white. Decrease vector vectors Inequality icon linear logo isolated. Inequality icon linear logo mark set collection in black and white
Free with trial A stylized image depicts a magnifying glass focusing on a declining bar graph being passed from one hand to another. Decrease vector illustrations Declining Market Analysis Magnifying Glass, Graph, Hands. A stylized image depicts a magnifying glass focusing on a declining bar graph being passed from one hand to another.
Free with trial This graphic illustration features a bold green downward-pointing arrow set against a clean background. Beside the arrow, a circular gold coin icon symbolizes financial value and currency. The design conveys a clear message of savings, discounts and economic reduction in a minimalist, modern style. Decrease vector vectors A green downward arrow icon representing a thirty percent price reduction concept. This graphic illustration features a bold green downward-pointing arrow set against a clean background. Beside the arrow, a circular gold coin icon symbolizes financial value and currency. The design conveys a clear message of savings, discounts and economic reduction in a minimalist, modern style
Free with trial A colorful, hand-drawn illustration depicting a large percentage symbol surrounded by various financial and statistical icons. This doodle-style artwork includes bar graphs, pie charts, stacks of coins, dollar signs, and arrows indicating growth and decline. The sketch effectively visualizes concepts like interest rates, economic trends, business analytics, investment returns, and market data. Isolated on a white background, this versatile image is perfect for presentations, infographics, financial reports, and educational materials related to business, finance, and statistics. Decrease vector illustrations Hand Drawn Finance and Percentage Concept Illustration. A colorful, hand-drawn illustration depicting a large percentage symbol surrounded by various financial and statistical icons. This doodle-style artwork includes bar graphs, pie charts, stacks of coins, dollar signs, and arrows indicating growth and decline. The sketch effectively visualizes concepts like interest rates, economic trends, business analytics, investment returns, and market data. Isolated on a white background, this versatile image is perfect for presentations, infographics, financial reports, and educational materials related to business, finance, and statistics.
Free with trial Zoom Out Magnifying Glass Icon with Minus Sign and Handle. Decrease vector vectors Zoom Out Magnifying Glass Icon with Minus Sign and Handle
Free with trial A vivid red zig-zag arrow illustrates a downward trend, symbolizing financial decline, market volatility, or negative progress. This versatile graphic is perfect for business and finance presentations. Decrease vector vectors Red zig zag arrow isolated on transparent background transparent background. A vivid red zig-zag arrow illustrates a downward trend, symbolizing financial decline, market volatility, or negative progress. This versatile graphic is perfect for business and finance presentations
Free with trial The image depicts a three-dimensional, glossy red arrow pointing downward against a neutral, light gray background. The arrow appears to have a sleek, modern design with a slight gradient effect, giving it a polished and reflective surface. It is centered and stands out prominently due to its vibrant color and sharp geometric shape. Decrease vector illustrations A bold red downward-pointing arrow on a plain background. The image depicts a three-dimensional, glossy red arrow pointing downward against a neutral, light gray background. The arrow appears to have a sleek, modern design with a slight gradient effect, giving it a polished and reflective surface. It is centered and stands out prominently due to its vibrant color and sharp geometric shape
Free with trial This vibrant illustration depicts the shift from fossil fuels to renewable energy sources, showcasing a decrease in emissions. The image features a contrast between polluting elements like oil barrels and a gas pump on the left, and clean energy symbols like wind turbines, solar panels, and a growing tree on the right. A downward trending arrow emphasizes the reduction in emissions, symbolizing a greener future. Decrease vector vectors Transitioning to Renewable Energy: Decreasing Emissions. This vibrant illustration depicts the shift from fossil fuels to renewable energy sources, showcasing a decrease in emissions. The image features a contrast between polluting elements like oil barrels and a gas pump on the left, and clean energy symbols like wind turbines, solar panels, and a growing tree on the right. A downward trending arrow emphasizes the reduction in emissions, symbolizing a greener future.
Free with trial Simple line art business icons set featuring a magnifying glass, minus symbol, pie chart, and rising bar graph for financial data analysis. Decrease vector illustrations Simple line art business icons set featuring a magnifying glass, minus symbol, pie chart, and rising bar graph for
Free with trial A simple red zigzag line with an arrow at the end, pointing downwards, set against a white background. Decrease vector illustrations Illustration of a red zigzag arrow pointing downwards. A simple red zigzag line with an arrow at the end, pointing downwards, set against a white background
Free with trial A bold green arrow symbol pointing downwards, presented as an isolated object on a white background for easy integration into designs. Decrease vector illustrations Green arrow pointing down isolated on white background. A bold green arrow symbol pointing downwards, presented as an isolated object on a white background for easy integration into designs
Free with trial A simple red zigzag line with an arrow at the end, pointing downwards, set against a white background. Decrease vector illustrations Illustration of a red zigzag arrow pointing downwards. A simple red zigzag line with an arrow at the end, pointing downwards, set against a white background
Free with trial Conceptual image depicting the decline of the music industry. Decrease vector illustrations Music Industry Decline Magnifying Glass, Graph, Note Icon. Conceptual image depicting the decline of the music industry.
Free with trial A set of three blue house icons stacked in ascending order, each featuring a dollar sign. A blue prohibition symbol floats above the tallest house. Decrease vector illustrations Blue house icons with dollar signs and no symbol on top. A set of three blue house icons stacked in ascending order, each featuring a dollar sign. A blue prohibition symbol floats above the tallest house
Free with trial The image features a simple yet striking graphic of a red arrow pointing downwards. The arrow has a curved top edge, giving it a dynamic feel, and the arrowhead is sharp and pointed. The design is clean and minimalistic, focusing solely on the arrow without any additional elements or background details. Decrease vector vectors A bold red downward pointing arrow with a curved top edge. The image features a simple yet striking graphic of a red arrow pointing downwards. The arrow has a curved top edge, giving it a dynamic feel, and the arrowhead is sharp and pointed. The design is clean and minimalistic, focusing solely on the arrow without any additional elements or background details
Free with trial Four icons depict bar charts with line graphs and arrows. Each icon features three bars in different colors�blue, red, green, and yellow. Arrows indicate upward and downward trends. Two icons use color while the other two are in black and white. These symbols represent financial or data analysis concepts, illustrating fluctuations or comparisons within datasets through simple, clear visual representations. Decrease vector vectors Four Profit Growth and Decline Icons Line and Silhouette Set. Four icons depict bar charts with line graphs and arrows. Each icon features three bars in different colors�blue, red, green, and yellow. Arrows indicate upward and downward trends. Two icons use color while the other two are in black and white. These symbols represent financial or data analysis concepts, illustrating fluctuations or comparisons within datasets through simple, clear visual representations.
Free with trial A bold, sketchy arrow rendered in black and white, indicating a downward direction with dynamic lines and shading. Decrease vector illustrations Hand-drawn arrow pointing downwards and to the left with a sketchy, energetic style. A bold, sketchy arrow rendered in black and white, indicating a downward direction with dynamic lines and shading
Free with trial Modern, minimalistic chart icon for business and finance. Decrease vector vectors Modern, minimalistic chart icon for business and finance
Free with trial A graph with two lines, one red and one blue. The red line is higher than the blue line, indicating a positive trend. Decrease vector vectors A graph with a red line and a blue line. A graph with two lines, one red and one blue. The red line is higher than the blue line, indicating a positive trend
Free with trial A striking black and white silhouette of a gerbera daisy flower. The intricate petals are rendered in bold black shapes with white outlines, creating a stylized and graphic representation of the bloom. The flower's center spirals inwards, showcasing a detailed pattern of layered petals that gradually decrease in size. A slender stem extends from the bottom right, anchoring the vibrant floral. Decrease vector vectors Stylized Black and White Gerbera Daisy Flower Silhouette. A striking black and white silhouette of a gerbera daisy flower. The intricate petals are rendered in bold black shapes with white outlines, creating a stylized and graphic representation of the bloom. The flower's center spirals inwards, showcasing a detailed pattern of layered petals that gradually decrease in size. A slender stem extends from the bottom right, anchoring the vibrant floral
Free with trial Format icon vector logo set collection for web app ui. Decrease vector vectors Format icon Thin line illustration set. Format icon vector logo set collection for web app ui
Free with trial Conceptual image depicting declining sales and the need for analysis. Decrease vector illustrations Declining Sales Analysis Magnifying Glass, Chart, Calendar. Conceptual image depicting declining sales and the need for analysis.
Free with trial Black earth ground symbol on a light gray background consists of a vertical line intersecting three parallel horizontal lines that decrease in length. Decrease vector vectors Protective earth ground symbol represents grounding in electrical systems. Black earth ground symbol on a light gray background consists of a vertical line intersecting three parallel horizontal lines that decrease in length.
Free with trial Chart icon and graph for statistic line or bar diagram with growth pie and graphic data. Use for analysis trend and pictogram by profit algorithm report. Business infographic title. Vector. Decrease vector vectors Chart icon and graph for statistic line or bar diagram with growth pie and graphic data. Use for analysis trend and
Free with trial Two black arrows pointing inwards towards a stack of horizontal bars on white. Clear details and vibrant color. Decrease vector illustrations Arrows Compressing a Stack of Bars Icon squeeze pressure. Two black arrows pointing inwards towards a stack of horizontal bars on white. Clear details and vibrant color
Free with trial A futuristic illustration of a hand manipulating glowing financial icons, including upward trend, percentage, dollar sign, and charts in a dark digital space. Decrease vector illustrations Digital finance hand controlling growth and profit icons. A futuristic illustration of a hand manipulating glowing financial icons, including upward trend, percentage, dollar sign, and charts in a dark digital space
Free with trial A comprehensive set of black grunge-textured icons representing the US Dollar (USD) and its market dynamics. The collection features various symbols indicating upward trends, downward trends, stability, and currency exchange or circulation, often incorporating arrows and graph-like elements. Ideal for financial reports, economic analyses, investment platforms, business presentations, and any design requiring visual representation of money flow, market performance, or currency value changes in a distinct, distressed style. Decrease vector vectors Grunge USD Dollar Market Movement and Exchange Icons Set. A comprehensive set of black grunge-textured icons representing the US Dollar (USD) and its market dynamics. The collection features various symbols indicating upward trends, downward trends, stability, and currency exchange or circulation, often incorporating arrows and graph-like elements. Ideal for financial reports, economic analyses, investment platforms, business presentations, and any design requiring visual representation of money flow, market performance, or currency value changes in a distinct, distressed style.
Free with trial A vibrant 3D arrow with a smooth gradient of pink, yellow, and blue, pointing diagonally downwards on a white background. Decrease vector illustrations Colorful 3d arrow pointing downward with gradient colors. A vibrant 3D arrow with a smooth gradient of pink, yellow, and blue, pointing diagonally downwards on a white background
Free with trial A stark black silhouette of a dense evergreen forest, featuring numerous pine trees of varying heights, creates a striking visual against a clean white background. The central trees are taller, forming a peak in the landscape, while the trees on either side gradually decrease in height, creating a symmetrical, hilly effect. This graphic image is ideal for design elements, backgrounds, or conceptual representations of nature, wilderness, or environmental themes. Generated by AI. Decrease vector vectors Black Silhouette of Evergreen Forest on White Background. A stark black silhouette of a dense evergreen forest, featuring numerous pine trees of varying heights, creates a striking visual against a clean white background. The central trees are taller, forming a peak in the landscape, while the trees on either side gradually decrease in height, creating a symmetrical, hilly effect. This graphic image is ideal for design elements, backgrounds, or conceptual representations of nature, wilderness, or environmental themes. Generated by AI
Free with trial Flat style illustration of going up red arrow icon isolated with background. Decrease vector illustrations Arrow indicated the direction symbol. Red arrow left icon symbol. Flat style illustration of going up red arrow icon isolated with background.
Free with trial Japanese Yen Exchange Chart Illustration Falling. Decrease vector illustrations Japanese Yen Exchange Chart Illustration Falling
Free with trial A line drawing of a magnifying glass focusing on a podcast microphone icon and a declining bar graph with a downward. Decrease vector illustrations Podcast Analytics Decline Magnifying Glass, Downward Trend. A line drawing of a magnifying glass focusing on a podcast microphone icon and a declining bar graph with a downward.
Free with trial A repeating pattern of red down arrows in an isometric view. This image represents concepts such as business decline, negative trends, or decreasing statistics. Suitable for illustrating financial reports, market analysis, or economic downturns. Decrease vector illustrations Red Down Arrows Pattern, Isometric View, Business Decline. A repeating pattern of red down arrows in an isometric view. This image represents concepts such as business decline, negative trends, or decreasing statistics. Suitable for illustrating financial reports, market analysis, or economic downturns
Free with trial Illustration of an angry boy holding a graph showing declining performance, representing business failure and loss. The image conveys frustration and disappointment with negative financial results and market downturns. Decrease vector vectors Angry Boy with Falling Graph Business Failure, Loss Concept. Illustration of an angry boy holding a graph showing declining performance, representing business failure and loss. The image conveys frustration and disappointment with negative financial results and market downturns.
Free with trial Steeply falling graph dark background dramatic drop illustration trend drop Vector illustration for high-quality printing. Decrease vector illustrations Steeply falling graph, dark background, dramatic drop, illustration, trend, drop. Steeply falling graph dark background dramatic drop illustration trend drop Vector illustration for high-quality printing
Free with trial Black Friday Special Offer Banner Design Template. 50 OFF Sale. Discount Price. Special Offer Marketing Ad. Discount Promotion and Sale Discount Offer. Glass morphism style design. Vector illustration. Decrease vector vectors Black Friday Special Offer Banner Glass morphism. Black Friday Special Offer Banner Design Template. 50 OFF Sale. Discount Price. Special Offer Marketing Ad. Discount Promotion and Sale Discount Offer. Glass morphism style design. Vector illustration
Free with trial Simple orange arrow pointing downwards with a subtle shadow. Decrease vector vectors Simple orange arrow pointing downwards with a subtle shadow
Free with trial A minimalist black bar chart icon isolated on a clean white background. This simple graphic features three vertical bars of different heights resting on a horizontal axis, visually representing data, statistics, and comparative information. Ideal for illustrating business performance, financial reports, market trends, analytics, or any concept related to growth, decline, and quantitative analysis in presentations, websites, applications, and infographics. Its clean, flat design makes it versatile for various digital and print media. Decrease vector vectors Minimalist Bar Chart Icon for Data Analysis and Statistics. A minimalist black bar chart icon isolated on a clean white background. This simple graphic features. A minimalist black bar chart icon isolated on a clean white background. This simple graphic features three vertical bars of different heights resting on a horizontal axis, visually representing data, statistics, and comparative information. Ideal for illustrating business performance, financial reports, market trends, analytics, or any concept related to growth, decline, and quantitative analysis in presentations, websites, applications, and infographics. Its clean, flat design makes it versatile for various digital and print media.
Free with trial A minimalist line drawing depicts a person walking with a declining sales graph under a magnifying glass. Decrease vector illustrations Declining Sales Analysis Magnifying Glass on Falling Graph. A minimalist line drawing depicts a person walking with a declining sales graph under a magnifying glass.
Free with trial A graphic illustration of a declining graph chart with prominent red arrows, symbolizing financial downturn, loss, or negative trends. Suitable for illustrating economic reports, business analysis, or market performance. Decrease vector illustrations Declining Graph Chart with Red Arrows, Financial Downturn. A graphic illustration of a declining graph chart with prominent red arrows, symbolizing financial downturn, loss, or negative trends. Suitable for illustrating economic reports, business analysis, or market performance
Free with trial Three-tiered black podium set against a dark background. Circular platforms decrease in size as they ascend. Spotlight from above casts a blue hue, accentuating the sleek, glossy surfaces. Red ambient lighting at the base adds contrast, creating a dramatic atmosphere ideal for product display or presentations. Decrease vector illustrations Elegant 3D Podium for Product Presentation with Spotlight. Three-tiered black podium set against a dark background. Circular platforms decrease in size as they ascend. Spotlight from above casts a blue hue, accentuating the sleek, glossy surfaces. Red ambient lighting at the base adds contrast, creating a dramatic atmosphere ideal for product display or presentations.
Free with trial Financial chart arrow up and down icon isolated on white background. Growth and decline graph sign symbol illustration. Decrease vector vectors Financial chart arrow up and down icon isolated on white background. Growth and decline graph sign symbol
Free with trial Statistical bar chart icon with upward and downward curved arrows. Business trend performance symbol illustration. Decrease vector vectors Statistical bar chart icon with upward and downward curved arrows. Business trend performance symbol
Free with trial Simple black graphic with arrows pointing up and down, and a solid vertical line. Clean and clear symbols representing direction and order. Great for presentations and design. Decrease vector vectors Up down arrows and vertical line icon simple black symbols. Simple black graphic with arrows pointing up and down, and a solid vertical line. Clean and clear symbols representing direction and order. Great for presentations and design.
Free with trial This image features a stylized, downward-pointing arrow with a vibrant green gradient. The arrow has a modern, sleek design with a pointed tip and smooth curves, giving it a dynamic and energetic appearance. The gradient transitions from a darker green at the base to a brighter green near the tip, creating a visually appealing effect. Decrease vector vectors A green downward-pointing arrow with a sleek, gradient design. This image features a stylized, downward-pointing arrow with a vibrant green gradient. The arrow has a modern, sleek design with a pointed tip and smooth curves, giving it a dynamic and energetic appearance. The gradient transitions from a darker green at the base to a brighter green near the tip, creating a visually appealing effect
Free with trial A comprehensive set of financial and data visualization icons, perfect for illustrating business and economic concepts. This collection includes a growing bar chart with an upward trend, a declining bar chart with a downward trend, and a mixed bar chart. Also featured are stacks of global currencies (USD, Euro, INR), a segmented pie chart, and a world map colored green and red to signify global market conditions or data distribution. Ideal for presentations, reports, websites, and educational materials related to economics, finance, and market analysis. Decrease vector vectors Global Financial and Business Data Visualization Icons Set. A comprehensive set of financial and data visualization icons, perfect for illustrating business and economic concepts. This collection includes a growing bar chart with an upward trend, a declining bar chart with a downward trend, and a mixed bar chart. Also featured are stacks of global currencies (USD, Euro, INR), a segmented pie chart, and a world map colored green and red to signify global market conditions or data distribution. Ideal for presentations, reports, websites, and educational materials related to economics, finance, and market analysis.
Free with trial Collection of red percentage signs with up and down arrows. Represents financial growth, decline, discounts, and sales. Decrease vector vectors Percentage icon set, finance up and down arrows red symbols. Collection of red percentage signs with up and down arrows. Represents financial growth, decline, discounts, and sales
Free with trial Blue magnifying glass icon with minus symbol indicating zoom out functionality on a black background. Decrease vector vectors Zoom Out Magnifying Glass Icon in Blue on Black Background. Blue magnifying glass icon with minus symbol indicating zoom out functionality on a black background.
Free with trial A dynamic collection of hand-drawn financial and trend-related symbols rendered in a grunge, brush-stroke style. This illustration features various dollar signs, upward and downward arrows, a zig-zag chart line, checkmarks, and crosses. The black-on-white design conveys concepts of business growth, economic trends, profit, loss, success, and decision-making. Ideal for presentations, reports, infographics, or any design project requiring a raw, energetic visual representation of financial data and market fluctuations. Decrease vector vectors Grunge Hand Drawn Financial Growth and Decline Symbols Set. A dynamic collection of hand-drawn financial and trend-related symbols rendered in a grunge, brush-stroke style. This illustration features various dollar signs, upward and downward arrows, a zig-zag chart line, checkmarks, and crosses. The black-on-white design conveys concepts of business growth, economic trends, profit, loss, success, and decision-making. Ideal for presentations, reports, infographics, or any design project requiring a raw, energetic visual representation of financial data and market fluctuations.