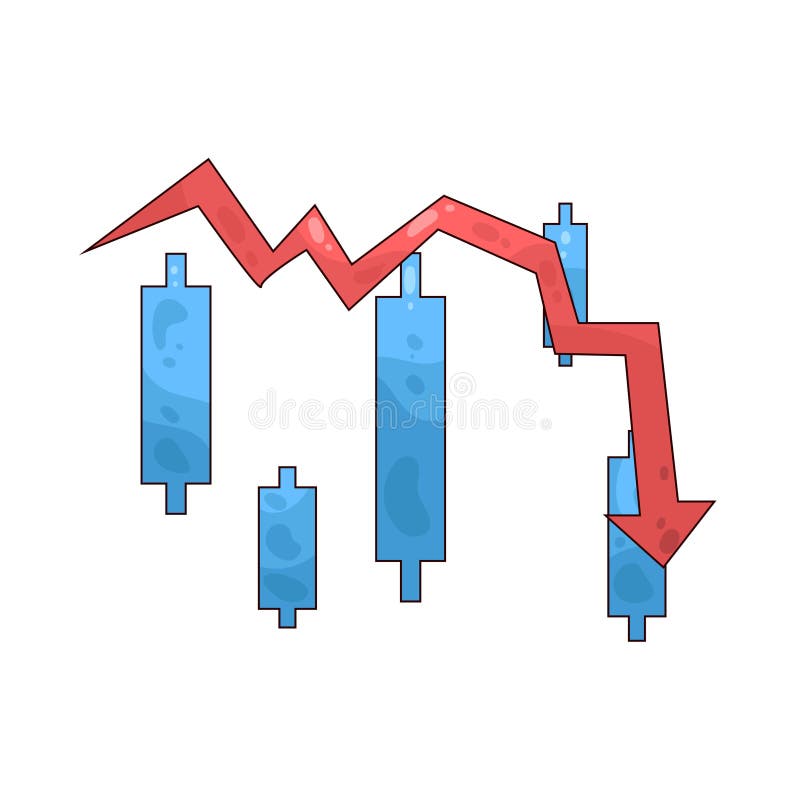
Free with trial Economic crisis icon of price decrease for oil barrel in global economy downturn, line vector. Stock exchange trade at world crisis with price index decrease in investments and financial recession. Decrease vectors Economic crisis icon, price decrease of oil barrel. Economic crisis icon of price decrease for oil barrel in global economy downturn, line vector. Stock exchange trade at world crisis with price index decrease in investments and financial recession
Free with trial A simple line graph icon showing a downward trend with two arrows and the words "DECREASE DECLINE. Decrease illustrations Downward Trend Graph Icon with Decrease Decline Text chart. A simple line graph icon showing a downward trend with two arrows and the words "DECREASE DECLINE
Free with trial A stark black 3D arrow is shown pointing downwards and to the right, isolated on a white background. The arrow has a sharp, angular design, with a vertical shaft that bends into a diagonal descent. This visual representation clearly conveys concepts of decline, decrease, or a negative trend, commonly used in business, finance, or statistical contexts. Decrease illustrations Black 3D Arrow Pointing Downward on White Background Symbolizing Decline decrease. A stark black 3D arrow is shown pointing downwards and to the right, isolated on a white background. The arrow has a sharp, angular design, with a vertical shaft that bends into a diagonal descent. This visual representation clearly conveys concepts of decline, decrease, or a negative trend, commonly used in business, finance, or statistical contexts
Free with trial Set line Financial growth decrease, Data analysis, and Server on black and white. Vector. Decrease illustrations Set line Financial growth decrease, Data analysis, and Server on black and white. Vector
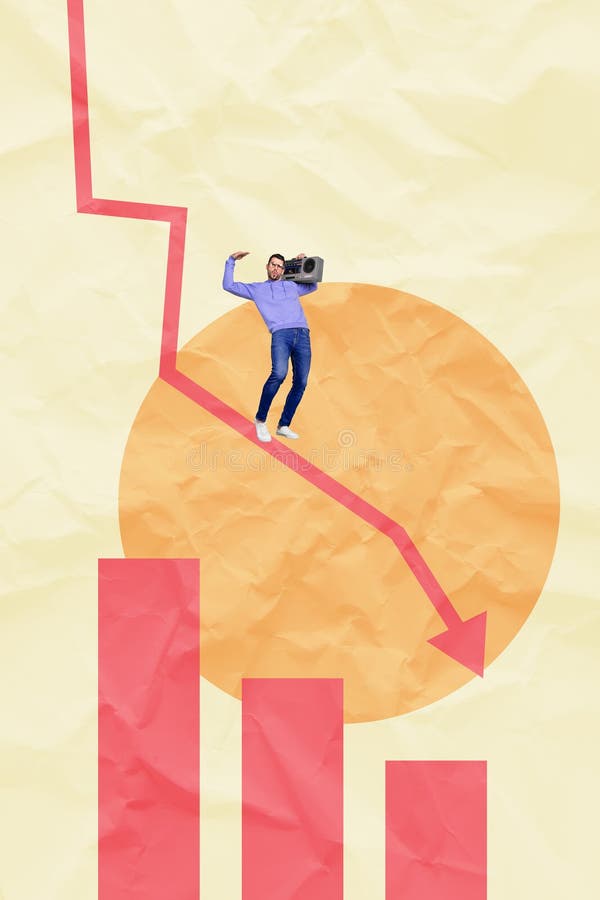
Free with trial Modern business crisis collage witt business analyzing shocking falling stats graph symbolizing global decrease. Decrease illustrations Modern business crisis collage witt business analyzing shocking falling stats graph symbolizing global decrease
Free with trial Sugar cubes with downward arrow. Sugar price falling or blood sugar decrease concept. 3D rendering isolated on white background. Decrease illustrations Sugar cubes with downward arrow. Sugar price falling or blood sugar decrease concept. 3D rendering
Free with trial Three gold bars with a black downward arrow, symbolizing a decrease in the value of gold or financial market decline. Decrease illustrations Three gold bars with a downward arrow indicating a decrease in value or a market decline. Three gold bars with a black downward arrow, symbolizing a decrease in. Three gold bars with a black downward arrow, symbolizing a decrease in the value of gold or financial market decline
Free with trial Decline bar chart with downward trend arrow outline icon vector. Decrease, loss, and financial drop symbol in black circle. Decrease vectors Decline bar chart with downward trend arrow outline icon. Decrease, loss, and financial drop symbol in black circle
Free with trial Set line Pie chart infographic, Financial growth decrease and Data analysis icon. Vector. Decrease vectors Set line Pie chart infographic, Financial growth decrease and Data analysis icon. Vector
Free with trial A single, large, shiny green arrow curves downwards on a white background. The arrow has a smooth, glossy surface that reflects light, giving it a three-dimensional appearance. The arrowhead points directly downwards, indicating a direction of descent or decrease. The vibrant green color and polished finish make the arrow stand out prominently. Decrease illustrations Shiny Green Downward Curved Arrow on a White Background direction decrease. A single, large, shiny green arrow curves downwards on a white background. The arrow has a smooth, glossy surface that reflects light, giving it a three-dimensional appearance. The arrowhead points directly downwards, indicating a direction of descent or decrease. The vibrant green color and polished finish make the arrow stand out prominently
Free with trial Decrease : Decrease represents a decline in value, performance, income, or financial resources. Decrease vectors Illustration of Decrease. Decrease : Decrease represents a decline in value, performance, income, or financial resources.
Free with trial Set line Data analysis, Financial growth, Calculator, Folder and lock, decrease and icon. Vector. Decrease illustrations Set line Data analysis, Financial growth, Calculator, Folder and lock, decrease and icon. Vector
Free with trial Set Sales funnel with chart, Financial growth decrease, Server and Calculator icon. Vector. Decrease illustrations Set Sales funnel with chart, Financial growth decrease, Server and Calculator icon. Vector
Free with trial A colorful bar chart displays a significant downward trend. The bars, colored red, yellow, green, and blue, decrease in height from left to right. A bold black arrow points downwards, emphasizing the decline. The chart is presented on a plain white background. Decrease illustrations Colorful Bar Chart Showing a Steep Decline with a Downward Arrow graph decrease. A colorful bar chart displays a significant downward trend. The bars, colored red, yellow, green, and blue, decrease in height from left to right. A bold black arrow points downwards, emphasizing the decline. The chart is presented on a plain white background
Free with trial Percentage arrow. rate increase and decrease concept. Decrease vectors Percentage arrow. rate increase and decrease concept.
Free with trial Set line Calculator, Mobile banking, Pos terminal and Financial growth decrease icon. Vector. Decrease vectors Set line Calculator, Mobile banking, Pos terminal and Financial growth decrease icon. Vector
Free with trial A bold red arrow pointing downward, symbolizing a decrease, loss, or negative trend. Decrease vectors Red downward arrow showing decrease or loss. A bold red arrow pointing downward, symbolizing a decrease, loss, or negative trend.
Free with trial Set Isometric Financial growth decrease Data analysis and Pie chart infographic icon. Vector. Decrease vectors Set Isometric Financial growth decrease, Data analysis and Pie chart infographic icon. Vector
Free with trial Young woman cuts off percentage sign with knife. Financial recession. Finance crisis. Expense decrease percent. Income reduction. Banking tax cost. Rate split. Vector concept of monetary inflation. Decrease vectors Young woman cuts off percentage sign with knife. Financial recession. Finance crisis. Expense decrease percent. Income reduction
Free with trial Productivity loss icon. Performance decrease Vector. Failure process symbol. Professional system error graphic. EPS 10. Decrease vectors Productivity loss icon. Performance decrease Vector. Failure process symbol. Professional system error graphic.
Free with trial Set line Shopping cart and dollar Piggy bank with coin and Financial growth decrease icon. Vector. Decrease illustrations Set line Shopping cart and dollar, Piggy bank with coin and Financial growth decrease icon. Vector
Free with trial Set Isometric Global economic crisis, Dollar rate decrease, Contract money and pen and icon. Vector. Decrease vectors Set Isometric Global economic crisis, Dollar rate decrease, Contract money and pen and icon. Vector
Free with trial Isometric gear wheel with a downward pointing arrow and falling droplets symbolizes a system or process of reduction, decrease, or falling metrics within a mechanical or digital context. Decrease vectors Gear mechanism indicating metric data decrease process. Isometric gear wheel with a downward pointing arrow and falling droplets symbolizes a system or process of reduction, decrease, or falling metrics within a mechanical or digital context
Free with trial Set line Location, Financial growth decrease, Old hourglass with sand and increase icon. Vector. Decrease illustrations Set line Location, Financial growth decrease, Old hourglass with sand and increase icon. Vector
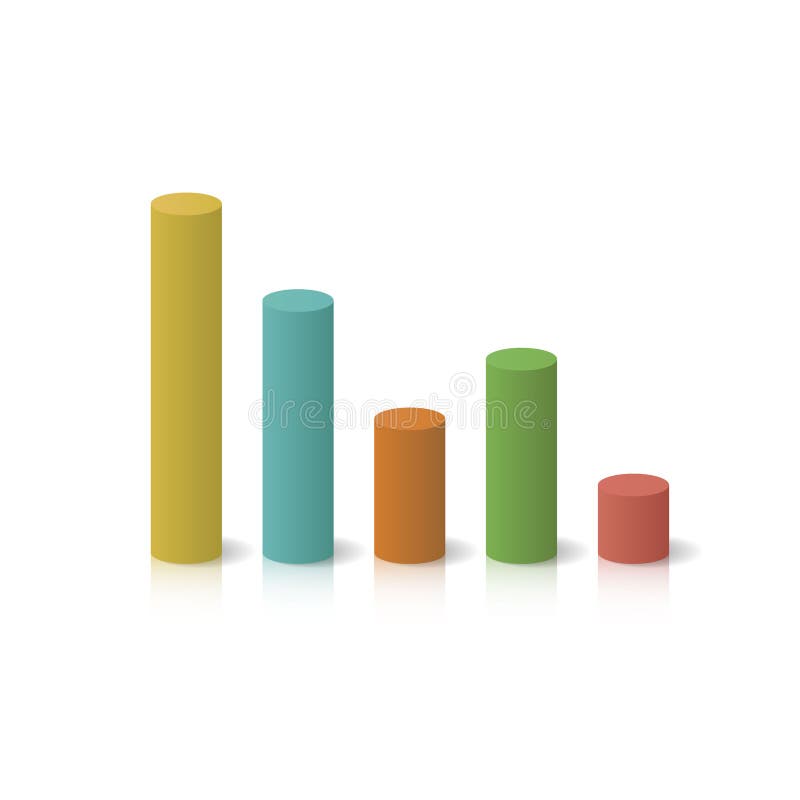
Free with trial Isometric colorful cylinder bar graph showing a financial decline. 3D chart representing loss, decrease, and business drop symbol. Decrease vectors Isometric colorful cylinder bar graph showing a financial decline. 3D chart representing loss, decrease, and business drop
Free with trial Pop art Financial growth decrease icon isolated on color background. Increasing revenue. Vector. Decrease vectors Pop art Financial growth decrease icon isolated on color background. Increasing revenue. Vector
Free with trial Corn price going down decrease cheaper in commodity market international trading market vector. Decrease vectors Corn price going down decrease cheaper in commodity market international trading market
Free with trial Set line Search cloud computing, Financial growth decrease and Pie chart infographic icon. Vector. Decrease vectors Set line Search cloud computing, Financial growth decrease and Pie chart infographic icon. Vector
Free with trial Coffee bean price commodity market low going down production decrease global trade vector. Decrease vectors Coffee bean price commodity market low going down production decrease global trade
Free with trial Set line Data analysis, Financial growth decrease, and Search data. Business infographic template. Vector. Decrease illustrations Set line Data analysis, Financial growth decrease, and Search data. Business infographic template. Vector
Free with trial Minus Sign in Blue Circle for Decrease, Subtraction, or Remove. Decrease vectors Minus Sign in Blue Circle for Decrease, Subtraction, or Remove
Free with trial Blue cloud icons set with CO2 text and downward arrows representing carbon emission reduction, greenhouse gas decrease, environmental sustainability and climate change concept. Vector illustration. Decrease vectors Blue cloud icons set with CO2 text and downward arrows representing carbon emission reduction, greenhouse gas decrease
Free with trial Interest rate going down decrease cost of fund and inflation money market percentage vector. Decrease illustrations Interest rate going down decrease cost of fund and inflation money market percentage
Free with trial Set line Football betting money, Casino chips, Financial growth decrease and with dollar icon. Vector. Decrease vectors Set line Football betting money, Casino chips, Financial growth decrease and with dollar icon. Vector
Free with trial Set line Football betting money, Casino chips, Financial growth decrease and with dollar icon. Vector. Decrease vectors Set line Football betting money, Casino chips, Financial growth decrease and with dollar icon. Vector
Free with trial A minimalist vector graphic showing a plus and minus symbol within a rounded rectangle. This UI element is used for functions like zoom in, zoom out, increase, or decrease. Decrease vectors Plus and minus line icon for increase and decrease control button. A minimalist vector graphic showing a plus and minus symbol within a rounded rectangle. This UI element is used for functions like zoom in, zoom out, increase, or decrease
Free with trial Green cloud icons set with CO2 text and downward arrows representing carbon emission reduction, greenhouse gas decrease, environmental sustainability and climate change concept. Vector illustration. Decrease vectors Green cloud icons set with CO2 text and downward arrows representing carbon emission reduction, greenhouse gas decrease
Free with trial Decrease indent text icon representing paragraph alignment control used to reduce indentation and organize text layout within document editing writing and publishing workflows. Decrease vectors Decrease Indent Text Formatting Tool For Adjusting Paragraph Alignment In Documents Color Icon Set. Decrease indent text icon representing paragraph alignment control used to reduce indentation and organize text layout within document editing writing and publishing workflows
Free with trial Set line Lottery ticket, Money bag, Casino chip with dollar and Financial growth decrease icon. Vector. Decrease illustrations Set line Lottery ticket, Money bag, Casino chip with dollar and Financial growth decrease icon. Vector
Free with trial Decrease indent text outline icon set designed for document editors, writing software, typography platforms, content management systems, and structured formatting tools. Decrease vectors Decrease Indent Text Line Icon Minimal Outline Collection for Document Formatting and Editing Tools. Decrease indent text outline icon set designed for document editors, writing software, typography platforms, content management systems, and structured formatting tools