Free with trial Data visualization with bar graphs and falling line charts emphasizes decreasing investments, declining growth rates, and negative financial indicators in corporate environment. Concept of crisis. Decreasing percentage vectors Data visualization with bar graphs and falling line charts emphasizes decreasing investments, declining growth rates
Free with trial A series of red downward-pointing arrows, each featuring a white percent symbol, visually represent falling prices, sales, and economic decline. Decreasing percentage illustrations Red downward arrows with percent symbols indicate decreasing prices and discounts. A series of red downward-pointing arrows, each featuring a white percent symbol, visually represent falling prices, sales, and economic decline
Free with trial Close-up of tax percentages written on a whiteboard with markers nearby. Decreasing percentage illustrations Tax percentages written on a whiteboard with markers nearby
Free with trial Loan percent, Wallet and Accounting line icons pack. Social media: share, comment, like icons. Clipboard, Decreasing graph, Loyalty star web icon. Vector. Decreasing percentage vectors Loan percent, Wallet and Accounting line icons pack. For web app. Social media icons. Vector. Loan percent, Wallet and Accounting line icons pack. Social media: share, comment, like icons. Clipboard, Decreasing graph, Loyalty star web icon. Vector
Free with trial Electronic stock market ticker showing decreasing and increasing values of different companies in an exchange market. Generative AI. Decreasing percentage illustrations Stock market ticker showing decreasing and increasing values in an exchange market. Electronic stock market ticker showing decreasing and increasing values of different companies in an exchange market. Generative AI
Free with trial A businessman in a suit interacts with a digital sales funnel hologram. The funnel is divided into stages: Awareness (75%), Interest (40%), Consideration, and Purchase (10%). Each stage is visually distinct, with decreasing size from top to bottom. The dark background emphasizes the light blue and white text of the funnel. The man's hand gesture suggests a connection or control over the digital display, symbolizing a marketing strategy concept. Decreasing percentage illustrations Businessman Touching Digital Sales Funnel with Percentage Data - Marketing Strategy. A businessman in a suit interacts with a digital sales funnel hologram. The funnel is divided into stages: Awareness (75%), Interest (40%), Consideration, and Purchase (10%). Each stage is visually distinct, with decreasing size from top to bottom. The dark background emphasizes the light blue and white text of the funnel. The man's hand gesture suggests a connection or control over the digital display, symbolizing a marketing strategy concept.
Free with trial A person hands typing on a laptop showcase a digital representation of arrows indicating increasing quality percentage and decreasing cost, emphasizing modern business efficiency. Qubit. Decreasing percentage illustrations Hands typing on laptop with digital arrows indicating increasing quality and decreasing cost in a modern workspace. A person hands typing on a laptop showcase a digital representation of arrows indicating increasing quality percentage and decreasing cost, emphasizing modern business efficiency. Qubit
Free with trial The image depicts a financial downturn, with stacks of coins decreasing in height and a prominent downward-pointing arrow on wooden blocks. This symbolizes financial loss, recession, and economic cha. Decreasing percentage illustrations Decreasing coin stacks and a downward arrow on wooden blocks symbolizing financial loss and recession. The image depicts a financial downturn, with stacks of coins decreasing in height and a prominent downward-pointing arrow on wooden blocks. This symbolizes financial loss, recession, and economic cha
Free with trial A downward-pointing arrow ending in a percentage sign indicates a decline. This visual represents concepts like loss, market downturn, or negative trends in business and finance. Isolated on white. Decreasing percentage illustrations Decreasing percentage arrow isolated on white background. use cases: finance, business, marketing. A downward-pointing arrow ending in a percentage sign indicates a decline. This visual represents concepts like loss, market downturn, or negative trends in business and finance. Isolated on white
Free with trial 3D percentage symbol with descending bar chart and downward curve, representing falling interest rates, financial trends, investment analysis, and economic decline on a clean pastel background. Decreasing percentage illustrations Falling Interest Rate Trend Concept 3d rendering. 3D percentage symbol with descending bar chart and downward curve, representing falling interest rates, financial trends, investment analysis, and economic decline on a clean pastel background
Free with trial 3D percentage symbol with descending bar chart and downward curve, representing falling interest rates, financial trends, investment analysis, and economic decline on a clean pastel background. Decreasing percentage illustrations Falling Interest Rate Trend Concept 3d rendering. 3D percentage symbol with descending bar chart and downward curve, representing falling interest rates, financial trends, investment analysis, and economic decline on a clean pastel background
Free with trial Green bar graph illustrating continuous growth or progress. Decreasing percentage illustrations Green bar graph illustrating continuous growth or progress.
Free with trial 3D percentage symbol with descending bar chart and downward curve, representing falling interest rates, financial trends, investment analysis, and economic decline on a clean pastel background. Decreasing percentage illustrations Falling Interest Rate Trend Concept 3d rendering. 3D percentage symbol with descending bar chart and downward curve, representing falling interest rates, financial trends, investment analysis, and economic decline on a clean pastel background
Free with trial 3D percentage symbol with descending bar chart and downward curve, representing falling interest rates, financial trends, investment analysis, and economic decline on a clean pastel background. Decreasing percentage illustrations Falling Interest Rate Trend Concept 3d rendering. 3D percentage symbol with descending bar chart and downward curve, representing falling interest rates, financial trends, investment analysis, and economic decline on a clean pastel background
Free with trial 3D percentage symbol with descending bar chart and downward curve, representing falling interest rates, financial trends, investment analysis, and economic decline on a clean pastel background. Decreasing percentage illustrations Falling Interest Rate Trend Concept 3d rendering. 3D percentage symbol with descending bar chart and downward curve, representing falling interest rates, financial trends, investment analysis, and economic decline on a clean pastel background
Free with trial 3D percentage symbol with descending bar chart and downward curve, representing falling interest rates, financial trends, investment analysis, and economic decline on a clean pastel background. Decreasing percentage illustrations Falling Interest Rate Trend Concept 3d rendering. 3D percentage symbol with descending bar chart and downward curve, representing falling interest rates, financial trends, investment analysis, and economic decline on a clean pastel background
Free with trial 3D percentage symbol with descending bar chart and downward curve, representing falling interest rates, financial trends, investment analysis, and economic decline on a clean pastel background. Decreasing percentage illustrations Falling Interest Rate Trend Concept 3d rendering. 3D percentage symbol with descending bar chart and downward curve, representing falling interest rates, financial trends, investment analysis, and economic decline on a clean pastel background
Free with trial 3D percentage symbol with descending bar chart and downward curve, representing falling interest rates, financial trends, investment analysis, and economic decline on a clean pastel background. Decreasing percentage illustrations Falling Interest Rate Trend Concept 3d rendering. 3D percentage symbol with descending bar chart and downward curve, representing falling interest rates, financial trends, investment analysis, and economic decline on a clean pastel background
Free with trial A clean, modern illustration of a horizontal loading bar. The bar features a series of segmented blue blocks, with the left side filled and gradually decreasing in fullness towards the right. The overall design is simple and effective, representing progress, waiting, or data transfer. This graphic is ideal for web design, app interfaces, presentations, and any context requiring a visual cue for ongoing processes. Decreasing percentage vectors Blue Loading Bar with Progress Indicator. A clean, modern illustration of a horizontal loading bar. The bar features a series of segmented blue blocks, with the left side filled and gradually decreasing in fullness towards the right. The overall design is simple and effective, representing progress, waiting, or data transfer. This graphic is ideal for web design, app interfaces, presentations, and any context requiring a visual cue for ongoing processes.
Free with trial This illustration represents the relationship between quality and cost in business, highlighting strategies for achieving optimal results through effective management and innovation. Qubit. Decreasing percentage illustrations Conceptual illustration of increasing quality and decreasing cost in business demonstrating efficiency and optimization. This illustration represents the relationship between quality and cost in business, highlighting strategies for achieving optimal results through effective management and innovation. Qubit
Free with trial This isometric illustration visually represents key financial metrics and analysis. It features a pie chart displaying a -65% and -35% breakdown, a clear glass jar filled with stacks of golden dollar coins symbolizing savings or investment, and a thermometer indicating a '100% MAX' level. The image effectively conveys concepts of financial performance, budgeting, risk assessment, and tracking economic indicators, making it ideal for business reports, articles on money management, investment strategies, or financial planning presentations. Decreasing percentage vectors Financial Performance and Savings Analysis Isometric Illustration. This isometric illustration visually represents key financial metrics and analysis. It features a pie chart displaying a -65% and -35% breakdown, a clear glass jar filled with stacks of golden dollar coins symbolizing savings or investment, and a thermometer indicating a '100% MAX' level. The image effectively conveys concepts of financial performance, budgeting, risk assessment, and tracking economic indicators, making it ideal for business reports, articles on money management, investment strategies, or financial planning presentations.
Free with trial Black and red graph showing strong business increase and performance. Decreasing percentage illustrations 3D business infographic showing economic decline. Black and red graph showing strong business increase and performance
Free with trial The image displays a series of battery icons arranged in three rows. Each row contains multiple battery icons, showcasing various charge levels. The top row features batteries with decreasing charge levels, from full to empty, with some batteries having cracks or damage. The second row shows batteries with increasing charge levels, from empty to full, with some displaying percentages such as 0%. Decreasing percentage vectors Battery charge levels displayed in a series of battery icons. The image displays a series of battery icons arranged in three rows. Each row contains multiple battery icons, showcasing various charge levels. The top row features batteries with decreasing charge levels, from full to empty, with some batteries having cracks or damage. The second row shows batteries with increasing charge levels, from empty to full, with some displaying percentages such as 0%
Free with trial A clear flowchart illustrating tax obligation reduction through various stages, starting with Warina and ending with a person. The diagram uses icons and percentages to represent the decreasing tax burden. Ideal for financial reports, tax advisory services, or educational materials. Decreasing percentage illustrations Tax Reduction Flowchart with Passport and Financial Data. A clear flowchart illustrating tax obligation reduction through various stages, starting with Warina and ending with a person. The diagram uses icons and percentages to represent the decreasing tax burden. Ideal for financial reports, tax advisory services, or educational materials
Free with trial A man in a suit holds out his hand with a glowing orb and graphs showing increasing quality and decreasing cost percentages floating above it. The background is an office setting with blurred furniture and windows. Decreasing percentage illustrations Businessman presenting cost and quality percentages in office. A man in a suit holds out his hand with a glowing orb and graphs showing increasing quality and decreasing cost percentages floating above it. The background is an office setting with blurred furniture and windows
Free with trial Diverse financial market indicators like money bags and falling trends illustrate economic concepts and global finance Perfect for investment and economic analysis visuals. Decreasing percentage illustrations Analyzing Financial Market Trends with Money Bags, Gold, and Global Economy. Diverse financial market indicators like money bags and falling trends illustrate economic concepts and global finance Perfect for investment and economic analysis visuals
Free with trial Increase and decrease percent rate isolated vector illustration on white background. Decreasing percentage vectors Increase and decrease percent rate isolated vector illustration
Free with trial A collection of financial icons represents gains, losses, and global currency exchange Perfect for illustrating economics and investment topics. Decreasing percentage illustrations Analyzing Financial Investment Performance with Chart, Gold, and Currency Concepts. A collection of financial icons represents gains, losses, and global currency exchange Perfect for illustrating economics and investment topics
Free with trial Interest rate cuts diminish savings investment returns. Visualized impact on yields potential losses. Decreasing percentage illustrations Interest Rate Cuts: Impact on Savings & Investments - Visual Representation of Decreasing Returns. Interest rate cuts diminish savings investment returns. Visualized impact on yields potential losses
Free with trial This eye-catching graphic features a three-dimensional representation of "10%" in bright yellow with a blue outline, great for deals and promotions. Decreasing percentage vectors Attractive ten percent discount graphic in blue and yellow on transparent background. This eye-catching graphic features a three-dimensional representation of "10%" in bright yellow with a blue outline, great for deals and promotions.
Free with trial A businessman in a suit uses a tablet and stylus to illustrate a strategy for quality and cost optimization with graphical representations showing improving quality and decreasing cost metrics this suggests business planning financial strategy and data analysis for business growth and improvement creating a dynamic image of business acumen and analytical thinking. Decreasing percentage illustrations Quality and Cost Optimization Strategy Illustrated by Businessman Using Tablet and Stylus with Graphical Representation of. A businessman in a suit uses a tablet and stylus to illustrate a strategy for quality and cost optimization with graphical representations showing improving quality and decreasing cost metrics this suggests business planning financial strategy and data analysis for business growth and improvement creating a dynamic image of business acumen and analytical thinking
Free with trial Illustration of financial data analysis with white and red line charts showing a downward trend on a blue gradient background representing economic decline and market analysis concepts. Decreasing percentage illustrations Abstract financial data analysis graph illustration with downward trend line chart in white and red color on blue gradient. Illustration of financial data. Illustration of financial data analysis with white and red line charts showing a downward trend on a blue gradient background representing economic decline and market analysis concepts
Free with trial A man displays a declining cost graph indicating effective cost reduction strategies He is working on a laptop computer demonstrating financial management and strategic business growth through careful cost optimization and efficiency gains in operational expenses for improved profit margins and sustainability. Decreasing percentage illustrations Cost reduction strategy with falling graph shown by a businessman using laptop computer for financial management and business. A man displays a declining cost graph indicating effective cost reduction strategies He is working on a laptop computer demonstrating financial management and strategic business growth through careful cost optimization and efficiency gains in operational expenses for improved profit margins and sustainability
Free with trial Budget Cut icon. Represents a reduction in financial expenses with scissors cutting through a dollar bill. Used for concepts of cost reduction, budgeting, and fiscal austerity. Vector illustration. Decreasing percentage vectors Budget Cut Icon
Free with trial Cost minimising icon isolated on background vector illustration. Decreasing percentage vectors Cost minimising icon isolated on background
Free with trial A businessman in a suit interacts with a digital interface illustrating the relationship between quality and cost. The image features a visual representation of increasing quality and decreasing cost, with checkmarks indicating positive outcomes. This concept is ideal for illustrating business strategies, efficiency, and financial planning. The scene includes a clipboard with charts, adding a professional context. Decreasing percentage illustrations Quality vs. Cost: Business Concept. A businessman in a suit interacts with a digital interface illustrating the relationship between quality and cost. The image features a visual representation of increasing quality and decreasing cost, with checkmarks indicating positive outcomes. This concept is ideal for illustrating business strategies, efficiency, and financial planning. The scene includes a clipboard with charts, adding a professional context.
Free with trial A metaphor showing Decrease in equilibrium with Breakthrough, symbolizing a desired harmony between them. Stability. Harmonious and preferable setup. Decreasing percentage illustrations Decrease and breakthrough in balance. A metaphor showing Decrease in equilibrium with Breakthrough, symbolizing a desired harmony between them. Stability. Harmonious and preferable setup
Free with trial Falling white chart arrow with percent icon on wide yellow background with mock up place. Falling interest rates and mortgage concept. 3D Rendering. Decreasing percentage illustrations Falling white chart arrow with percent icon on wide yellow background with mock up place.
Free with trial A businessperson holds a magnifying glass, focusing on the concept of increasing quality and decreasing cost. The image represents strategic business optimization, efficiency improvement, and performance management, surrounded by various related icons. Decreasing percentage illustrations Quality and Cost Optimization Business Strategy Concept. A businessperson holds a magnifying glass, focusing on the concept of increasing quality and decreasing cost. The image represents strategic business optimization, efficiency improvement, and performance management, surrounded by various related icons
Free with trial Falling green chart arrow with percent icon on white background. Falling interest rates and mortgage concept. 3D Rendering. Decreasing percentage illustrations Falling green chart arrow with percent icon on white background. Falling interest rates and mortgage concept.
Free with trial High Dollar Symbol, Dollar price high, Price increase icon, rising commodity prices, interest rate increase, high inflation, financial growth web design. Decreasing percentage vectors High Dollar Symbol, Dollar price high, Price increase icon, rising commodity prices
Free with trial The image presents a comprehensive collection of icons that span across various themes, predominantly focusing on education, business, and finance. At the top left corner, educational symbols such as a graduation cap, book, pencil, and calculator are visible, indicating a strong emphasis on learning and academic pursuits. Adjacent to these, a series of icons representing different aspects of. Decreasing percentage vectors A collection of various icons related to education, business, and finance. The image presents a comprehensive collection of icons that span across various themes, predominantly focusing on education, business, and finance. At the top left corner, educational symbols such as a graduation cap, book, pencil, and calculator are visible, indicating a strong emphasis on learning and academic pursuits. Adjacent to these, a series of icons representing different aspects of
Free with trial Illustrative graphic showing a declining financial graph with a downward arrow alongside stacks of coins representing a fall in interest rates and market value. Decreasing percentage illustrations Financial Crisis: Decreasing Interest Rates and Market Decline. Illustrative graphic showing a declining financial graph with a downward arrow alongside stacks of coins representing a fall in interest rates and market value
Free with trial Falling interest rates blur past apartment dwellers who are on their balconies to witness the action. Decreasing percentage illustrations Falling interest rates blur past apartment dwellers who are on their balconies
Free with trial Falling interest rates blur past apartment dwellers who are on their balconies to witness the action. Decreasing percentage illustrations Falling interest rates blur past apartment dwellers who are on their balconies
Free with trial A businessperson holds a magnifying glass, focusing on the concept of increasing quality and decreasing cost. The image represents strategic business optimization, efficiency improvement, and performance management, surrounded by various related icons. Decreasing percentage illustrations Quality and Cost Optimization Business Strategy Concept. A businessperson holds a magnifying glass, focusing on the concept of increasing quality and decreasing cost. The image represents strategic business optimization, efficiency improvement, and performance management, surrounded by various related icons
Free with trial A complex financial chart displaying a combination of blue bar graphs, red and green candlesticks, and multiple colored trend lines. Numerical data and percentage changes are visible. A faint world map is subtly integrated into the dark blue background, suggesting global financial activity. Decreasing percentage illustrations Stock Market Candlestick Chart With Bar Graph and World Map. A complex financial chart displaying a combination of blue bar graphs, red and green candlesticks, and multiple colored trend lines. Numerical data and percentage changes are visible. A faint world map is subtly integrated into the dark blue background, suggesting global financial activity
Free with trial A man in a suit uses a stylus on a tablet, placed on a laptop, analyzing a digital graph displaying an upward trend in quality and a downward trend in cost. The graph features arrows and percentage symbols, indicating data analysis. A wireless mouse is nearby, on a sleek, modern desk setup. The environment suggests a business or office context. Decreasing percentage illustrations Businessman Analyzing Increasing Quality, Decreasing Cost Graph on Tablet. A man in a suit uses a stylus on a tablet, placed on a laptop, analyzing a digital graph displaying an upward trend in quality and a downward trend in cost. The graph features arrows and percentage symbols, indicating data analysis. A wireless mouse is nearby, on a sleek, modern desk setup. The environment suggests a business or office context.
Free with trial Red columns on financial chart indicating positive market trend. Decreasing percentage illustrations 3D business infographic showing economic decline, red and gray. Red columns on financial chart indicating positive market trend
Free with trial High Dollar Symbol Black, Dollar price high, Price increase icon, rising commodity prices, interest rate increase, high inflation, financial growth web design. Decreasing percentage vectors High Dollar Symbol Black, Dollar price high, Price increase icon, rising commodity prices, interest rate increase, high inflation
Free with trial Low Dollar Symbol black, Dollar price Low, Price decrease icon, commodity prices, interest rate decrease, Low Recession, financial growth web design. Decreasing percentage vectors Low Dollar Symbol black, Dollar price Low, Price decrease icon, commodity prices, interest rate decrease, Low Recession, financial
Free with trial Low Dollar Symbol, Dollar price Low, Price decrease icon, commodity prices, interest rate decrease, Low Recession, financial growth web design. Decreasing percentage vectors Low Dollar Symbol, Dollar price Low, Price decrease icon, commodity prices, interest rate decrease, Low Recession, financial
Free with trial A young woman who wants to buy a house is trying to force interest rates to go down by pushing the percent symbol off a cliff in a 3-d illustration. Decreasing percentage illustrations A young woman who wants to buy a house is trying to force interest rates to go down by pushing the percent symbol off a cliff
Free with trial A financial illustration shows coins decreasing in size along a horizontal axis, representing devaluation. An upward-pointing arrow indicates increasing inflation percentages, with labels of "4%", "20%", and "50%". The chart is labeled "INFLATION" at the top, with percentages scattered around. Broken pieces from a large coin suggest fragmentation and loss of value. The background features a subtle line graph, reinforcing the economic theme. Decreasing percentage illustrations Inflation increasing and devaluing money, showing a financial chart with coins and an arrow going up. A financial illustration shows coins decreasing in size along a horizontal axis, representing devaluation. An upward-pointing arrow indicates increasing inflation percentages, with labels of "4%", "20%", and "50%". The chart is labeled "INFLATION" at the top, with percentages scattered around. Broken pieces from a large coin suggest fragmentation and loss of value. The background features a subtle line graph, reinforcing the economic theme.
Free with trial Close-up of tax percentages written on a whiteboard with markers nearby. Decreasing percentage illustrations Tax percentages written on a whiteboard with markers nearby
Free with trial Close-up of tax percentages written on a whiteboard with markers nearby. Decreasing percentage illustrations Tax percentages written on a whiteboard with markers nearby
Free with trial Close-up of tax percentages written on a whiteboard with markers nearby. Decreasing percentage illustrations Tax percentages written on a whiteboard with markers nearby
Free with trial This sales graph clearly illustrates a concerning downward trend. The visualization displays a significant decline in sales figures over a specified period, potentially indicating a market downturn or other factors impacting business performance. Careful analysis of this data is crucial for understanding the underlying causes. Are sales decreasing across all product lines or specific segments. Decreasing percentage illustrations Analyzing Declining Sales Trends A Deep Dive into Market Performance and Potential Recovery Strategies. This sales graph clearly illustrates a concerning downward trend. The visualization displays a significant decline in sales figures over a specified period, potentially indicating a market downturn or other factors impacting business performance. Careful analysis of this data is crucial for understanding the underlying causes. Are sales decreasing across all product lines or specific segments
Free with trial A hand displays a graphic showing quality increasing and cost decreasing, surrounded by glowing particles. Decreasing percentage illustrations Hand Presenting Quality Improvement and Cost Reduction Concept business Modern technology business information. A hand displays a graphic showing quality increasing and cost decreasing, surrounded by glowing particles
Free with trial 3D rendering illustrating a sharp decline in interest rates and economic downturn. A falling graph and decreasing coin stacks depict financial instability. Decreasing percentage illustrations Financial Crisis: Interest Rates Plummet, Economic Downturn Shown by Falling Graph and Diminishing Coin Stacks. 3D rendering illustrating a sharp decline in interest rates and economic downturn. A falling graph and decreasing coin stacks depict financial instability
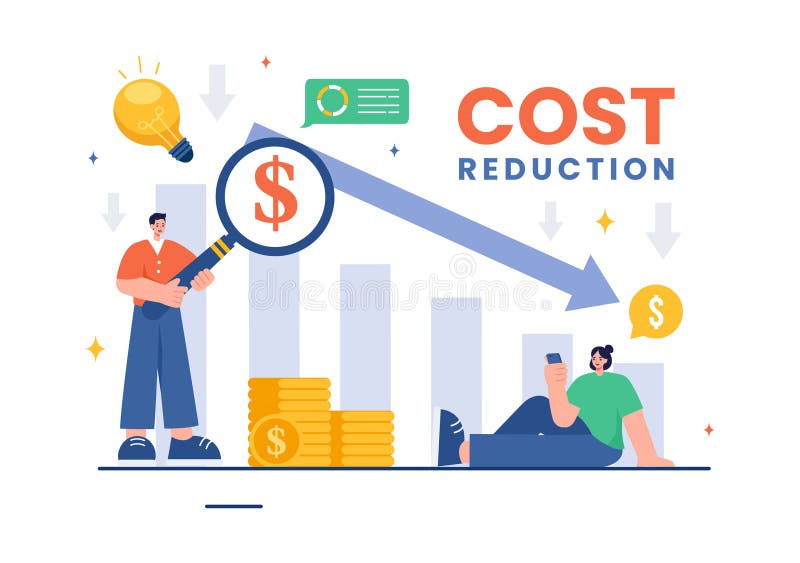
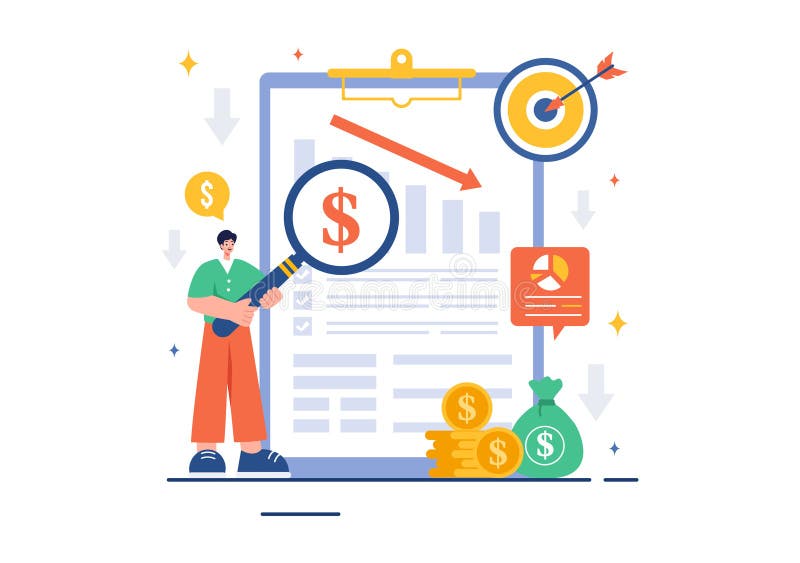
Free with trial Cost Reduction Vector Illustration depicting Decrease, Price Minimization, or Falling Profit Rates in Business, in a Flat Style Cartoon Background. Decreasing percentage vectors Cost Reduction Vector Illustration depicting Decrease, Price Minimization, or Falling Profit Rates in Business, in a Flat Style
Free with trial Cost Reduction Vector Illustration depicting Decrease, Price Minimization, or Falling Profit Rates in Business, in a Flat Style Cartoon Background. Decreasing percentage vectors Cost Reduction Vector Illustration depicting Decrease, Price Minimization, or Falling Profit Rates in Business, in a Flat Style
Free with trial Cost Reduction Vector Illustration depicting Decrease, Price Minimization, or Falling Profit Rates in Business, in a Flat Style Cartoon Background. Decreasing percentage vectors Cost Reduction Vector Illustration depicting Decrease, Price Minimization, or Falling Profit Rates in Business, in a Flat Style
Free with trial Cost Reduction Vector Illustration depicting Decrease, Price Minimization, or Falling Profit Rates in Business, in a Flat Style Cartoon Background. Decreasing percentage vectors Cost Reduction Vector Illustration depicting Decrease, Price Minimization, or Falling Profit Rates in Business, in a Flat Style
Free with trial Cost Reduction Vector Illustration depicting Decrease, Price Minimization, or Falling Profit Rates in Business, in a Flat Style Cartoon Background. Decreasing percentage vectors Cost Reduction Vector Illustration depicting Decrease, Price Minimization, or Falling Profit Rates in Business, in a Flat Style
Free with trial Cost Reduction Vector Illustration depicting Decrease, Price Minimization, or Falling Profit Rates in Business, in a Flat Style Cartoon Background. Decreasing percentage vectors Cost Reduction Vector Illustration depicting Decrease, Price Minimization, or Falling Profit Rates in Business, in a Flat Style
Free with trial Cost Reduction Vector Illustration depicting Decrease, Price Minimization, or Falling Profit Rates in Business, in a Flat Style Cartoon Background. Decreasing percentage vectors Cost Reduction Vector Illustration depicting Decrease, Price Minimization, or Falling Profit Rates in Business, in a Flat Style
Free with trial Cost Reduction Vector Illustration depicting Decrease, Price Minimization, or Falling Profit Rates in Business, in a Flat Style Cartoon Background. Decreasing percentage vectors Cost Reduction Vector Illustration depicting Decrease, Price Minimization, or Falling Profit Rates in Business, in a Flat Style
Free with trial Cost Reduction Vector Illustration depicting Decrease, Price Minimization, or Falling Profit Rates in Business, in a Flat Style Cartoon Background. Decreasing percentage vectors Cost Reduction Vector Illustration depicting Decrease, Price Minimization, or Falling Profit Rates in Business, in a Flat Style
Free with trial Cost Reduction Vector Illustration depicting Decrease, Price Minimization, or Falling Profit Rates in Business, in a Flat Style Cartoon Background. Decreasing percentage vectors Cost Reduction Vector Illustration depicting Decrease, Price Minimization, or Falling Profit Rates in Business, in a Flat Style
Free with trial Cost Reduction Vector Illustration depicting Decrease, Price Minimization, or Falling Profit Rates in Business, in a Flat Style Cartoon Background. Decreasing percentage vectors Cost Reduction Vector Illustration depicting Decrease, Price Minimization, or Falling Profit Rates in Business, in a Flat Style
Free with trial Cost Reduction Vector Illustration depicting Decrease, Price Minimization, or Falling Profit Rates in Business, in a Flat Style Cartoon Background. Decreasing percentage vectors Cost Reduction Vector Illustration depicting Decrease, Price Minimization, or Falling Profit Rates in Business, in a Flat Style
Free with trial Cost Reduction Vector Illustration depicting Decrease, Price Minimization, or Falling Profit Rates in Business, in a Flat Style Cartoon Background. Decreasing percentage vectors Cost Reduction Vector Illustration depicting Decrease, Price Minimization, or Falling Profit Rates in Business, in a Flat Style
Free with trial Looking at the falling percentage symbol in confusion. Falling and decreasing concept. Decreasing percentage vectors Looking at the falling percentage symbol in confusion. Falling and decreasing concept
Free with trial Percent down arrow icon isolated. Decreasing percentage sign. Set icons colorful square buttons. Vector Illustration. Decreasing percentage vectors Percent down arrow icon isolated. Decreasing percentage sign. Set icons colorful square buttons
Free with trial Percent down arrow icon isolated on green background. Decreasing percentage sign. Flat design. Vector Illustration. Decreasing percentage vectors Percent down arrow icon isolated on green background. Decreasing percentage sign. Flat design. Vector
Free with trial Set Percent down arrow icon isolated on black and white background. Decreasing percentage sign. Vector. Decreasing percentage vectors Set Percent down arrow icon isolated on black and white background. Decreasing percentage sign. Vector
Free with trial White Percent down arrow icon isolated on blue background. Decreasing percentage sign. Circle blue button with white line. Vector Illustration. Decreasing percentage vectors White Percent down arrow icon isolated on blue background. Decreasing percentage sign. Circle blue button with white