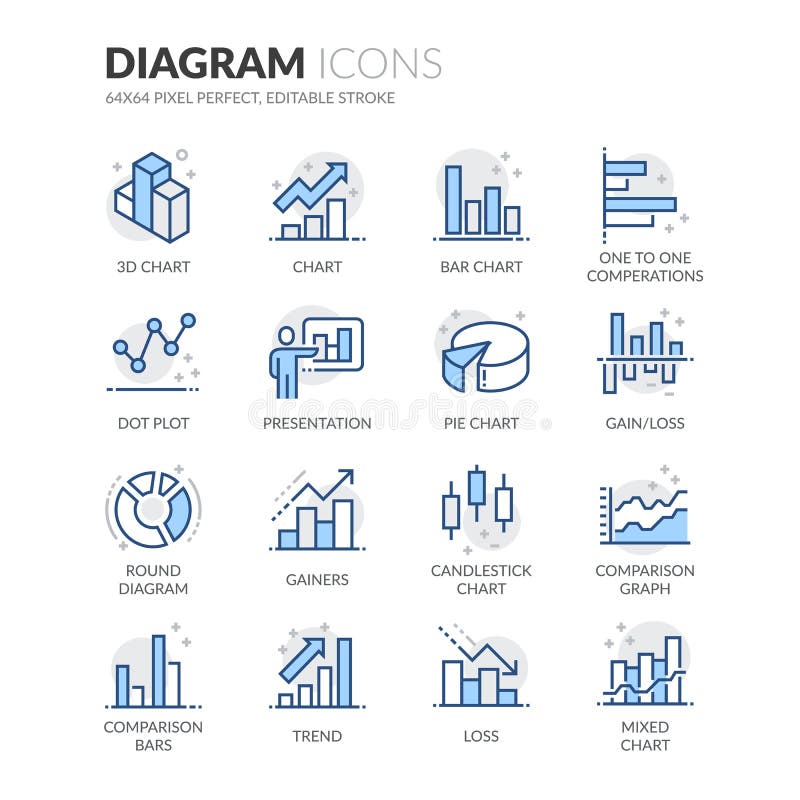
Free with trial Simple Set of Graph and Diagram Related Color Vector Line Icons. Contains such Icons as Presentation, Pie Chart, Round Diagram, Candlestick Chart and more. Editable Stroke. 64x64 Pixel Perfect. Design dot plot vectors Line Diagram Icons. Simple Set of Graph and Diagram Related Color Vector Line Icons. Contains such Icons as Presentation, Pie Chart, Round Diagram, Candlestick. Simple Set of Graph and Diagram Related Color Vector Line Icons. Contains such Icons as Presentation, Pie Chart, Round Diagram, Candlestick Chart and more. Editable Stroke. 64x64 Pixel Perfect.
Free with trial Business icons of ratings graphs and charts, infographic elements set isolated vector illustration. Design dot plot vectors Business icons of ratings graphs and charts. Infographic elements set isolated vector illustration
Free with trial Business ratings graphs and charts. Infographic elements vector illustration. Design dot plot vectors Business ratings graphs and charts. Infographic elements vector illustration
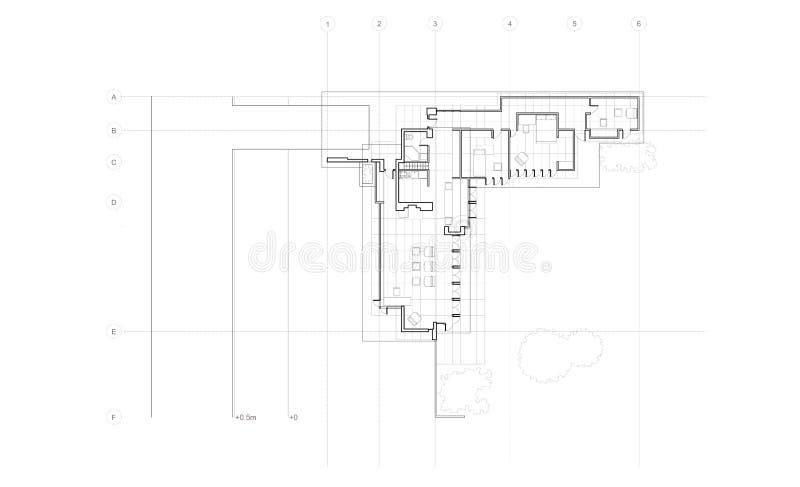
Free with trial Jacobs House Detailed Plan. Very Detailed plan of the modern house (Jacobs' House) for the architect Frank Lloyd Wright. Design dot plot vectors Jacobs House Detailed Plan. Very Detailed plan of the modern house (Jacobs' House) for the architect Frank Lloyd Wright
Free with trial Illustrated collection of Colorful home logos isolated on white. vector file. Design dot plot vectors Home logos collection. Illustrated collection of Colorful home logos isolated on white. vector file. Illustrated collection of Colorful home logos isolated on white. vector file.
Free with trial Set of marked paper templates. Ruled, grid, dotgrid and isometric paper in several real sizes for notes, sketches, drawings and designs. A4 plotted format. Design dot plot vectors Gridded paper templates set for new designs. Set of marked paper templates. Ruled, grid, dotgrid and isometric paper in several real sizes for notes, sketches. Set of marked paper templates. Ruled, grid, dotgrid and isometric paper in several real sizes for notes, sketches, drawings and designs. A4 plotted format.
Free with trial Engineering draft seamless pattern. Geometric vector wallpaper or website background. Design dot plot vectors Engineering draft seamless pattern. Geometric vector wallpaper or website background
Free with trial Business infographic elements. For finance marketing or strategy report isolated vector illustration. Design dot plot vectors Business infographic elements. For finance marketing or strategy report isolated vector illustration
Free with trial Engineering draft seamless pattern. Geometric wallpaper or website background. Design dot plot vectors Engineering draft pattern. Engineering draft seamless pattern. Geometric wallpaper or website background. Engineering draft seamless pattern. Geometric wallpaper or website background.
Free with trial Dot plot infographic chart design template set for dark theme. Spreading indicator. Research numbers. Visual data presentation. Editable diagrams collection. Myriad Pro-Bold, Regular fonts used. Design dot plot vectors Dot plot infographic chart design template set for dark theme. Spreading indicator. Research numbers. Visual data presentation. Editable diagrams collection
Free with trial Dot plot graph line icon. Presentation chart sign. Market analytics symbol. Geometric shapes. Random cross elements. Linear Dot plot icon design. Vector. Design dot plot vectors Dot plot graph line icon. Presentation chart sign. Vector. Dot plot graph line icon. Presentation chart sign. Market analytics symbol. Geometric shapes. Random. Dot plot graph line icon. Presentation chart sign. Market analytics symbol. Geometric shapes. Random cross elements. Linear Dot plot icon design. Vector
Free with trial Dot plot graph line icon. Presentation chart sign. Market analytics symbol. Colorful outline concept. Blue and orange thin line color Dot plot icon. Vector. Design dot plot vectors Dot plot graph line icon. Presentation chart sign. Vector. Dot plot graph line icon. Presentation chart sign. Market analytics symbol. Colorful outline concept. Dot plot graph line icon. Presentation chart sign. Market analytics symbol. Colorful outline concept. Blue and orange thin line color Dot plot icon. Vector
Free with trial Liquid badges. Set of Cloud storage, Dot plot and Star icons. Crane claw machine sign. Computer, Presentation graph, Customer feedback. Attraction park. Gradient cloud storage icon. Vector. Design dot plot vectors Cloud storage, Dot plot and Star icons. Crane claw machine sign. Vector. Liquid badges. Set of Cloud storage, Dot plot and Star icons. Crane claw machine sign. Liquid badges. Set of Cloud storage, Dot plot and Star icons. Crane claw machine sign. Computer, Presentation graph, Customer feedback. Attraction park. Gradient cloud storage icon. Vector
Free with trial Big data. Futuristic info graphics aesthetic design. Visual information complexity. Intricate data threads plot. Business analytics representation. wave points fractal grid. Sound visualization. Design dot plot vectors Big data. Futuristic info graphics aesthetic design. Visual information complexity. Intricate data threads plot. Business. Analytics representation. wave points. Big data. Futuristic info graphics aesthetic design. Visual information complexity. Intricate data threads plot. Business analytics representation. wave points fractal grid. Sound visualization
Free with trial Vector abstract big data visualization. Complex data design. Abstract radial graph. Visual big data analysis. Science technology background. Vector illustration. Design dot plot vectors Abstract big data visualization. Complex data design. Abstract radial graph. Visual big data analysis. Science background. Vector abstract big data visualization. Vector abstract big data visualization. Complex data design. Abstract radial graph. Visual big data analysis. Science technology background. Vector illustration
Free with trial Dot Chart Vector Icon. Flat icon isolated on the white background. Editable EPS file. Vector illustration. Design dot plot vectors Dot Chart Vector Icon. Flat icon isolated on the white background. Editable EPS file. Vector illustration
Free with trial Vector abstract big data visualization. Complex data design. Abstract radial graph. Visual big data analysis. Science technology b. Ackground. Illustration. Design dot plot vectors Vector abstract big data visualization. Complex data design. Abstract radial graph. Visual big data analysis. Science technology b. Ackground. Illustration
Free with trial Dot Chart Vector Icon. Flat icon isolated on the white background. Editable EPS file. Vector illustration. Design dot plot vectors Dot Chart Vector Icon. Flat icon isolated on the white background. Editable EPS file. Vector illustration
Free with trial Big data visual representation. Complex big data analysis. Information visualization concept. Abstract radial data plot. Vector technology background. Design dot plot vectors Big data visual representation. Complex big data analysis. Information visualization concept. Abstract radial data plot. Vector technology background
Free with trial Dot plot, Creative idea and Love book line icons set. Handshake deal, research and promotion complex icons. Target sign. Presentation graph, Startup, Customer feedback. Targeting. Vector. Design dot plot vectors Dot plot, Creative idea and Love book icons set. Target sign. Presentation graph, Startup, Customer feedback. Vector. Dot plot, Creative idea and Love book line. Dot plot, Creative idea and Love book line icons set. Handshake deal, research and promotion complex icons. Target sign. Presentation graph, Startup, Customer feedback. Targeting. Vector
Free with trial Target sign. Infographics timeline. Dot plot, Creative idea and Love book line icons set. Presentation graph, Startup, Customer feedback. Targeting. Education set. Dot plot icon. Vector. Design dot plot vectors Dot plot, Creative idea and Love book icons set. Target sign. Presentation graph, Startup, Customer feedback. Vector. Target sign. Infographics timeline. Dot. Target sign. Infographics timeline. Dot plot, Creative idea and Love book line icons set. Presentation graph, Startup, Customer feedback. Targeting. Education set. Dot plot icon. Vector
Free with trial Big data. Futuristic info graphics aesthetic design. Visual information complexity. Intricate data threads plot. Business analytics representation. wave points fractal grid. Sound visualization. Design dot plot vectors Big data. Futuristic info graphics aesthetic design. Visual information complexity. Intricate data threads plot. Business. Analytics representation. wave points. Big data. Futuristic info graphics aesthetic design. Visual information complexity. Intricate data threads plot. Business analytics representation. wave points fractal grid. Sound visualization
Free with trial Magic portal of fantasy. Futuristic teleport. Light effect. Colorful dots with sparks on night background. Empty Disco club dance floor. Scatter Plot elements. Data sorting. Vector illustration. Design dot plot illustrations Magic portal of fantasy. Futuristic teleport. Light effect. Colorful dots with sparks on night background. Empty Disco club dance floor. Scatter Plot elements
Free with trial Scatter chart color vector doodle simple icon. Scatter chart color vector doodle icon for web design and presentation isolated on background. Design dot plot vectors Scatter chart color vector doodle simple icon. Scatter chart color vector doodle icon for web design and presentation isolated on background
Free with trial Wave 3d. Wave of particles. Futuristic point wave. Design for poster. Technology vector background. Vector illustration. Design dot plot illustrations Wave 3d. Wave of particles. Futuristic point wave. Design for poster. Technology vector background. Vector illustration. Wave of particles. Futuristic point wave
Free with trial Halftone dashed circle area. Dotted dashed circle area designed with small circle pixels. Vector illustration of dashed circle area icon on a white background. Halftone pattern contains circle dots. Design dot plot vectors Halftone Dot Vector Dashed Circle Area Icon. Halftone dashed circle area. Dotted dashed circle area designed with small circle pixels. Vector illustration of. Halftone dashed circle area. Dotted dashed circle area designed with small circle pixels. Vector illustration of dashed circle area icon on a white background. Halftone pattern contains circle dots.
Free with trial Animals - elephant and dog 3. Jpeg and vector illustration with animals and smile faces on the paper sheet. Design dot plot vectors Animals - elephant and dog 3. Jpeg and vector illustration with animals and smile faces on the paper sheet
Free with trial Icons set of business presentation charts and. Icons set of business presentation charts graphs and infographic elements isolated vector illustration. Design dot plot vectors Icons set of business presentation charts and. Icons set of business presentation charts graphs and infographic elements isolated vector illustration
Free with trial Infographic elements for business report. Presentation or website isolated vector illustration. Design dot plot vectors Infographic elements for business report. Presentation or website isolated vector illustration
Free with trial Doodle business diagrams set on blackboard. Vector illustration. Design dot plot vectors Doodle business diagrams set on blackboard. Vector illustration
Free with trial Vector abstract big data visualization. Complex data concept. Abstract information diagram. Visual big data analysis. Science technology background. Design dot plot vectors Abstract big data visualization. Complex data concept. Abstract information diagram. Visual big data analysis. Science technology. Vector abstract big data. Vector abstract big data visualization. Complex data concept. Abstract information diagram. Visual big data analysis. Science technology background
Free with trial Vector cute illustration of cute pink postcard with white cat, little bird, tape, flowers, stars and inscription - best friends forever. Hand drawn poster. The arts. Drawn with colored crayons and pen. Design dot plot vectors Vector cute illustration of cute pink postcard with white cat, little bird, tape, flowers, stars and inscription. Vector cute illustration of cute pink postcard. Vector cute illustration of cute pink postcard with white cat, little bird, tape, flowers, stars and inscription - best friends forever. Hand drawn poster. The arts. Drawn with colored crayons and pen
Free with trial Outline set of Loyalty points, Sales diagram and Vip shopping line icons for web application. Talk, information, delivery truck outline icon. Include Card, Pyramid chart, Networking icons. Vector. Design dot plot vectors Outline set of Loyalty points, Sales diagram and Vip shopping line icons for web application. For design. Vector. Outline set of Loyalty points, Sales diagram. Outline set of Loyalty points, Sales diagram and Vip shopping line icons for web application. Talk, information, delivery truck outline icon. Include Card, Pyramid chart, Networking icons. Vector
Free with trial A minimalist infographic featuring a dot plot chart, effectively displaying the frequency and distribution of discrete data points. This clear graphic is perfect for simple statistical presentations, survey results, or educational materials. It offers a straightforward way to visualize data density, ideal for accessible and precise communication, vector design Generative AI. Design dot plot vectors Dot Plot Data Distribution Chart, vector design Generative AI. A minimalist infographic featuring a dot plot chart, effectively displaying the frequency and. A minimalist infographic featuring a dot plot chart, effectively displaying the frequency and distribution of discrete data points. This clear graphic is perfect for simple statistical presentations, survey results, or educational materials. It offers a straightforward way to visualize data density, ideal for accessible and precise communication, vector design Generative AI
Free with trial Dot plot, Loan percent and Payment card line icons pack. 3d design elements. Card, Vip shopping, Report statistics web icon. Report diagram, Bid offer, Cut ribbon pictogram. Vector. Design dot plot vectors Dot plot, Loan percent and Payment card line icons pack. For web app. 3d design elements. Vector. Dot plot, Loan percent and Payment card line icons pack. 3d. Dot plot, Loan percent and Payment card line icons pack. 3d design elements. Card, Vip shopping, Report statistics web icon. Report diagram, Bid offer, Cut ribbon pictogram. Vector
Free with trial Report, 3D Chart, Block diagram and Dot Plot graph linear icons. Design shape elements. Charts and Diagrams line icons. Trend, Pyramid and Pie chart report symbols. Vector. Design dot plot vectors Charts and Diagrams line icons. Set of 3D Chart, Block diagram and Dot Plot graph icons. Design elements. Vector. Report, 3D Chart, Block diagram and Dot Plot. Report, 3D Chart, Block diagram and Dot Plot graph linear icons. Design shape elements. Charts and Diagrams line icons. Trend, Pyramid and Pie chart report symbols. Vector
Free with trial Dot plot graph line icon. Halftone dotted pattern. Gradient icon with grain shadow. Presentation chart sign. Market analytics symbol. Line dot plot icon. Various designs. Vector. Design dot plot vectors Dot plot graph line icon. Presentation chart sign. Halftone dotted pattern. Vector. Dot plot graph line icon. Halftone dotted pattern. Gradient icon with grain. Dot plot graph line icon. Halftone dotted pattern. Gradient icon with grain shadow. Presentation chart sign. Market analytics symbol. Line dot plot icon. Various designs. Vector
Free with trial A crisp, minimalist, flat design vector illustration. This icon combines a bar chart and a dot plot, showing a positive growth trend despite small fluctuations. Design dot plot vectors Monochrome Icon Combined Bar Chart and Dot Plot with Upward Trend. A crisp, minimalist, flat design vector illustration. This icon combines a bar chart and a dot. A crisp, minimalist, flat design vector illustration. This icon combines a bar chart and a dot plot, showing a positive growth trend despite small fluctuations.
Free with trial AI-generated dot plot chart dashboard overlay for business design use. Created using generative AI. Design dot plot illustrations AI-generated business dot plot chart overlay. AI-generated dot plot chart dashboard overlay for business design use. Created using generative AI. AI-generated dot plot chart dashboard overlay for business design use. Created using generative AI.
Free with trial Dive into a captivating world of data representation. This surreal infographic showcases an innovative approach to visualizing complex information. Imagine 3D bar charts sculpted from ethereal, glowing blocks, or a mesmerizing dot plot dancing across a dreamlike landscape. Trend lines weave through a vibrant tapestry of colors, while pyramid charts ascend towards a boundless sky. Circular pie. Design dot plot illustrations Explore a Dreamlike Data Visualization Surreal Charts and Diagrams in 3D Block Dot Plot Trend Pyramid and Pie. Dive into a captivating world of data. Dive into a captivating world of data representation. This surreal infographic showcases an innovative approach to visualizing complex information. Imagine 3D bar charts sculpted from ethereal, glowing blocks, or a mesmerizing dot plot dancing across a dreamlike landscape. Trend lines weave through a vibrant tapestry of colors, while pyramid charts ascend towards a boundless sky. Circular pie
Free with trial Dot plot graph line icon. Halftone dotted pattern. Gradient icon with grain shadow. Presentation chart sign. Market analytics symbol. Line dot plot icon. Various designs. Vector. Design dot plot vectors Dot plot graph line icon. Presentation chart sign. Halftone dotted pattern. Vector. Dot plot graph line icon. Halftone dotted pattern. Gradient icon with grain. Dot plot graph line icon. Halftone dotted pattern. Gradient icon with grain shadow. Presentation chart sign. Market analytics symbol. Line dot plot icon. Various designs. Vector
Free with trial A clean and minimalist digital illustration of a dot plot graph, displaying various colored data points along a horizontal axis ranging from zero to one hundred. The visual representation is ideal for business reports, financial analysis, educational materials, and scientific data visualization projects requiring a clear, simple chart design. Created AI. Design dot plot illustrations A colorful dot plot graph showing statistical data points on white background. A clean and minimalist digital illustration of a dot plot graph, displaying. A clean and minimalist digital illustration of a dot plot graph, displaying various colored data points along a horizontal axis ranging from zero to one hundred. The visual representation is ideal for business reports, financial analysis, educational materials, and scientific data visualization projects requiring a clear, simple chart design.Created AI
Free with trial Minimalist Outline Scatter Plot Graph Data Analytics Coordinate Chart Icon Sign. Design dot plot illustrations A clean and simple black outline icon representing a scatter plot chart with dot data points on coordinate axes. Minimalist Outline Scatter Plot Graph Data. Minimalist Outline Scatter Plot Graph Data Analytics Coordinate Chart Icon Sign
Free with trial Enhance your creative projects with this detailed snowflake laser cut vector illustration featuring a clean geometric dot pattern suitable for CNC routing, metal fabrication, and wood engraving. This versatile template is perfect for creating decorative room dividers, privacy screens, and festive holiday decor with a professional finish. Buyers will benefit from the precision-engineered layout that minimizes material waste while providing a sophisticated modern aesthetic. Ideal for architects and DIY enthusiasts, this user-friendly design is optimized for various manufacturing processes including waterjet and plasma cutting. Design dot plot vectors Perforated snowflake pattern laser cut vector design for CNC metal sheet cutting or decorative wood carving stencil template. Enhance your creative projects. Enhance your creative projects with this detailed snowflake laser cut vector illustration featuring a clean geometric dot pattern suitable for CNC routing, metal fabrication, and wood engraving. This versatile template is perfect for creating decorative room dividers, privacy screens, and festive holiday decor with a professional finish. Buyers will benefit from the precision-engineered layout that minimizes material waste while providing a sophisticated modern aesthetic. Ideal for architects and DIY enthusiasts, this user-friendly design is optimized for various manufacturing processes including waterjet and plasma cutting.
Free with trial An icon representing a scatter plot diagram, conveying data analysis and statistical information. Simple, clean outline design for versatility. Design dot plot vectors Simple Outline Scatter Plot Statistic Diagram Data Chart Icon. An icon representing a scatter plot diagram, conveying data analysis and statistical information. An icon representing a scatter plot diagram, conveying data analysis and statistical information. Simple, clean outline design for versatility.
Free with trial A modern, flat design vector illustration of a scatter plot chart. The graph features a grid on a blue background with X and Y axes, visualizing data points for four distinct, color-coded categories: A, B, C, and D. A clear legend identifies each category. This versatile graphic is perfect for business presentations, statistical reports, data analysis infographics, market research, customer segmentation, and educational materials, representing concepts like correlation, distribution, and analysis. Design dot plot illustrations Categorical Data Scatter Plot for Business Analysis. A modern, flat design vector illustration of a scatter plot chart. The graph features a grid on a blue. A modern, flat design vector illustration of a scatter plot chart. The graph features a grid on a blue background with X and Y axes, visualizing data points for four distinct, color-coded categories: A, B, C, and D. A clear legend identifies each category. This versatile graphic is perfect for business presentations, statistical reports, data analysis infographics, market research, customer segmentation, and educational materials, representing concepts like correlation, distribution, and analysis.
Free with trial A magnifying glass focuses on a digital scatter plot featuring densely packed, multicolored dots shifting from blue to orange hues. Within the lens is a red dot labeled "4. 3508," magnifying details beneath. The numerical annotation indicates data analysis or visualization, with a grid overlay adding structure to the distribution. The vibrant color gradient suggests variability or measurement intensity across the dataset, often utilized in scientific, statistical, or AI-generated data representations. Design dot plot illustrations Glass focuses on a digital scatter plot featuring densely packed, multicolo. A magnifying glass focuses on a digital scatter plot featuring densely packed. A magnifying glass focuses on a digital scatter plot featuring densely packed, multicolored dots shifting from blue to orange hues. Within the lens is a red dot labeled "4.3508," magnifying details beneath. The numerical annotation indicates data analysis or visualization, with a grid overlay adding structure to the distribution. The vibrant color gradient suggests variability or measurement intensity across the dataset, often utilized in scientific, statistical, or AI-generated data representations.
Free with trial Concentric dot cluster. Dense bubble pattern. Circular Vector design. Minimal swirl emblem. EPS 10. Design dot plot vectors Concentric dot cluster. Dense bubble pattern. Circular Vector design. Minimal swirl emblem. EPS 10
Free with trial A simple and clean illustration of a scatter plot featuring a basic axis and several data points represented by black dots. This minimalist design is perfect for various data visualization and statistical representation needs. Design dot plot vectors Minimalist Outlined Scatter Plot with Black Dots and Axis Shape Icon. A simple and clean illustration of a scatter plot featuring a basic axis and several data. A simple and clean illustration of a scatter plot featuring a basic axis and several data points represented by black dots. This minimalist design is perfect for various data visualization and statistical representation needs.
Free with trial Scatter plot vector graphic for data visualization and analysis illustration. Statistical data points icon for graphic design projects data analytics. Design dot plot vectors Scatter Plot Illustration Data Visualization Statistical Analysis Icon Graphic. Scatter plot vector graphic for data visualization and analysis illustration. Scatter plot vector graphic for data visualization and analysis illustration. Statistical data points icon for graphic design projects data analytics
Free with trial A bright and modern flat design vector illustration featuring a combined bar and line graph with data points (dot plot). Design dot plot vectors Combined Data Visualization Icon of Bar Chart and Line Graph with Dots. A bright and modern flat design vector illustration featuring a combined bar and line. A bright and modern flat design vector illustration featuring a combined bar and line graph with data points (dot plot).
Free with trial A page from "The Human Genome Project" displaying a dot matrix plot of nucleotides. Horizontal and vertical axes represent sequences, while dots signify matching nucleotides. This visualization reveals sequence alignment and repetitive elements, essential for genetic research and analysis. It highlights the complexity of genomic relationships and aids in understanding genetic patterns. Design dot plot vectors A page from 'The Human Genome Project' displaying a dot matrix plot of nucleotides. Horizontal and vertical axes represent sequences, while dots signify. A page from "The Human Genome Project" displaying a dot matrix plot of nucleotides. Horizontal and vertical axes represent sequences, while dots signify matching nucleotides. This visualization reveals sequence alignment and repetitive elements, essential for genetic research and analysis. It highlights the complexity of genomic relationships and aids in understanding genetic patterns.
Free with trial Scatter plot and flow diagram 2D cartoon objects set. Multiple pathways flowchart. Diagonal axis with x marks. Analytics isolated elements flat vector clip arts on white. Spot illustrations collection. Design dot plot vectors Scatter plot and flow diagram 2D cartoon objects set. Multiple pathways flowchart. Diagonal axis with x marks. Analytics isolated elements flat vector clip
Free with trial Minimalist Outline Scatter Plot Axis Chart Statistical Data Visualization Icon. Design dot plot illustrations A black outline icon representing a scatter plot chart with data points on horizontal and vertical axes. Minimalist Outline Scatter Plot Axis Chart Statistical. Minimalist Outline Scatter Plot Axis Chart Statistical Data Visualization Icon
Free with trial Scatter plot and flow diagram 2D line objects set. Pathways flowchart. Diagonal axis with x marks. Analytics isolated cliparts vector ink outline items. Monochrome spot illustrations collection. Design dot plot vectors Scatter plot and flow diagram 2D line objects set. Pathways flowchart. Diagonal axis with x marks. Analytics isolated cliparts vector ink outline items
Free with trial Original flat of a pictogram dot matrix infographic designed for technology presentations, reports and dashboards. Clean minimal style with solid colors and fully editable shapes. Design dot plot vectors Technology pictogram dot matrix infographic template, flat technology data visualization with solid colors, modern minimal. Original flat of a pictogram dot. Original flat of a pictogram dot matrix infographic designed for technology presentations, reports and dashboards. Clean minimal style with solid colors and fully editable shapes
Free with trial Simple Scatter Plot Graph with Positive Correlation and Axes Outline Icon. Design dot plot vectors A simple, clean icon representing a scatter plot graph with a clear positive correlation trend shown by multiple dots. The graph. Simple Scatter Plot Graph with. Simple Scatter Plot Graph with Positive Correlation and Axes Outline Icon
Free with trial Simple Black and White Scatter Plot Graph Icon Representation. Design dot plot vectors A minimalistic black and white scatter plot graph icon is depicted, showcasing individual data points distributed across a simple. Simple Black and White Scatter. Simple Black and White Scatter Plot Graph Icon Representation
Free with trial This image showcases a collection of abstract visualizations composed of dot grids forming various geometric and wave patterns. Each pattern demonstrates different mathematical concepts, including topological transformations, sinusoidal waves, and complex 3D surface projections. The visualizations appear to be created through a process of plotting points in a structured manner to give a sense of. Design dot plot illustrations Abstract geometric and wave pattern visualizations using dot grids. This image showcases a collection of abstract visualizations composed of dot grids forming. This image showcases a collection of abstract visualizations composed of dot grids forming various geometric and wave patterns. Each pattern demonstrates different mathematical concepts, including topological transformations, sinusoidal waves, and complex 3D surface projections. The visualizations appear to be created through a process of plotting points in a structured manner to give a sense of
Free with trial Blue verification scribble hand drawn design. Vector illustration. Design dot plot vectors Blue verification scribble hand drawn design. Vector illustration
Free with trial Scatter Plot Line Icon, Outline Symbol for Data Distribution, Statistical Correlation, Variable Research, Scientific Analysis, and Pattern Visualization. Vector Sign Icon. Design dot plot vectors Scatter Plot Line Icon, Outline Symbol for Data Distribution, Statistical Correlation, Variable Research, Scientific Analysis, and. Pattern Visualization
Free with trial Blue verification scribble hand drawn design. Vector illustration. Design dot plot vectors Blue verification scribble hand drawn design. Vector illustration
Free with trial An illustration of a couple in love holding a cute red polka dot heart in their hands. Design dot plot illustrations An illustration of a couple in love holding a cute red polka dot heart in their hands. An illustration of a couple in love holding a cute red polka dot heart in
Free with trial Scatter plot with X-axis ranging from 0 to 240 and Y-axis from -10 to 100. Data points are scattered irregularly, shown as small blue and green dots. Each dot represents a data pair positioned on a grid. Gridlines divide the plot into smaller sections for easy reference. The background is plain white, providing a clear view of the chart and emphasizing the contrast between the plotted data points and the axes. Design dot plot illustrations Are scattered irregularly, shown as small blue and green dots. Scatter plot with X-axis ranging from 0 to 240 and Y-axis from -10 to 100. Data points are. Scatter plot with X-axis ranging from 0 to 240 and Y-axis from -10 to 100. Data points are scattered irregularly, shown as small blue and green dots. Each dot represents a data pair positioned on a grid. Gridlines divide the plot into smaller sections for easy reference. The background is plain white, providing a clear view of the chart and emphasizing the contrast between the plotted data points and the axes.
Free with trial Dot clusters icon in a clean two-tone blue flat vector style, representing dot clusters for data and analytics. Suitable for analytics dashboards, business reports, data presentations and infographics. Its simple, recognizable design works well in user interfaces, web graphics, presentations and infographic layouts. Design dot plot vectors Dot clusters icon, blue flat vector illustration for data and analytics. Dot clusters icon in a clean two-tone blue flat vector style, representing dot clusters. Dot clusters icon in a clean two-tone blue flat vector style, representing dot clusters for data and analytics. Suitable for analytics dashboards, business reports, data presentations and infographics. Its simple, recognizable design works well in user interfaces, web graphics, presentations and infographic layouts.
Free with trial Dot matrix chart icon in a clean two-tone blue flat vector style, representing dot matrix chart for data and analytics. Suitable for analytics dashboards, business reports, data presentations and infographics. Its simple, recognizable design works well in user interfaces, web graphics, presentations and infographic layouts. Design dot plot vectors Dot matrix chart icon, blue flat vector illustration for data and analytics. Dot matrix chart icon in a clean two-tone blue flat vector style, representing dot. Dot matrix chart icon in a clean two-tone blue flat vector style, representing dot matrix chart for data and analytics. Suitable for analytics dashboards, business reports, data presentations and infographics. Its simple, recognizable design works well in user interfaces, web graphics, presentations and infographic layouts.
Free with trial Dumbbell dot plot chart showing before and after values for seven items with connecting bars, gap labels and a legend in navy and gold. Design dot plot vectors Dumbbell Chart Infographic Comparing Before and After Values - Navy and Gold Vector. Dumbbell dot plot chart showing before and after values for seven items with. Dumbbell dot plot chart showing before and after values for seven items with connecting bars, gap labels and a legend in navy and gold
Free with trial Modern flat illustration of hyperbola axis icon with gradient of purple, pink, orange. Design features minimalist clean aesthetic with simple white background. Graphic represents. Design dot plot illustrations Modern flat illustration of hyperbola axis icon with gradient of purple, pink, orange. Design features minimalist, clean. Modern flat illustration of hyperbola. Modern flat illustration of hyperbola axis icon with gradient of purple, pink, orange. Design features minimalist clean aesthetic with simple white background. Graphic represents.
Free with trial Illustration shows scatter plot graph with colorful dots forming a gradient from orange to blue. Analyzes data points and trend. Lines on a grid. AI generated. Design dot plot illustrations Illustration shows scatter plot graph with colorful dots forming a gradient from orange to blue. Analyzes data points and trend. Lines on a grid. AI generated
Free with trial Swipe up, Update data and Electronic thermometer line icons pack. 3d design elements. Trade chart, Puzzle, Journey path web icon. Mindfulness stress, Inspect, Chemistry lab pictogram. Vector. Design dot plot illustrations Swipe up, Update data and Electronic thermometer line icons pack. For web app. 3d design elements. Vector. Swipe up, Update data and Electronic thermometer line. Swipe up, Update data and Electronic thermometer line icons pack. 3d design elements. Trade chart, Puzzle, Journey path web icon. Mindfulness stress, Inspect, Chemistry lab pictogram. Vector
Free with trial Set of Diesel, Smile and Head line icons for web app. Design elements, Social media icons. Remove purchase, Reject, Online market icons. Face id, Medical syringe, Voicemail signs. Vector. Design dot plot vectors Set of Diesel, Smile and Head line icons for web app. Pictogram icon. Design elements, Social media icons. Vector. Set of Diesel, Smile and Head line icons for. Set of Diesel, Smile and Head line icons for web app. Design elements, Social media icons. Remove purchase, Reject, Online market icons. Face id, Medical syringe, Voicemail signs. Vector
Free with trial Checklist, Card and Coins bags line icons pack. 3d design elements. Bar diagram, Pos terminal, Dollar rate web icon. Mobile finance, Money calendar, Loyalty star pictogram. Vector. Design dot plot vectors Checklist, Card and Coins bags line icons pack. For web app. 3d design elements. Vector. Checklist, Card and Coins bags line icons pack. 3d design elements. Bar. Checklist, Card and Coins bags line icons pack. 3d design elements. Bar diagram, Pos terminal, Dollar rate web icon. Mobile finance, Money calendar, Loyalty star pictogram. Vector
Free with trial Dotted line circle frame vector. Dashed outline design of border. Icon of cut circle frame. Vector illustration. Dash line circle. Design dot plot vectors Dotted line circle frame vector. Dashed outline design of border. Icon of cut circle frame. Vector illustration. Dash line circle
Free with trial Dotted line circle frame vector. Dashed outline design of border. Icon of cut circle frame. Vector illustration. Dash line circle. Design dot plot vectors Dotted line circle frame vector. Dashed outline design of border. Icon of cut circle frame. Vector illustration. Dash line circle
Free with trial Dotted line circle frame vector. Dashed outline design of border. Icon of cut circle frame. Vector illustration. Dash line circle. Design dot plot vectors Dotted line circle frame vector. Dashed outline design of border. Icon of cut circle frame. Vector illustration. Dash line circle
Free with trial Dotted line circle frame vector. Dashed outline design of border. Icon of cut circle frame. Vector illustration. Dash line circle. Design dot plot vectors Dotted line circle frame vector. Dashed outline design of border. Icon of cut circle frame. Vector illustration. Dash line circle
Free with trial Dotted line circle frame vector. Dashed outline design of border. Icon of cut circle frame. Vector illustration. Dash line circle. Design dot plot vectors Dotted line circle frame vector. Dashed outline design of border. Icon of cut circle frame. Vector illustration. Dash line circle
Free with trial Dotted line circle frame vector. Dashed outline design of border. Icon of cut circle frame. Vector illustration. Dash line circle. Design dot plot vectors Dotted line circle frame vector. Dashed outline design of border. Icon of cut circle frame. Vector illustration. Dash line circle
Free with trial Dotted line circle frame vector. Dashed outline design of border. Icon of cut circle frame. Vector illustration. Dash line circle. Design dot plot vectors Dotted line circle frame vector. Dashed outline design of border. Icon of cut circle frame. Vector illustration. Dash line circle
Free with trial Dotted line circle frame vector. Dashed outline design of border. Icon of cut circle frame. Vector illustration. Dash line circle. Design dot plot vectors Dotted line circle frame vector. Dashed outline design of border. Icon of cut circle frame. Vector illustration. Dash line circle
 Sign in