Free with trial Money loss and economic crisis, money market crash and global financial downturn, vector line icons. Economic crisis icons of bankruptcy, price decrease with money inflation and unemployment growth. Diagram financial growth decrease vectors Money loss and economic crisis, money market crash
Free with trial Financial graph, Business concept, Price increase, Price decrease. Diagram financial growth decrease vectors Financial graph, Business concept, Price increase, Price decrease
Free with trial A clean, minimalist icon representing an analytics graph. It features a series of vertical bars of varying heights, symbolizing data or trends. A line graph with circular data points connects the tops of some of the bars, illustrating growth, progress, or fluctuations over time. This graphic is ideal for representing business intelligence, financial data, research, or any concept related to data analysis and performance. Diagram financial growth decrease vectors Analytics Graph Icon with Data Points. A clean, minimalist icon representing an analytics graph. It features a series of vertical bars of varying heights, symbolizing data or trends. A line graph with circular data points connects the tops of some of the bars, illustrating growth, progress, or fluctuations over time. This graphic is ideal for representing business intelligence, financial data, research, or any concept related to data analysis and performance.
Free with trial Detailed illustration featuring a variety of hand drawn style financial charts and data analysis line icons including growth curves and market trends. Diagram financial growth decrease vectors Collection of business data and financial analytics line icons. detailed illustration featuring a variety of hand drawn style financial charts and data analysis line icons including growth curves and market trends
Free with trial A vibrant infographic illustrating business growth, financial analysis, and data visualization with charts, graphs, and icons. Diagram financial growth decrease vectors Infographic of Business Growth and Financial Analysis with Charts and Icons. A vibrant infographic illustrating business growth, financial analysis, and data visualization with charts, graphs, and icons
Free with trial This is an detailed collection of financial growth charts and market volatility icons in a clean minimal style. Diagram financial growth decrease vectors Financial line icons showing stock market trends with bull and bear symbols. This is an detailed collection of financial growth charts and market volatility icons in a clean minimal style
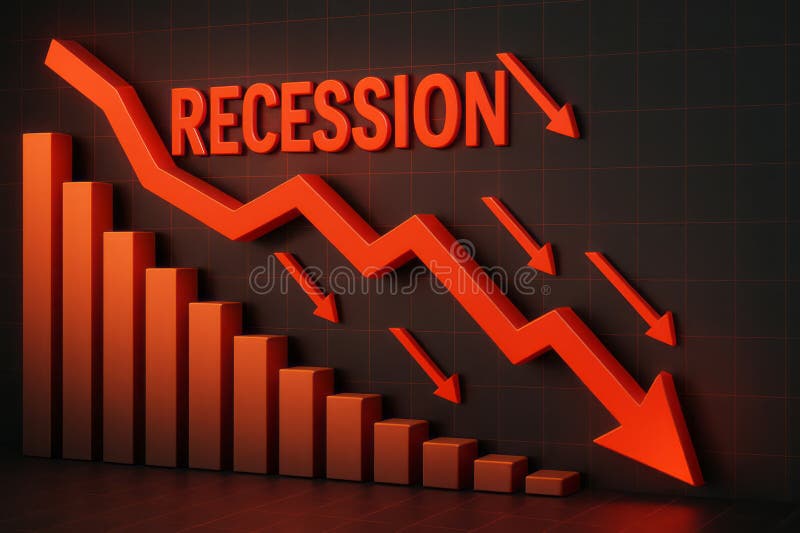
Free with trial This image visually represents an economic recession through downward trends and statistics. The vibrant red arrows emphasize the significant decline in growth, making it an impactful visual for financial analysis. Diagram financial growth decrease illustrations Dramatic Decline in Economic Growth with Recession Indicator and Downward Arrows in Red. This image visually represents an economic recession through downward trends and statistics. The vibrant red arrows emphasize the significant decline in growth, making it an impactful visual for financial analysis
Free with trial Wooden blocks and spheres displaying percentage signs represent financial concepts such as discounts sales interest rates investments savings loans mortgages banking economy market growth return prof. Diagram financial growth decrease illustrations Percentage discount sale promotion offer finance interest rate investment savings loan mortgage banking economy market growth retu. Wooden blocks and spheres displaying percentage signs represent financial concepts such as discounts sales interest rates investments savings loans mortgages banking economy market growth return prof
Free with trial Percentage symbol displayed on a wooden block represents financial concepts such as discounts sales interest rates savings investments profit margins and economic growth applicable for business prese. Diagram financial growth decrease illustrations Percentage discount sale offer promotion finance interest rate savings investment earnings profit margin growth return value marke. Percentage symbol displayed on a wooden block represents financial concepts such as discounts sales interest rates savings investments profit margins and economic growth applicable for business prese
Free with trial Person analyzes growth chart, market trends, financial data, stock exchange, investment portfolio,Generative AI. Diagram financial growth decrease illustrations Business person analyzes growth charts, market trends, and financial data on an interactive screen. Person analyzes growth chart, market trends, financial data, stock exchange, investment portfolio,Generative AI
Free with trial Businessman falls from a stack of coins. Financial crisis. Decrease in capital. Diagram financial growth decrease vectors Businessman falls from a stack of coins. Financial crisis. Decrease in capital.
Free with trial Three coin stacks with dollar signs, showing growth, and a downward arrow indicating potential decline. Diagram financial growth decrease vectors A line drawing depicting three stacks of coins with dollar signs on top, showing financial growth. three coin stacks with dollar signs, showing growth, and a downward arrow indicating potential decline
Free with trial Ascending green chart indicates positive financial growth in stock market investment ,Generative ai. Diagram financial growth decrease illustrations Ascending green stock chart symbolizes positive financial growth and investment success in market. Ascending green chart indicates positive financial growth in stock market investment ,Generative ai
Free with trial Conceptual image showing a declining financial graph on a hand, symbolizing business economy crisis, investment loss, or market crash. It represents negative growth and economic downturn. Diagram financial growth decrease illustrations Declining financial graph on hand concept for business economy crisis or investment loss and market crash. conceptual image showing a declining financial graph on a hand, symbolizing business economy crisis, investment loss, or market crash. It represents negative growth and economic downturn.
Free with trial Business analytics icon depicting price fluctuations in economic market data, financial growth concept. Diagram financial growth decrease vectors Financial candlestick chart illustrating market trend for investment, stock trading data analysis. Isolated digital graphic. Business analytics icon depicting price fluctuations in economic market data, financial growth concept.
Free with trial A decreasing bar graph with a downward arrow and coin, symbolizing financial loss and economic decline. This image represents negative growth and market downturns. Diagram financial growth decrease vectors Vector art of decreasing bar graph with a downward arrow and coin, symbolizing financial loss and economic decline, , indicating. A decreasing bar graph with a downward arrow and coin, symbolizing financial loss and economic decline. This image represents negative growth and market downturns
Free with trial Business analytics, data visualization, market research, financial reports, and growth strategies are symbolized in this image. Elegant empty space crafted for branding, ads, and product presentations. Suitable for marketing campaigns and creative displays. . Generative AI. Diagram financial growth decrease illustrations Colorful Data Charts and Graphs on White Background Business analytics data visualization market research financial reports. Business analytics, data visualization, market research, financial reports, and growth strategies are symbolized in this image. Elegant empty space crafted for branding, ads, and product presentations. Suitable for marketing campaigns and creative displays. . Generative AI
Free with trial Blue stacked arrows illustrate financial growth, market trends. Graphic displays upward, downward movement, signifying progress, decline in business economy. Represents strategy,. Diagram financial growth decrease illustrations Blue stacked arrows illustrate financial growth, market trends. Graphic displays upward, downward movement, signifying progress
Free with trial This icon represents a financial transaction, showing money flow with arrows pointing both up and down, symbolizing the fluctuation of value in investments. Diagram financial growth decrease vectors Vector art of financial transaction icon, depicting money flow with arrows indicating both increase and decrease in value or. This icon represents a financial transaction, showing money flow with arrows pointing both up and down, symbolizing the fluctuation of value in investments
Free with trial Three red percentage symbols are shown with arrows pointing downward, representing a decline. Each symbol is positioned above words: "Economy," "Growth," and "Stocks," indicating a decrease in these areas. The arrows are bold and the symbols feature a glossy finish, emphasizing the visual concept of reduction or negative trend. The overall design highlights financial or economic themes. Diagram financial growth decrease illustrations Three red percentage symbols are shown with arrows pointing downward
Free with trial A 3D rendered illustration depicting business growth. The image showcases two upward-trending arrow charts, one in gold and the other in blue, representing positive trends, progress, and success. The charts are set against a clean, light background, emphasizing the upward movement and potential for financial gain. Suitable for illustrating economic growth, investment strategies, and business performance. Diagram financial growth decrease illustrations Growth Chart with Arrows. A 3D rendered illustration depicting business growth. The image showcases two upward-trending arrow charts, one in gold and the other in blue, representing positive trends, progress, and success. The charts are set against a clean, light background, emphasizing the upward movement and potential for financial gain. Suitable for illustrating economic growth, investment strategies, and business performance.
Free with trial A collection of hand-drawn, black and white icons representing growth, decline, and financial concepts. The set includes upward and downward arrows, percentage symbols, and a bar graph illustrating trends. The simple line art style makes these icons versatile for various applications, including presentations, infographics, and website design. They convey concepts of progress, success, loss, and market fluctuations. Diagram financial growth decrease illustrations Growth and Decline Icons Set. A collection of hand-drawn, black and white icons representing growth, decline, and financial concepts. The set includes upward and downward arrows, percentage symbols, and a bar graph illustrating trends. The simple line art style makes these icons versatile for various applications, including presentations, infographics, and website design. They convey concepts of progress, success, loss, and market fluctuations.
Free with trial A 3D illustration of a stack of silver dollar coins with an decrease and increase arrow graph, symbolizing financial growth and success, isolated, png, transparent, clipart, transparent background, cutout, cut-out. Diagram financial growth decrease vectors A 3D illustration of a stack of golden coins. A 3D illustration of a stack of silver dollar coins with an decrease and increase arrow graph, symbolizing financial growth and success, isolated, png, transparent, clipart, transparent background, cutout, cut-out
Free with trial A 3D illustration of a stack of golden dollar coins with an decrease and increase arrow graph, symbolizing financial growth and success, isolated, png, transparent, clipart, transparent background, cutout, cut-out. Diagram financial growth decrease vectors A 3D illustration of a stack of golden coins. A 3D illustration of a stack of golden dollar coins with an decrease and increase arrow graph, symbolizing financial growth and success, isolated, png, transparent, clipart, transparent background, cutout, cut-out
Free with trial Money loss and economic crisis, money market crash and global financial downturn, vector line icons. Economic crisis icons of bankruptcy, price decrease with money inflation and unemployment growth. Diagram financial growth decrease vectors Money loss and economic crisis, money market crash
Free with trial A modern flat design icon representing financial data analysis and market trends. This vector illustration features a combination of a green bar chart and a dark grey line graph, showing fluctuations in performance. An upward arrow indicates initial growth, followed by a volatile trend line symbolizing concepts like market instability, economic changes, profit and loss, or business analytics. This versatile graphic is perfect for infographics, financial reports, presentations, websites, and applications related to business, finance, statistics, and economics. Isolated on a white background for easy use. Diagram financial growth decrease vectors Financial Market Fluctuation Graph Icon. A modern flat design icon representing financial data analysis and market trends. This vector illustration features a combination of a green bar chart and a dark grey line graph, showing fluctuations in performance. An upward arrow indicates initial growth, followed by a volatile trend line symbolizing concepts like market instability, economic changes, profit and loss, or business analytics. This versatile graphic is perfect for infographics, financial reports, presentations, websites, and applications related to business, finance, statistics, and economics. Isolated on a white background for easy use.
Free with trial Economic crisis line icons of global financial downturn and business bankruptcy, vector banner. Money loss and banking crisis icons of depreciation, unemployment and price decrease of pandemic crisis. Diagram financial growth decrease vectors Economic crisis icons of global financial downturn. Economic crisis line icons of global financial downturn and business bankruptcy, vector banner. Money loss and banking crisis icons of depreciation, unemployment and price decrease of pandemic crisis
Free with trial This minimalist vector illustration features two identical line graphs, presented in contrasting black and white themes. The left graph displays a black line on a white background, while the right shows a white line on a black background. Both graphs depict a clear downward trend with jagged fluctuations, symbolizing decline, loss, or negative growth over time. This versatile icon set is ideal for illustrating concepts such as economic downturns, financial losses, market crashes, business failures, or any data showing a significant decrease. Perfect for presentations, reports, infographics, and web design. Diagram financial growth decrease vectors Declining Line Graph Icon Set - Black and White. This minimalist vector illustration features two identical line graphs, presented in contrasting black and white themes. The left graph displays a black line on a white background, while the right shows a white line on a black background. Both graphs depict a clear downward trend with jagged fluctuations, symbolizing decline, loss, or negative growth over time. This versatile icon set is ideal for illustrating concepts such as economic downturns, financial losses, market crashes, business failures, or any data showing a significant decrease. Perfect for presentations, reports, infographics, and web design.
Free with trial A 3D render illustrating the concept of financial decline and economic crisis. The image features a bar chart with progressively smaller bars and a prominent red arrow pointing downwards, signifying a sharp downturn. This visual metaphor represents a stock market crash, business failure, investment loss, or recession. The minimalist design on a yellow background is perfect for financial reports, business presentations, economic news articles, and web graphics discussing negative growth, losses, or bankruptcy. A small stack of coins reinforces the monetary theme. Diagram financial growth decrease illustrations 3D Financial Decline Graph with Downward Arrow. A 3D render illustrating the concept of financial decline and economic crisis. The image features a bar chart with progressively smaller bars and a prominent red arrow pointing downwards, signifying a sharp downturn. This visual metaphor represents a stock market crash, business failure, investment loss, or recession. The minimalist design on a yellow background is perfect for financial reports, business presentations, economic news articles, and web graphics discussing negative growth, losses, or bankruptcy. A small stack of coins reinforces the monetary theme.
Free with trial Business growth presentation with charts and graphs showing progress, statistics, and performance. The image showcases key financial indicators in a clear, concise format. Diagram financial growth decrease vectors Financial Data Analysis Report on Screen Display. Business growth presentation with charts and graphs showing progress, statistics, and performance. The image showcases key financial indicators in a clear, concise format.
Free with trial A collection of financial chart icons, showcasing data analysis and business growth concepts. The image features multiple variations of a line graph and bar chart combination, presented in both grayscale and beige color schemes. These icons are ideal for illustrating financial reports, business presentations, market trends, and data visualization projects. The clean, modern design makes them suitable for a wide range of applications. Diagram financial growth decrease vectors Financial Chart Icons: Business and Data Analysis. A collection of financial chart icons, showcasing data analysis and business growth concepts. The image features multiple variations of a line graph and bar chart combination, presented in both grayscale and beige color schemes. These icons are ideal for illustrating financial reports, business presentations, market trends, and data visualization projects. The clean, modern design makes them suitable for a wide range of applications.
Free with trial A vector illustration showing a magnifying glass focused on a bar graph and line chart indicating growth. The magnifying glass has a blue frame and red handle. The chart depicts an upward trend, suggesting positive business performance. This image is suitable for illustrating data analysis, business strategy, market research, and financial growth concepts. Diagram financial growth decrease vectors Analyzing Growth: Magnifying Glass on Business Chart. A vector illustration showing a magnifying glass focused on a bar graph and line chart indicating growth. The magnifying glass has a blue frame and red handle. The chart depicts an upward trend, suggesting positive business performance. This image is suitable for illustrating data analysis, business strategy, market research, and financial growth concepts.
Free with trial A futuristic concept of financial trading and data analysis. A glowing holographic stock market chart, with candlesticks and graphs, is projected onto a modern office desk. The scene includes a laptop and coffee, set against a large window with a blurry night city skyline. This image represents concepts like fintech, investment, big data, economic growth, and innovative business technology. Ideal for illustrating topics on digital finance, stock exchange, forex trading, and corporate strategy in a high-tech world. Diagram financial growth decrease illustrations Futuristic Financial Trading Hologram on Office Desk. A futuristic concept of financial trading and data analysis. A glowing holographic stock market chart, with candlesticks and graphs, is projected onto a modern office desk. The scene includes a laptop and coffee, set against a large window with a blurry night city skyline. This image represents concepts like fintech, investment, big data, economic growth, and innovative business technology. Ideal for illustrating topics on digital finance, stock exchange, forex trading, and corporate strategy in a high-tech world.
Free with trial A symbolic illustration of a person with a downward-pointing arrow, representing decline, reduction, or negative trends. Ideal for financial reports, statistical analyses, or problem identification. This visual effectively communicates a downturn or decrease in various metrics. vector design Generative AI. Diagram financial growth decrease vectors Person with Down Arrow, Decline, Downtrend & Reduced Growth, vector design Generative AI. A symbolic illustration of a person with a downward-pointing arrow, representing decline, reduction, or negative trends. Ideal for financial reports, statistical analyses, or problem identification. This visual effectively communicates a downturn or decrease in various metrics. vector design Generative AI
Free with trial This image displays a dynamic business analytics dashboard featuring both bar and line graphs. The bar chart illustrates varying percentages (15%, 50%, 75%, 85%), suggesting performance metrics or growth stages. The line chart, with its intersecting blue lines and data points, represents trends, fluctuations, and comparisons over time or across different categories. The clean, modern design makes it ideal for financial reports, business presentations, and data visualization concepts. Diagram financial growth decrease illustrations Business Growth and Performance Analysis with Bar and Line Charts. This image displays a dynamic business analytics dashboard featuring both bar and line graphs. The bar chart illustrates varying percentages (15%, 50%, 75%, 85%), suggesting performance metrics or growth stages. The line chart, with its intersecting blue lines and data points, represents trends, fluctuations, and comparisons over time or across different categories. The clean, modern design makes it ideal for financial reports, business presentations, and data visualization concepts.
Free with trial A clean and modern set of financial icons, perfect for illustrating business concepts. The image features icons representing profit growth, expense management, tax documents, and investment summaries. The illustrations use a simple, flat design with a limited color palette, making them versatile for various applications. Ideal for presentations, websites, infographics, and financial reports. The set highlights key financial aspects in an easily understandable visual format. Diagram financial growth decrease illustrations Financial Icons Set: Profit, Expenses, Tax, and Investment Analysis. A clean and modern set of financial icons, perfect for illustrating business concepts. The image features icons representing profit growth, expense management, tax documents, and investment summaries. The illustrations use a simple, flat design with a limited color palette, making them versatile for various applications. Ideal for presentations, websites, infographics, and financial reports. The set highlights key financial aspects in an easily understandable visual format.
Free with trial Interest growth icon Black line art vector in black and white outline set collection sign. Diagram financial growth decrease vectors Financial Icon Illustrating Growth, Investment Success, and Economic Prosperity. Interest growth icon Black line art vector in black and white outline set collection sign
Free with trial Modern rendered line graph with yellow marker points rising and falling vertically, forming a white trend line that fluctuates across the screen. The graph represents business data such as growth, decrease, profit, and market performance. Set against a blurred office background, the image has a clean, digital aesthetic ideal for financial presentations, company reports, startup pitches, and data analysis. This visual is suitable for showcasing trading performance, corporate strategy, and economic trends. Diagram financial growth decrease illustrations Business Trend Line Graph Showing Growth and Market Fluctuations. Modern rendered line graph with yellow marker points rising and falling vertically, forming a white trend line that fluctuates across the screen. The graph represents business data such as growth, decrease, profit, and market performance. Set against a blurred office background, the image has a clean, digital aesthetic ideal for financial presentations, company reports, startup pitches, and data analysis. This visual is suitable for showcasing trading performance, corporate strategy, and economic trends.
Free with trial A collection of financial icons in vector format. The transparent background is valuable for designers. Diagram financial growth decrease vectors Financial Increase and Decrease Icons Vector Illustration on transparent background. A collection of financial icons in vector format. The transparent background is valuable for designers
Free with trial Red stock market investment decline chart. Downward arrow. Negative growth concept, business development, declining profits. Analytical financial chart. Trend. Changes in exchange rates, interest rates. Diagram financial growth decrease vectors Red stock market investment decline chart. Downward arrow. Negative growth concept, business development, declining profits.
Free with trial Colorful growth chart with red and teal bars showing upward and downward arrows on a light background representing data trends progress decline business performance and financial analytics visual. Diagram financial growth decrease illustrations Colorful growth chart with red and teal bars and upward and downward arrows on light background. colorful growth chart with red and teal bars showing upward and downward arrows on a light background representing data trends progress decline business performance and financial analytics visual
Free with trial Wooden blocks display sad and happy faces topped with increasing stacks of coins illustrating financial growth and investment success representing a visual metaphor for economic progress and the jour. Diagram financial growth decrease illustrations Wooden blocks with sad and happy faces showing financial growth with stacked coins. Wooden blocks display sad and happy faces topped with increasing stacks of coins illustrating financial growth and investment success representing a visual metaphor for economic progress and the jour
Free with trial Colorful growth chart featuring orange and teal bars with upward and downward arrows on a clean white background representing progress decline business data trends and financial performance metrics. Diagram financial growth decrease illustrations Colorful growth chart with orange and teal bars and upward and downward arrows on white background. colorful growth chart featuring orange and teal bars with upward and downward arrows on a clean white background representing progress decline business data trends and financial performance metrics
Free with trial A financial chart displaying market analysis and business growth with increasing and decreasing trends. Diagram financial growth decrease illustrations Financial chart showing growth and market analysis data isolated on transparent background. A financial chart displaying market analysis and business growth with increasing and decreasing trends.
Free with trial Business Analytics And Data Visualization Line Icon Set. Financial Growth, Market Trends, And Performance Analysis Outline Symbol Collection. Editable Stroke. Isolated Vector Illustration. Diagram financial growth decrease vectors Business Analytics And Data Visualization Line Icon Set. Financial Growth, Market Trends, And Performance Analysis
Free with trial Bar chart with illuminated bars showing an upward trend, depicted against a blurred cityscape at night. Bars increase in height from left to right, symbolizing growth. The glowing blue bars stand out against the dark background, visually representing a bullish financial trend. Various structures and faint lights in the defocused cityscape add context, highlighting the analytical and financial theme. Diagram financial growth decrease illustrations Dynamic stock market chart showing bullish trend after downturn for financial analysis reports and presentations. Bar chart with illuminated bars showing an upward trend, depicted against a blurred cityscape at night. Bars increase in height from left to right, symbolizing growth. The glowing blue bars stand out against the dark background, visually representing a bullish financial trend. Various structures and faint lights in the defocused cityscape add context, highlighting the analytical and financial theme.
Free with trial Illustration of a graph showing the growth of the indian rupee in the stock market. the image represents investment, financial analysis and currency exchange rates in the indian economy. the graph shows an upward trend. Diagram financial growth decrease illustrations Indian rupee stock market investment graph chart financial growth and currency exchange rate analysis. illustration of a graph showing the growth of the indian rupee in the stock market. the image represents investment, financial analysis and currency exchange rates in the indian economy. the graph shows an upward trend.
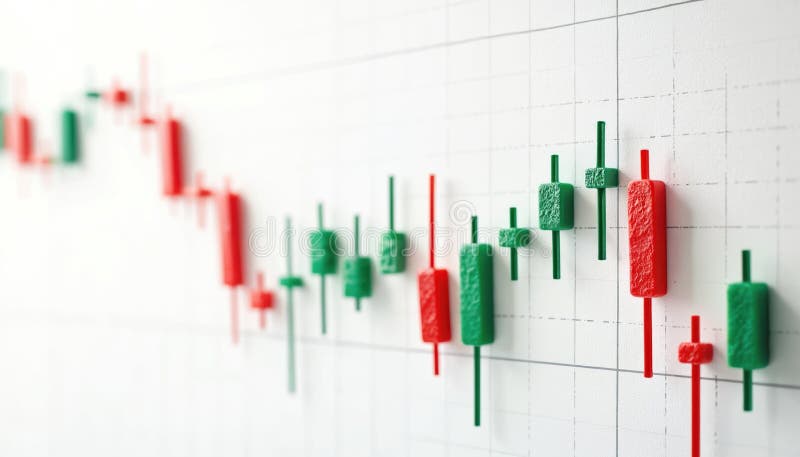
Free with trial Candlestick chart shows stock market fluctuations. Green candles show price increase, red candles pointing price decrease. Financial diagram of investment chart shows up down trends. Diagram financial growth decrease illustrations Candlestick chart shows stock market fluctuations. Green candles show price increase, red candles pointing price decrease.
Free with trial Set Digital speed meter Location Delivery tracking Graph chart diagram Hierarchy organogram Infographic element and Financial growth decrease icon. Vector. Diagram financial growth decrease illustrations Set Digital speed meter, Location, Delivery tracking, Graph, chart, diagram, Hierarchy organogram, Infographic element. Set Digital speed meter Location Delivery tracking Graph chart diagram Hierarchy organogram Infographic element and Financial growth decrease icon. Vector.
Free with trial Two hands cradle glowing symbols. On the left, a percentage sign emanates warmth and light, while the right hand holds an upward-trending graph, symbolizing growth. Tiny, shimmering particles float between them, suggesting the exchange of financial concepts. Created ai. Diagram financial growth decrease illustrations Boost your business success with strategic financial growth and rising interest rates now with this dynamic composition. Two hands cradle glowing symbols. On the left, a percentage sign emanates warmth and light, while the right hand holds an upward-trending graph, symbolizing growth. Tiny, shimmering particles float between them, suggesting the exchange of financial concepts. Created ai
Free with trial Businessperson analyzes financial data on digital tablet. Growth chart, cost reduction strategies displayed on screen. Project management business strategy key concepts. Effective. Diagram financial growth decrease illustrations Businessperson analyzes financial data on digital tablet. Growth chart, cost reduction strategies displayed on screen. Project
Free with trial Red arrow graph indicates stock market decline, real estate downturn, financial loss. 3d illustration visualizes business concept of negative progress, sale reduction, profit decrease. Diagram financial growth decrease illustrations Red arrow graph indicates stock market decline, real estate downturn, financial loss. 3d illustration visualizes business concept
Free with trial Global financial investment, Financial data Information for Trading and business investment, Stock market with candlestick on background. Business stock market visualization? Pie chart and graphs? Growth graph business inves background. Generative AI. Diagram financial growth decrease illustrations Business graph of income growth, timeline, arrows indicate the direction of the graph. Global financial investment, Financial data Information for Trading and business investment, Stock market with candlestick on background. Business stock market visualization ? Pie chart and graphs ? Growth graph business inves background. Generative AI
Free with trial Abstract blue green dotted financial graph chart sparkling background. Vector minimal tech design. Diagram financial growth decrease vectors Abstract dotted financial graph chart sparkling background. Abstract blue green dotted financial graph chart sparkling background. Vector minimal tech design
Free with trial Crisis finance graph down arrow business chart recession economy investment concept on red global inflation 3d background with loss financial stock price growth economic bankruptcy. Diagram financial growth decrease illustrations Crisis finance graph down arrow business chart recession economy investment concept on red global inflation 3d background with
Free with trial Financial bar chart with downward arrow indicating crisis. And market collapse. Diagram financial growth decrease vectors Financial bar chart with downward arrow indicating crisis. And market collapse
Free with trial Minimalist vector illustration showing a black diagram with a downward arrow symbolizing economic decline, financial loss, recession, or negative business performance. Clean and modern design isolated on a white background, ideal for business presentations, financial reports, infographics, websites, mobile apps, and marketing materials related to economics, finance, investment, and analytics. Diagram financial growth decrease vectors . Minimalist vector illustration showing a black diagram with a downward arrow symbolizing economic decline, financial loss, recession, or negative business performance. Clean and modern design isolated on a white background, ideal for business presentations, financial reports, infographics, websites, mobile apps, and marketing materials related to economics, finance, investment, and analytics.
Free with trial A professional vector set of business chart icons showing both growth and decline trends. Includes bar charts and line graphs with upward and downward arrows, representing profit, loss, performance rise, and financial downfall. Perfect for business presentations, reports, websites, infographics, and more. Fully editable EPS file for scalable design use. Diagram financial growth decrease vectors . A professional vector set of business chart icons showing both growth and decline trends. Includes bar charts and line graphs with upward and downward arrows, representing profit, loss, performance rise, and financial downfall. Perfect for business presentations, reports, websites, infographics, and more. Fully editable EPS file for scalable design use.
Free with trial Financial Loss : Financial loss represents a decrease in money or assets resulting from unsuccessful business activities. Diagram financial growth decrease vectors Financial Loss
Free with trial This striking graphic illustrates a significant economic downturn or market crash with a bold red arrow plunging downwards. Rendered by Ai, the image uses simple colors to maximize impact setting the alarming decline against subtle background charts. It effectively communicates concepts of loss decrease and a strong negative trend in business metrics. Diagram financial growth decrease illustrations Red arrow showing sharp financial market decline. This striking graphic illustrates a significant economic downturn or market crash with a bold red arrow plunging downwards. Rendered by Ai, the image uses simple colors to maximize impact setting the alarming decline against subtle background charts. It effectively communicates concepts of loss decrease and a strong negative trend in business metrics
Free with trial Decrease: Decrease represents a reduction in value, amount, or performance over time. Diagram financial growth decrease illustrations Illustration of Decrease. Decrease: Decrease represents a reduction in value, amount, or performance over time.
Free with trial Line graph illustrating data analysis and business statistics, charting financial growth, market changes, and performance metrics for visual information and infographic content. Diagram financial growth decrease illustrations Analyzing data with line graph showing business trends. Line graph illustrating data analysis and business statistics, charting financial growth, market changes, and performance metrics for visual information and infographic content
Free with trial Candlestick chart icons on a digital trading screen showing market movements, price trends and investment data for finance, stock analysis, trading strategy and economic growth. Diagram financial growth decrease illustrations Candlestick chart displaying financial market data analysis. Candlestick chart icons on a digital trading screen showing market movements, price trends and investment data for finance, stock analysis, trading strategy and economic growth
Free with trial A comprehensive set of vector line icons depicting bull and bear market trends. This collection features various combinations of bull and bear silhouettes integrated with financial charts, including rising and falling line graphs and bar graphs. Each icon clearly symbolizes either a bullish market (growth, upward trend) or a bearish market (decline, downward trend). Ideal for financial websites, trading applications, investment presentations, economic reports, infographics, and educational materials illustrating stock market dynamics and investment strategies. Diagram financial growth decrease vectors Bull and Bear Market Stock Trading Line Icons Set. A comprehensive set of vector line icons depicting bull and bear market trends. This collection features various combinations of bull and bear silhouettes integrated with financial charts, including rising and falling line graphs and bar graphs. Each icon clearly symbolizes either a bullish market (growth, upward trend) or a bearish market (decline, downward trend). Ideal for financial websites, trading applications, investment presentations, economic reports, infographics, and educational materials illustrating stock market dynamics and investment strategies.
Free with trial Decrease and increase chart icon with arrow. Negative and positive trend symbol illustration. Diagram financial growth decrease vectors Decrease and increase chart icon with arrow. Negative and positive trend symbol
Free with trial Uptrend and downtrend business chart icon vector. Economic growth and decline arrow symbol in black circle. Diagram financial growth decrease vectors Uptrend and downtrend business chart icon. Economic growth and decline arrow symbol in black circle
Free with trial The graph displays two lines, one green and one red. The green line is ascending, indicating growth or progress, while the red line is descending, suggesting a decline or decrease. Diagram financial growth decrease illustrations A graph with a green line and a red line. The graph displays two lines, one green and one red. The green line is ascending, indicating growth or progress, while the red line is descending, suggesting a decline or decrease
Free with trial A simple and clean line art icon of a graph, isolated on a white background. This vector illustration features a line chart with axes, showing a fluctuating trend with distinct data points. The minimalist design makes it perfect for various applications related to business, finance, and data analysis. Ideal for use in presentations, infographics, websites, mobile apps, and user interfaces to represent concepts like statistics, growth, market trends, performance reports, and financial analytics. A versatile symbol for progress and data visualization. Diagram financial growth decrease illustrations Analytics Line Graph Vector Icon. A simple and clean line art icon of a graph, isolated on a white background. This vector illustration features a line chart with axes, showing a fluctuating trend with distinct data points. The minimalist design makes it perfect for various applications related to business, finance, and data analysis. Ideal for use in presentations, infographics, websites, mobile apps, and user interfaces to represent concepts like statistics, growth, market trends, performance reports, and financial analytics. A versatile symbol for progress and data visualization.
Free with trial The image showcases a smartphone displaying financial data visualizations, including line graphs and bar charts. Additional icons and graphics related to data analysis and finance surround the phone, emphasizing the digital and analytical nature of the content. This composition was generated by AI,. Diagram financial growth decrease illustrations Mobile Financial Data. The image showcases a smartphone displaying financial data visualizations, including line graphs and bar charts. Additional icons and graphics related to data analysis and finance surround the phone, emphasizing the digital and analytical nature of the content. This composition was generated by AI,
Free with trial A simple and clean line graph icon illustration, perfect for illustrating financial data, growth charts, and statistical analysis. Ideal for use in presentations, reports, and websites. Diagram financial growth decrease vectors Minimalist Line Graph Icon Design for Financial Data Analysis Presentation. A simple and clean line graph icon illustration, perfect for illustrating financial data, growth charts, and statistical analysis. Ideal for use in presentations, reports, and websites.
Free with trial Abstract dotted financial graph chart sparkling background. Vector minimal tech design. Diagram financial growth decrease vectors Abstract dotted financial graph chart sparkling background
Free with trial Growth and decline chart icon in flat design. Business trend arrow symbol illustration. Profit and loss concept. Diagram financial growth decrease vectors Growth and decline chart icon in flat design. Business trend arrow symbol. Profit and loss concept
Free with trial Stock market chart displaying data and financial analysis. Green and red candles show trading on background. Investment indicators and performance trends. Diagram financial growth decrease illustrations Stock market chart data and financial analysis. Stock market chart displaying data and financial analysis. Green and red candles show trading on background. Investment indicators and performance trends
Free with trial A comprehensive collection of flat line design icons representing key concepts in business, finance, and data analytics. The set includes various charts (bar, line, pie), a speedometer, a magnifying glass with a graph, financial documents with checkmarks, a target with an arrow, a dollar sign, a percentage symbol, and directional arrows for growth and decline. These versatile vector elements are ideal for presentations, reports, websites, and applications focused on statistics, performance, strategy, and financial insights. Diagram financial growth decrease illustrations Business and Data Analytics Flat Line Icons Set. A comprehensive collection of flat line design icons representing key concepts in business, finance, and data analytics. The set includes various charts (bar, line, pie), a speedometer, a magnifying glass with a graph, financial documents with checkmarks, a target with an arrow, a dollar sign, a percentage symbol, and directional arrows for growth and decline. These versatile vector elements are ideal for presentations, reports, websites, and applications focused on statistics, performance, strategy, and financial insights.
Free with trial Illustration of a growing mobile application usage with a simple phone screen displaying a rising graph, a stylized touch hand, and a stream of download arrows. Vector flat icon design on a white background for a user adoption illustration --chaos 30 --ar 16:9 --v 7 Job ID: 938d3d73-bd25-4740-98fd-21a43555bec1. Diagram financial growth decrease illustrations Smartphone showing declining graph with arrows pointing down, concept of financial loss, data decrease. Illustration of a growing mobile application usage with a simple phone screen displaying a rising graph, a stylized touch hand, and a stream of download arrows. Vector flat icon design on a white background for a user adoption illustration --chaos 30 --ar 16:9 --v 7 Job ID: 938d3d73-bd25-4740-98fd-21a43555bec1
Free with trial Metal barrels of oil with green and red arrows. Showing rise and fall of gasoline prices. Fuel costs. Stock market investment. Economy growth or crisis recession. Diesel gallon trade. Vector concept. Diagram financial growth decrease vectors Metal barrels of oil with green and red arrows. Showing rise and fall of gasoline prices. Stock market investment. Economy growth. Metal barrels of oil with green and red arrows. Showing rise and fall of gasoline prices. Fuel costs. Stock market investment. Economy growth or crisis recession. Diesel gallon trade. Vector concept
Free with trial Percentage arrow. rate increase and decrease concept. Diagram financial growth decrease vectors Percentage arrow. rate increase and decrease concept.
Free with trial Data analytics dashboard illustrating a mix of line graphs, bar charts, and data summaries, representing business growth, financial trends, and statistical insights for market analysis. Diagram financial growth decrease vectors Data analytics dashboard showing business growth and decline. Data analytics dashboard illustrating a mix of line graphs, bar charts, and data summaries, representing business growth, financial trends, and statistical insights for market analysis
Free with trial A circular icon containing a stylized representation of financial data. The icon features a series of black vertical bars of varying heights, suggesting a bar chart. Overlaid on the bars are two thin lines, one black and one grey, depicting line graphs with peaks and troughs, indicating fluctuating trends. The overall design is minimalist and symbolic, suitable for representing business analytics. Diagram financial growth decrease illustrations Circular Graph Icon with Bar and Line Charts Representing Financial Data and Trends business. A circular icon containing a stylized representation of financial data. The icon features a series of black vertical bars of varying heights, suggesting a bar chart. Overlaid on the bars are two thin lines, one black and one grey, depicting line graphs with peaks and troughs, indicating fluctuating trends. The overall design is minimalist and symbolic, suitable for representing business analytics