Free with trial Bank building with a large red downward arrow representing financial decline, economic loss, or decreasing profits. Economy decrease illustrations Bank building with a large red downward arrow representing financial decline, economic loss, or decreasing profits.
Free with trial Worried businessman with financial graph showing sharp decline. Suitable for themes of crisis, loss, economic downturn, investment. Failure, and recession. Economy decrease vectors Worried businessman with financial graph showing sharp decline. Suitable for themes of crisis, loss, economic downturn, investment. Failure, and recession
Free with trial A businessman in a suit holds a digital display showing arrows and percentages, representing the concept of reducing costs while improving quality. The image portrays business strategy and efficiency. Economy decrease illustrations Businessman presents cost reduction and quality improvement concept. A businessman in a suit holds a digital display showing arrows and percentages, representing. A businessman in a suit holds a digital display showing arrows and percentages, representing the concept of reducing costs while improving quality. The image portrays business strategy and efficiency
Free with trial Money crossed out coin icon doodle illustration. Money crossed out coin doodle icon sketch vector. money crossed out coin sign. isolated symbol illustration. Economy decrease illustrations Money crossed out coin icon doodle illustration. Money crossed out coin doodle icon sketch vector. money crossed out coin sign. isolated symbol illustration
Free with trial A comprehensive set of icons representing various aspects of business, finance, data analysis, growth, and strategy. Economy decrease vectors Collection of Business and Finance Icons for Data Analysis and Growth. A comprehensive set of icons representing various aspects of business, finance, data. A comprehensive set of icons representing various aspects of business, finance, data analysis, growth, and strategy
Free with trial Hand Drawn Bar Chart Demonstrating Negative Trend with Downward Arrow. AI generated. Economy decrease vectors Hand Drawn Bar Chart Demonstrating Negative Trend with Downward Arrow. AI generated
Free with trial Black and white graphic symbol of a percentage sign within a circular badge with jagged edges. AI generated. Economy decrease vectors Black and white graphic symbol of a percentage sign within a circular badge with jagged edges. AI generated
Free with trial Cost reduction icon web design in vector. Cost reduction icon web design logo set collection in flat vector. Economy decrease vectors Cost reduction icon web design in vector. Cost reduction icon web design logo set collection in flat vector
Free with trial A turquoise moon hovers above a stock market graph with rising and falling arrows indicating market trends, useful for illustrating financial concepts. Economy decrease illustrations Stock Market Graph with Moon and Arrow Trends. A turquoise moon hovers above a stock market graph with rising and falling arrows indicating market trends, useful. A turquoise moon hovers above a stock market graph with rising and falling arrows indicating market trends, useful for illustrating financial concepts
Free with trial A 3D render of several red and green Japanese candlestick chart bars arranged in a staggered pattern against a white background. The red bars represent a decrease in value, while the green bars indicate an increase. This visual metaphor is commonly used in financial markets to depict price movements and trading trends. Economy decrease illustrations Red and Green Japanese Candlestick Chart Bars Representing Financial Market Trends stock market. A 3D render of several red and green Japanese candlestick chart. A 3D render of several red and green Japanese candlestick chart bars arranged in a staggered pattern against a white background. The red bars represent a decrease in value, while the green bars indicate an increase. This visual metaphor is commonly used in financial markets to depict price movements and trading trends
Free with trial Red arrows pointing downward at dollar banknotes and coins illustrate decreasing value, highlighting themes of devaluation, financial crisis, and economic downturn. Economy decrease vectors Red arrows pointing downward at dollar banknotes and coins illustrate decreasing value, highlighting themes of. Devaluation, financial crisis, and economic
Free with trial This vibrant 3D rendering showcases a bar chart and pie chart, illustrating data growth and proportions. Ideal for presentations, reports, or educational materials. The colorful design makes it visually appealing and easy to understand. Economy decrease illustrations Colorful 3D Bar Chart and Pie Chart Data Presentation. This vibrant 3D rendering showcases a bar chart and pie chart, illustrating data growth and proportions. This vibrant 3D rendering showcases a bar chart and pie chart, illustrating data growth and proportions. Ideal for presentations, reports, or educational materials. The colorful design makes it visually appealing and easy to understand.
Free with trial Detailed line icon of bar graph columns with a declining downward arrow. Economy decrease vectors Bar chart with downward arrow showing financial decline and loss. Detailed AI generated line icon of bar graph columns with a declining downward arrow. Detailed line icon of bar graph columns with a declining downward arrow
Free with trial 3D business growth down concept icon. 3D icon representing business decline, downturn, and financial loss. Economy decrease illustrations 3D business growth down concept icon. 3D icon representing business decline, downturn, and financial loss
Free with trial 3D business growth down concept icon. 3D icon representing business decline, downturn, and financial loss. Economy decrease illustrations 3D business growth down concept icon. 3D icon representing business decline, downturn, and financial loss
Free with trial Up and down graph icon on black circle. Outline bar chart with uptrend and downtrend arrow symbol. Vector. Economy decrease vectors Up and down graph icon on black circle. Outline bar chart with uptrend and downtrend arrow symbol. Vector
Free with trial Budget reduction strategy cut cost optimization for business growth. Generative AI. Economy decrease illustrations Budget reduction strategy cut cost optimization for business growth. Generative AI. Generative AI
Free with trial A 3D business growth down sign UI icon, isolated on a white background. Symbolizing a decline in business, finance, or market performance. Economy decrease illustrations Business Growth Down Sign UI Icon 3D Isolated on White Background. A 3D business growth down sign UI icon, isolated on a white background. Symbolizing a decline. A 3D business growth down sign UI icon, isolated on a white background. Symbolizing a decline in business, finance, or market performance.
Free with trial This image was created using Generative AI. Two percentage signs with arrows pointing up and down, symbolizing change in rates or values. Economy decrease vectors Percentage signs with arrows indicating change in rates or values. This image was created using Generative AI. Two percentage signs with arrows pointing up and. This image was created using Generative AI. Two percentage signs with arrows pointing up and down, symbolizing change in rates or values
Free with trial Bold red glossy arrow pointing downwards featuring a recessed percent symbol. Professional 3d rendering on white background for sale promotion and business interest rate reduction concepts. Economy decrease illustrations Red down arrow with percentage symbol icon for financial discount. Bold red glossy arrow pointing downwards featuring a recessed percent symbol. Professional 3d. Bold red glossy arrow pointing downwards featuring a recessed percent symbol. Professional 3d rendering on white background for sale promotion and business interest rate reduction concepts
Free with trial Bright, glowing lines depict market fluctuations on a digital grid, representing data analysis created AI. Economy decrease illustrations Dynamic financial charts with glowing lines and a grid background. Bright, glowing lines depict market fluctuations on a digital grid, representing data analysis. Bright, glowing lines depict market fluctuations on a digital grid, representing data analysis created AI
Free with trial This image was created using Generative AI. Conceptual icon showing financial loss or budget cuts. A green arrow points down alongside a dollar bill and decreasing bar chart, representing declining revenue, profit drop, or economic recession. Economy decrease vectors Financial loss concept with money and downward trend chart symbol. This image was created using Generative AI. Conceptual icon showing financial loss or budget. This image was created using Generative AI. Conceptual icon showing financial loss or budget cuts. A green arrow points down alongside a dollar bill and decreasing bar chart, representing declining revenue, profit drop, or economic recession
Free with trial The image shows a fuel pump nozzle superimposed with a digital display indicating a significant drop in oil prices by 4. 73%. The background includes stock market data with symbols like SPXNAS and DETRON. Economy decrease illustrations Oil prices drop significantly as indicated by a fuel pump display. The image shows a fuel pump nozzle superimposed with a digital display indicating a. The image shows a fuel pump nozzle superimposed with a digital display indicating a significant drop in oil prices by 4.73%. The background includes stock market data with symbols like SPXNAS and DETRON
Free with trial A close-up shot of a hand moving wooden blocks, one with a percentage symbol and the other with up and down arrows, symbolizing financial changes. Economy decrease illustrations Hand Adjusting Wooden Blocks Showing Percentage and UpDown Arrows. A close-up shot of a hand moving wooden blocks, one with a percentage symbol and the other. A close-up shot of a hand moving wooden blocks, one with a percentage symbol and the other with up and down arrows, symbolizing financial changes
Free with trial A 3D golden percentage symbol with a reflective metallic surface Clear details and vibrant colors. Economy decrease illustrations A3D rendered golden percentage symbol with a reflective metallic surface on a white background. A 3D golden percentage symbol with a reflective metallic surface. A 3D golden percentage symbol with a reflective metallic surface Clear details and vibrant colors
Free with trial Detailed line icon featuring a money bag with a down arrow and number 3 for cost cutting or price reduction. Economy decrease vectors Money bag with downward arrow and number 3 showing cost reduction. AI generated detailed line icon featuring a money bag with a down arrow and number 3 for cost. detailed line icon featuring a money bag with a down arrow and number 3 for cost cutting or price reduction
Free with trial A minimalist black icon depicting a stack of coins with a dollar sign and a downward arrow pointing towards it. Economy decrease vectors Black Icon Showing A Stack Of Coins With A Downward Arrow Symbol. A minimalist black icon depicting a stack of coins with a dollar sign and a downward arrow. A minimalist black icon depicting a stack of coins with a dollar sign and a downward arrow pointing towards it
Free with trial A 3D bar chart displays a downward trend. The bars are alternating green and pink, decreasing in height from left to right. A bright yellow arrow points downwards, crossing over the bars and emphasizing the decline. The background is a solid, light blue. Economy decrease illustrations Downward Trending Bar Chart with Yellow Arrow Indicating Decline on Light Blue Background. A 3D bar chart displays a downward trend. The bars are alternating. A 3D bar chart displays a downward trend. The bars are alternating green and pink, decreasing in height from left to right. A bright yellow arrow points downwards, crossing over the bars and emphasizing the decline. The background is a solid, light blue
Free with trial Two 3D bar charts side by side illustrating data comparison or business growth trends in black and gray colors. Economy decrease illustrations Two black and gray bar charts showing business growth comparison. Two 3D bar charts side by side illustrating data comparison or business growth trends in black. Two 3D bar charts side by side illustrating data comparison or business growth trends in black and gray colors
Free with trial Flat showing a large balance scale comparing travel and transportation costs. One side holds buses, trains, cars and a red downward arrow with travelers carrying luggage, while the other holds money, coins, an upward blue arrow, globe and airplane. A man adjusts the scale surrounded by icons like compass, calculator, map, gears, fuel pump and cost charts. Ideal for concepts of travel budgeting, price comparison, logistics, tourism economics and decision making. Economy decrease vectors Balancing Travel Costs Versus Transportation Options Illustration. Flat showing a large balance scale comparing travel and transportation costs. One side holds. Flat showing a large balance scale comparing travel and transportation costs. One side holds buses, trains, cars and a red downward arrow with travelers carrying luggage, while the other holds money, coins, an upward blue arrow, globe and airplane. A man adjusts the scale surrounded by icons like compass, calculator, map, gears, fuel pump and cost charts. Ideal for concepts of travel budgeting, price comparison, logistics, tourism economics and decision making.
Free with trial Energy Consumption Decline Chart. Visual representation of decreasing power utilization trends, indicating effective resource management and environmental efficiency. Economy decrease vectors (Energy Consumption Decline Chart. Visual representation of decreasing. Energy Consumption Decline Chart. Visual representation of decreasing power utilization. Energy Consumption Decline Chart. Visual representation of decreasing power utilization trends, indicating effective resource management and environmental efficiency
Free with trial Black and White Line Icon of a Declining Financial Chart Graph. A clean line style icon depicting a declining financial chart arrow pointing downwards. Economy decrease vectors Black and White Line Icon of a Declining Financial Chart Graph. A clean line style icon depicting a declining financial chart arrow pointing downwards
Free with trial The image shows a golden dollar sign placed at the intersection of a downward red arrow and an upward green arrow, symbolizing economic decline and growth or contrasting financial performance. Economy decrease illustrations Financial trends depicted by contrasting arrows and dollar symbol. The image shows a golden dollar sign placed at the intersection of a downward red arrow and an. The image shows a golden dollar sign placed at the intersection of a downward red arrow and an upward green arrow, symbolizing economic decline and growth or contrasting financial performance
Free with trial Vector concept of government budget balance showing revenue versus expenditure on a seesaw scale. A large hand labeled budget presses down with a weight on public buildings including government office, hospital, school, buses and trains. Blue revenue arrow with dollar euro coin flows in while red expenditure arrow with euro coin flows out. Ideal for articles on fiscal policy, economics, taxation, public spending, deficit and financial planning. Economy decrease vectors Government Budget Balance Revenue Versus Expenditure Illustration. Vector concept of government budget balance showing revenue versus expenditure on a seesaw. Vector concept of government budget balance showing revenue versus expenditure on a seesaw scale. A large hand labeled budget presses down with a weight on public buildings including government office, hospital, school, buses and trains. Blue revenue arrow with dollar euro coin flows in while red expenditure arrow with euro coin flows out. Ideal for articles on fiscal policy, economics, taxation, public spending, deficit and financial planning.
Free with trial A conceptual image illustrating a housing market crash, featuring a small red model house on graph paper with a hand-drawn blue line showing a steep downward trend. This image, symbolizing property value depreciation and financial crisis, was generated using AI. Economy decrease illustrations Real Estate Market Crash Concept with Miniature House AI generated. A conceptual image illustrating a housing market crash, featuring a small red model house on. A conceptual image illustrating a housing market crash, featuring a small red model house on graph paper with a hand-drawn blue line showing a steep downward trend. This image, symbolizing property value depreciation and financial crisis, was generated using AI.
Free with trial Modern office buildings with large red downward arrows on their facades. Clear sky background. Concept of economic recession. 3D Rendering. Economy decrease illustrations Office buildings with downward arrows symbolizing decline. 3D Rendering. Modern office buildings with large red downward arrows on their facades. Clear sky. Modern office buildings with large red downward arrows on their facades. Clear sky background. Concept of economic recession. 3D Rendering
Free with trial An detailed set of professional financial line graphs and business reporting icons for data visualization and statistics. Economy decrease vectors Professional financial line graphs and business reporting icons. An ai generated detailed set of professional financial line graphs and business reporting icons. An detailed set of professional financial line graphs and business reporting icons for data visualization and statistics
Free with trial Three bright red arrows pointing downwards, each displaying a white percentage symbol. The objects are presented isolated on a clean white background. Economy decrease illustrations Three red downward arrows with percentage symbols isolated on white background. Three bright red arrows pointing downwards, each displaying a white percentage. Three bright red arrows pointing downwards, each displaying a white percentage symbol. The objects are presented isolated on a clean white background
Free with trial Growth and decline graph report icon. Financial chart arrow up and down sign symbol. Illustration. Economy decrease vectors Growth and decline graph report icon. Financial chart arrow up and down sign symbol. Illustration
Free with trial Digital display shows gas prices changing from 3. 59 to 3. 60 and then to 3. 71 at a gas station with blurred pumps in the background. Economy decrease illustrations Digital fuel price display showing decreasing gas prices from 3.59 to 3.60 and finally to 3.71 at a gas station with blurred. Digital display shows gas prices. Digital display shows gas prices changing from 3.59 to 3.60 and then to 3.71 at a gas station with blurred pumps in the background
Free with trial Person's hand points to stock market data displayed on laptop screen indicating analysis Use for finance or investment themes. Economy decrease illustrations Analyzing Stock Market Data on Laptop Screen with Hand Pointing. Person's hand points to stock market data displayed on laptop screen indicating analysis Use for. Person's hand points to stock market data displayed on laptop screen indicating analysis Use for finance or investment themes
Free with trial Minimalist outline drawing of a bar chart representing data analysis and statistical information. Great for presentations and data representations. Economy decrease vectors Simple Outline Bar Chart Sign Statistical Data Analysis Diagram Icon. Minimalist outline drawing of a bar chart representing data analysis and statistical. Minimalist outline drawing of a bar chart representing data analysis and statistical information. Great for presentations and data representations.
Free with trial A person in a suit points a finger at a percentage symbol. The symbol is surrounded by red and green arrows on a dark background. The composition is close-up. Economy decrease illustrations Businessman pointing at percentage symbol with red and green arrows on a dark background finance. A person in a suit points a finger at a percentage symbol. The. A person in a suit points a finger at a percentage symbol. The symbol is surrounded by red and green arrows on a dark background. The composition is close-up
Free with trial Shopping cart with red downward arrow illustrating consumer spending drop and economic concern on turquoise background. Shopping cart with red downward arrow. Economy decrease illustrations Shopping cart with red downward arrow illustrating consumer spending drop and economic concern on turquoise background. Shopping cart with red downward arrow
Free with trial Detailed line icon representing loss prevention, market downturn, and risk management. Economy decrease vectors Declining financial line chart graph with crossed out failure box. AI generated detailed line icon representing loss prevention, market downturn, and risk. detailed line icon representing loss prevention, market downturn, and risk management
Free with trial Analyze Data with Colorful Graph and Notes for Business Planning Strategy , layered depth. Economy decrease illustrations Analyze Data with Colorful Graph and Notes for Business Planning Strategy. Layered depth
Free with trial Downward Chart: Declining bar graph with falling arrow indicates losses and economic downturn. AI generated. Economy decrease vectors Downward Chart: Declining bar graph with falling arrow indicates losses and economic downturn. AI generated
Free with trial This image showcases data analysis icons, representing data processing, visualization, and interpretation, which are crucial for gaining valuable insights. Economy decrease vectors Vector art of data analysis icons representing various aspects of data processing, visualization, and interpretation for insights. This image showcases data. This image showcases data analysis icons, representing data processing, visualization, and interpretation, which are crucial for gaining valuable insights
Free with trial A growth chart with a star signifies progress. It shows upward trends, success, and achievement in business or personal development, indicating positive results. Economy decrease vectors Vector art of growth chart with star, representing progress, success, achievement, and upward trend in business or personal. A growth chart with a star signifies. A growth chart with a star signifies progress. It shows upward trends, success, and achievement in business or personal development, indicating positive results
Free with trial This image was created using Generative AI. A simple black and white graph showing a downward trend with three bars and an arrow. Economy decrease vectors Downward trend graph with black bars and arrow on white background. This image was created using Generative AI. A simple black and white graph showing a downward. This image was created using Generative AI. A simple black and white graph showing a downward trend with three bars and an arrow
Free with trial The image depicts a small yellow figure standing on a green circular platform. Above the figure, there are multiple red arrows pointing downwards, suggesting a downward trend or pressure. Economy decrease illustrations Yellow figure standing under red downward arrows on green platform. The image depicts a small yellow figure standing on a green circular platform. Above the. The image depicts a small yellow figure standing on a green circular platform. Above the figure, there are multiple red arrows pointing downwards, suggesting a downward trend or pressure
Free with trial This image was created using Generative AI. A red arrow pointing down over a decreasing bar chart indicates negative trends, losses, and downturns in business performance or economic data. Economy decrease vectors Red Arrow Down On Bar Graph Symbolizing Financial Loss And Decline. This image was created using Generative AI. A red arrow pointing down over a decreasing bar. This image was created using Generative AI. A red arrow pointing down over a decreasing bar chart indicates negative trends, losses, and downturns in business performance or economic data
Free with trial A conceptual photo showing stacked wooden blocks labeled "Inflation" and "GDP" with a red upward arrow and a blue downward arrow, illustrating rising inflation alongside declining GDP growth in a warm home office setting. Ideal for economics, financial news, and macroeconomic content. This image was generated using artificial intelligence (AI). Economy decrease illustrations Inflation Rising Versus GDP Falling Illustrated With Wooden Blocks. A conceptual photo showing stacked wooden blocks labeled 'Inflation' and 'GDP' with a red. A conceptual photo showing stacked wooden blocks labeled "Inflation" and "GDP" with a red upward arrow and a blue downward arrow, illustrating rising inflation alongside declining GDP growth in a warm home office setting. Ideal for economics, financial news, and macroeconomic content. This image was generated using artificial intelligence (AI).
Free with trial This image was created using Generative AI. Black and white financial decline icon featuring a piggy bank with dollar sign and a downward trending bar chart arrow symbolizing loss. Economy decrease vectors Financial Loss Icon With Piggy Bank And Downward Trend Chart Arrow. This image was created using Generative AI. Black and white financial decline icon featuring. This image was created using Generative AI. Black and white financial decline icon featuring a piggy bank with dollar sign and a downward trending bar chart arrow symbolizing loss
Free with trial This image was created using Generative AI. Minimalist black and white line icon depicting a descending bar graph with a zigzag arrow pointing down. Represents financial loss, market downturn, or decreased performance. Ideal for business presentations and reports. Economy decrease vectors Declining Bar Chart Icon With Downward Trend Arrow Business Symbol. This image was created using Generative AI. Minimalist black and white line icon depicting a. This image was created using Generative AI. Minimalist black and white line icon depicting a descending bar graph with a zigzag arrow pointing down. Represents financial loss, market downturn, or decreased performance. Ideal for business presentations and reports
Free with trial This image was created using Generative AI. Black and white line chart icon displaying statistical data fluctuation on a grid background. Symbol for business analytics, growth trends, and market analysis. Economy decrease vectors Line Graph Icon With Grid Background Showing Data Fluctuation And Statistical Analysis Trend. This image was created using Generative AI. Black and white line. This image was created using Generative AI. Black and white line chart icon displaying statistical data fluctuation on a grid background. Symbol for business analytics, growth trends, and market analysis
Free with trial This AI-generated image shows a financial professional facing economic loss. Perfect for analysts needing to visualize market downturns, it highlights risk management in a modern corporate setting. Economy decrease illustrations Businessman holding a declining financial bar chart with a red arrow. This AI-generated image shows a financial professional facing economic loss. Perfect for. This AI-generated image shows a financial professional facing economic loss. Perfect for analysts needing to visualize market downturns, it highlights risk management in a modern corporate setting.
Free with trial Icons on a white background depict percentage symbols combined with arrows and bar graphs. The top row includes red, blue, and yellow arrows with percentage symbols. The middle row shows a multicolored bar graph, green percentage symbols, and a black percentage symbol with a black arrow. The bottom row contains a black bar graph, a downward arrow, and a large black percentage symbol. These elements visually represent data trends, growth, and decline. Economy decrease vectors Percentage Growth and Decline Arrow Icon Set Multi Color and Silhouette. Icons on a white background depict percentage symbols combined with arrows and bar. Icons on a white background depict percentage symbols combined with arrows and bar graphs. The top row includes red, blue, and yellow arrows with percentage symbols. The middle row shows a multicolored bar graph, green percentage symbols, and a black percentage symbol with a black arrow. The bottom row contains a black bar graph, a downward arrow, and a large black percentage symbol. These elements visually represent data trends, growth, and decline.
Free with trial Decreasing Value: Cartoon Money Sack with Downward Arrow Symbolizes Financial Loss or Decline. AI generated. Economy decrease vectors Decreasing Value: Cartoon Money Sack with Downward Arrow Symbolizes Financial Loss or Decline. AI generated
Free with trial Falling Interest Rates and Mortgage Home Prices Concept. This image is generated using AI tool. Economy decrease illustrations Falling Interest Rates and Mortgage Home Prices Concept. This image is generated using AI tool
Free with trial Falling Interest Rates and Mortgage Home Prices Concept. This image is generated using AI tool. Economy decrease illustrations Falling Interest Rates and Mortgage Home Prices Concept. This image is generated using AI tool
Free with trial Falling Interest Rates and Mortgage Home Prices Concept. This image is generated using AI tool. Economy decrease illustrations Falling Interest Rates and Mortgage Home Prices Concept. This image is generated using AI tool
Free with trial Plummeting Oil Prices Barrel and Downward Trend Chart. Economy decrease vectors Plummeting Oil Prices Barrel and Downward Trend Chart. Plummeting Oil Prices, Barrel and Downward Trend Chart
Free with trial A blue line drop-down with red bar chart on white background. Business concept. Economy decrease vectors A blue line drop-down with red bar chart on white background. Business concept. A blue line drop-down with red bar chart on a white background. Businese concept
Free with trial Financial crisis stages icon doodle illustration. Financial crisis stages doodle icon sketch vector. financial crisis stages sign. isolated symbol illustration. Economy decrease vectors Financial crisis stages icon doodle illustration. Financial crisis stages doodle icon sketch vector. financial crisis stages sign. isolated symbol illustration
Free with trial Visual representation of financial downturn or economic recession. Stacks of gold coins show a downward trend, emphasized by a prominent red arrow pointing towards a decrease in value or quantity. Economy decrease illustrations Golden coins stacked in ascending order with red downward arrow indicating financial decline. Visual representation of financial downturn or economic recession. Visual representation of financial downturn or economic recession. Stacks of gold coins show a downward trend, emphasized by a prominent red arrow pointing towards a decrease in value or quantity
Free with trial Red fall arrow on graphs and charts. Space for text. Economy decrease illustrations Red fall arrow on graphs and charts. Space for text. Red fall arrow on graphs and charts. Space for text
Free with trial A 3D rendered illustration features a large blue downward-pointing arrow positioned diagonally on a white background. Overlapping the arrow is a small pink circle containing a white percentage symbol. This visual effectively communicates concepts such as discounts, sales, price reductions, negative trends, or financial decline. Economy decrease illustrations Blue Downward Arrow with Pink Circle and Percentage Symbol on White Background image photo. A 3D rendered illustration features a large blue downward-pointing. A 3D rendered illustration features a large blue downward-pointing arrow positioned diagonally on a white background. Overlapping the arrow is a small pink circle containing a white percentage symbol. This visual effectively communicates concepts such as discounts, sales, price reductions, negative trends, or financial decline
Free with trial Laptop showing downward stock chart on screen, realistic graphic style, on white office desk background, concept of financial crisis. 3D Rendering. Economy decrease illustrations Laptop displaying falling stock market chart on office desk showing financial crisis and global market crash in business. Laptop showing downward stock chart on. Laptop showing downward stock chart on screen, realistic graphic style, on white office desk background, concept of financial crisis. 3D Rendering
Free with trial Falling Interest Rates and Mortgage Home Prices Concept. This image is generated using AI tool. Economy decrease illustrations Falling Interest Rates and Mortgage Home Prices Concept. This image is generated using AI tool
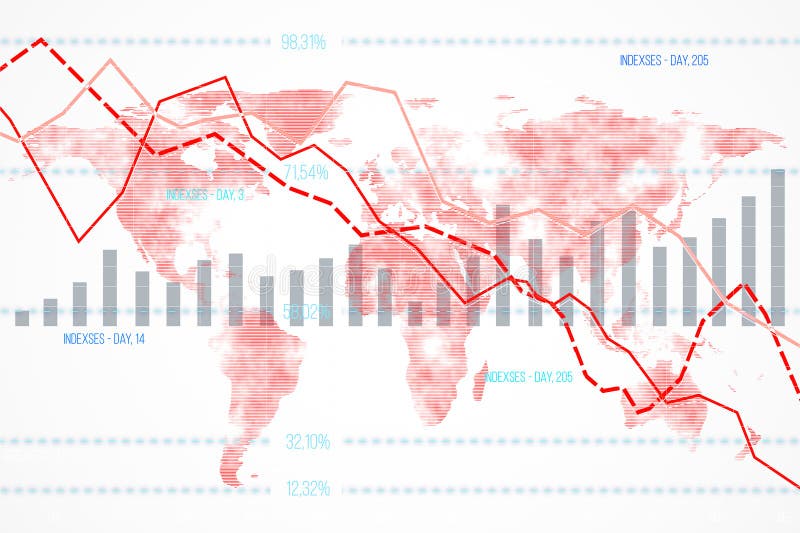
Free with trial Financial data chart featuring declining indexes and bar graphs overlaid on a world map background. Concept of global economic downturn. 3D Rendering. Economy decrease illustrations Financial data chart with declining indexes on a world map background. 3D Rendering. Financial data chart featuring declining indexes and bar graphs overlaid on. Financial data chart featuring declining indexes and bar graphs overlaid on a world map background. Concept of global economic downturn. 3D Rendering
Free with trial Detailed statistics, a white background, and a downward arrow depicting a stock market crash. 3D rendering. Detailed statistics, a white background, and a. Economy decrease illustrations Detailed statistics, a white background, and a downward arrow depicting a stock market crash. 3D rendering. Detailed statistics, a white background, and a
Free with trial Up and down graph icon vector in circular line. Outline bar chart with uptrend and downtrend arrow symbol. Economy decrease vectors Up and down graph icon in circular line. Outline bar chart with uptrend and downtrend arrow symbol. Up and down graph icon vector in circular line. Outline bar. Up and down graph icon vector in circular line. Outline bar chart with uptrend and downtrend arrow symbol
Free with trial Wooden blocks spelling demand in descending order, business concept. A wooden block staircase with letters forming the word demand on a blue background. Economy decrease illustrations Wooden blocks spelling demand in descending order, business concept. A wooden block staircase with letters forming the word demand on a blue background
Free with trial A vibrant red arrow curves downwards, indicating a decline or negative trend, isolated on a clean white background. Economy decrease illustrations Red arrow pointing down isolated on white background. A vibrant red arrow curves downwards, indicating a decline or negative trend, isolated on a clean white. A vibrant red arrow curves downwards, indicating a decline or negative trend, isolated on a clean white background
Free with trial Composite sketch design artwork 3D photo collage of young lady shocked arrow point low coins downwards crisis budget bankruptcy investor. Economy decrease illustrations Composite sketch design artwork 3D photo collage of young lady shocked arrow point low coins downwards crisis budget. Bankruptcy investor
Free with trial Concept of business failure, economic downturn, financial crisis or stock market crash depicted by a descending line of skyscrapers emerging from fog, symbolizing loss. Economy decrease illustrations Conceptual image representing business decline or stock market crash with city skyline in fog. Concept of business failure, economic downturn, financial crisis. Concept of business failure, economic downturn, financial crisis or stock market crash depicted by a descending line of skyscrapers emerging from fog, symbolizing loss
Free with trial Red arrow pointing down and coins showing stock market crash, investment loss, and financial crisis. Economy decrease illustrations Stock market crash showing a red downward arrow and gold coins. Red arrow pointing down and coins showing stock market crash, investment loss, and financial. Red arrow pointing down and coins showing stock market crash, investment loss, and financial crisis
Free with trial The image shows a bar chart with a downward trend line overlaid in red, indicating a decline. A green dollar symbol is positioned at the end of the chart, suggesting a connection to financial loss or decreasing revenue. Economy decrease illustrations Graphic depicting a declining financial trend with a dollar symbol. The image shows a bar chart with a downward trend line overlaid in red, indicating a decline. The image shows a bar chart with a downward trend line overlaid in red, indicating a decline. A green dollar symbol is positioned at the end of the chart, suggesting a connection to financial loss or decreasing revenue
Free with trial Stock market data with candlestick chart and declining arrow on a blurred light background. Concept of financial decline. 3D Rendering. Economy decrease illustrations Abstract image of financial stock market data with declining arrow on light background. 3D Rendering. Stock market data with candlestick chart and declining. Stock market data with candlestick chart and declining arrow on a blurred light background. Concept of financial decline. 3D Rendering
 Sign in