Free with trial Gauge of fuel. Guage of gas, gasoline. Full or empty tank of petrol or diesel in car. Indicators on dashboard in auto. Dial of measurement, level, control power. Efficiency of pump equipment. Vector. Efficiency indicators vectors Gauge of fuel. Guage of gas, gasoline. Full or empty tank of petrol or diesel in car. Indicators on dashboard in auto. Dial of
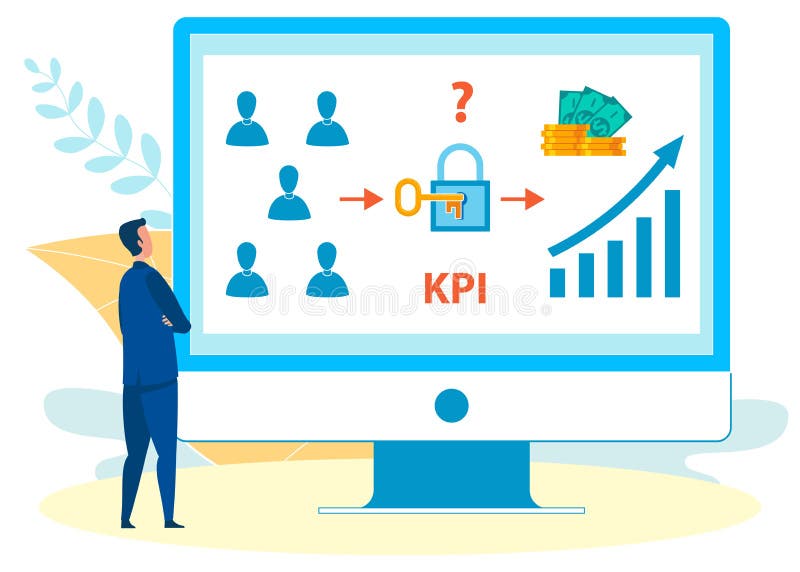
Free with trial Illustration vector of performance indicators or KPI. Efficiency indicators vectors Performance indicators vector. Illustration vector of performance indicators or KPI.
Free with trial Key Performance Indicator words and acronym KPI on a golden compass to illustrate measurement metrics for finding production, producitivity success in output and results. Efficiency indicators illustrations Key Performance Indicators KPI Compass Directing Measurement Res. Key Performance Indicator words and acronym KPI on a golden compass to illustrate measurement metrics for finding production, producitivity success in output and results
Free with trial Battery charge level indicators on white. Charging. 3d. Efficiency indicators illustrations Battery charge level indicators on white. Charging.
Free with trial Speedometer indicators gauges low, moderate and high measurement levels vector stock. Level and rating illustration. Efficiency indicators vectors Speedometer indicators gauges low, moderate and high measurement levels vector stock
Free with trial Office teamwork - business people in teams looking ahead, holding and carrying marketing indicators vector concept set. Hand drawn sketch isolated illustration. Efficiency indicators vectors Office teamwork - business people in teams looking ahead, holding and carrying marketing indicators vector concept set
Free with trial Simple set of lamp features related vector icons for your design. Efficiency indicators vectors Lamp indicators. Simple set of lamp features related vector icons for your design
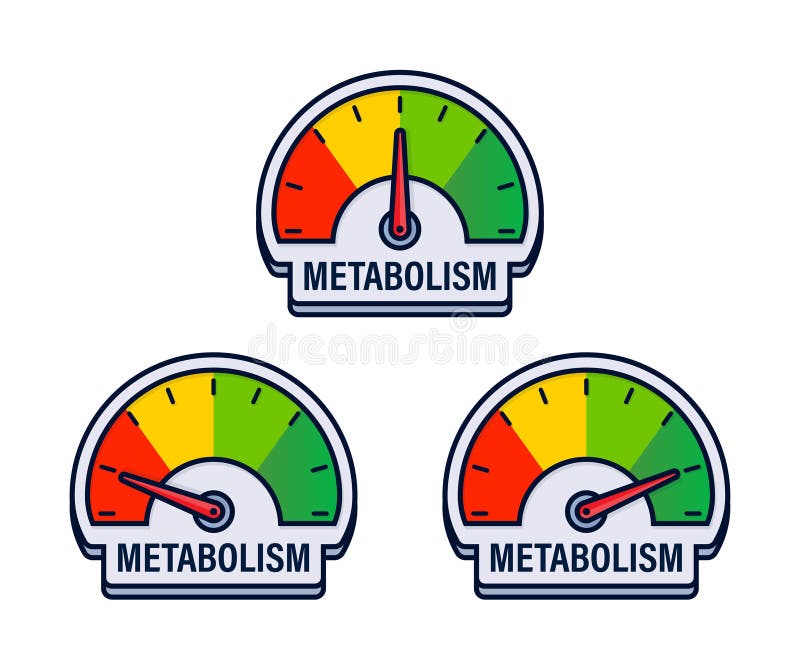
Free with trial Metabolic Efficiency Rating Gauges Vector Illustration with Color Coded Energy Consumption Indicators. Efficiency indicators vectors Metabolic Efficiency Rating Gauges Vector Illustration with Color Coded Energy Consumption Indicators
Free with trial Improvement of indicators icon. maintaining efficiency concept symbol design, increase in productivity, growth of graphs indicators on laptop display, outline of effectiveness, performance. Efficiency indicators vectors Improvement of indicators icon. maintaining efficiency concept symbol design, increase in productivity, growth of graphs
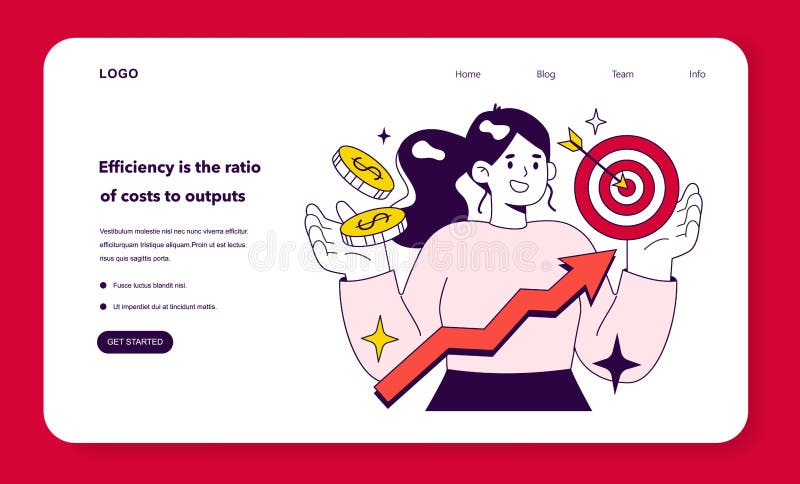
Free with trial Key performance indicators. Employee efficiency evaluation, the ratio of costs to outputs. Staff management and development. Flat vector illustration. Efficiency indicators vectors Key performance indicators. Employee efficiency evaluation, the ratio
Free with trial Relevant topics regarding business and company KPI (key perfomance indicators). Efficiency indicators illustrations Key performance indicators. Relevant topics regarding business and company KPI (key perfomance indicators)
Free with trial ISM Manufacturing Index icons depict manufacturing, economic indicators, and technology. Outline icons set. Efficiency indicators vectors ISM Manufacturing Index icons depict manufacturing, economic indicators, and technology. ... ISM Manufacturing Index icons depict manufacturing, economic indicators, and technology. Outline icons set.
Free with trial Digital business analysis. Analysis of investments. Business men analyze growth charts. Performance indicators. Modern vector illustration isometric style. Efficiency indicators vectors Digital business analysis. Analysis of investments. Business men analyze growth charts. Performance indicators. Modern
Free with trial Efficiency Audit, A 3D rendering of an efficiency audit report featuring green checkmarks, highlighting operational success and, Efficiency Audit. Efficiency indicators illustrations Efficiency Audit, A 3D rendering of an efficiency audit report featuring green checkmarks, highlighting operational success and
Free with trial KPI, key performance indicators for HR specialist. Indicator to measure personnel manager efficiency. Metrics and rates to report worker performance. Flat vector illustration. Efficiency indicators vectors KPI, key performance indicators for HR specialist. Indicator to measure
Free with trial Sustainability and energy efficiency. Man calculates household utility bills based on electricity meter data. Electricity Usage Monitoring. Reduced energy consumption. Cartoon flat vector illustration. Efficiency indicators vectors Sustainability and energy efficiency
Free with trial A design illustrating customizable environmental audits featuring tools, metrics, and sustainability indicators, Customizable environmental audit with semi flat illustration. Efficiency indicators vectors A design illustrating customizable environmental audits featuring tools, metrics, and sustainability indicators, Customizable
Free with trial A person interacts with a visual workflow showing customizable task steps, progress indicators, and data, Next steps Customizable Semi Flat Illustration. Efficiency indicators vectors A person interacts with a visual workflow showing customizable task steps, progress indicators, and data, Next steps Customizable
Free with trial Generated with the use of AI. Finance Professional Interacts with Futuristic Accounting Interface Displaying Key Financial Indicators and Tools. Efficiency indicators illustrations Finance Professional Interacts with Futuristic Accounting Interface Displaying Key Financial Indicators and Tools
Free with trial Data analytics to plan and improve efficiency thin black outline symbols vector illustration. Key Performance Indicators, business development and quality metrics evaluation line icon set. Efficiency indicators vectors Key Performance Indicators, business development metrics evaluation line icon set. Data analytics to plan and improve efficiency thin black outline symbols vector illustration. Key Performance Indicators, business development and quality metrics evaluation line icon set.
Free with trial Vector hand drawn business concept sketch. Business people running and carrying indicators meaning progress and development in business. Lettering Business concept. Efficiency indicators vectors Hand drawn business people running with indicators. Vector hand drawn business concept sketch. Business people running and carrying indicators meaning progress and development in business. Lettering Business concept
Free with trial Efficiency level scale with arrow. The measuring device icon. Sign tachometer, speedometer, indicators. Vector illustration in isometric style. Infographic gauge element. Efficiency indicators vectors Measuring device concept. Efficiency level scale with arrow. The measuring device icon. Sign tachometer, speedometer, indicators. Vector illustration in isometric style. Infographic gauge element
Free with trial Isometric flat vector concept of financial growth, indicators improvement, increasing efficiency. Efficiency indicators vectors Sales growth isometric flat vector conceptual illustration. Isometric flat vector concept of financial growth, indicators improvement, increasing efficiency.
Free with trial Logistics analyst examining logistics data chart, Supply chain optimization and evaluating logistical information for operational efficiency goals and risk mitigation, Approach for logistical. Efficiency indicators illustrations Logistics analyst
Free with trial Set of analog indicators showing the levels of PERFORMANCE in percentage. 3D illustration. Efficiency indicators illustrations Set of Performance Indicator. Set of analog indicators showing the levels of PERFORMANCE in percentage. 3D illustration
Free with trial A set of vector icons representing long-lasting drugs, including symbols of duration and effectiveness, time indicators and growth charts, shields and safety locks, with an editable stroke. Efficiency indicators vectors A set of vector icons representing long-lasting drugs, including symbols of duration and effectiveness, time indicators
Free with trial An opportunity to see your mistakes. Advantage of key performance indicators implementation. Company management and business strategy development. Flat vector illustration. Efficiency indicators vectors Advantages of key performance indicators implementation. Benefits of KPI. An opportunity to see your mistakes. Advantage of key performance indicators implementation. Company management and business strategy development. Flat vector illustration
Free with trial Two men in the boat work for themselves, Not teamwork, Controversial work, lack of a leader, not efficiency, Poor performance. flat character. Vector illustration for landing page. Efficiency indicators vectors Two men in the boat work for themselves, Not teamwork, Controversial work, lack of a leader, not efficiency
Free with trial Effective key performance indicators loop concept icon. Project success. Release management metrics abstract idea thin line illustration. Isolated outline drawing. Editable stroke. Arial font used. Efficiency indicators vectors Effective key performance indicators loop concept icon
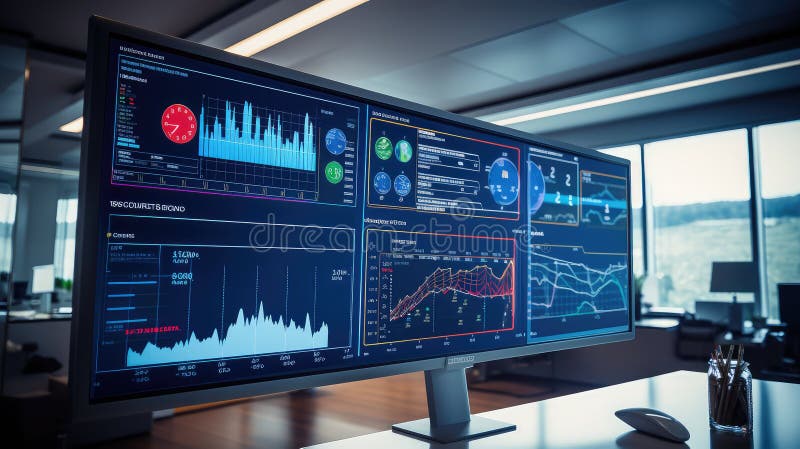
Free with trial Multiple Screens Displayed on Computer Monitor for Efficient Multitasking, Financial data indicators on a monitor, Stock market or forex trading graph,. Efficiency indicators vectors Multiple Screens Displayed on Computer Monitor for Efficient Multitasking, Financial data indicators on a monitor, Stock market or
Free with trial Analyze performance metrics, ensure product quality, and verify compliance with this compelling image. A digital display showcases critical data analysis on a computer screen set against a wooden desk background. This visual is ideal for illustrating concepts like monitoring, business technology, and internet-driven efficiency. The screen highlights key compliance indicators with check marks,. Efficiency indicators illustrations Digital performance product quality and compliance displayed on a computer screen on a wooden desk. Analyze performance metrics, ensure product quality, and verify compliance with this compelling image. A digital display showcases critical data analysis on a computer screen set against a wooden desk background. This visual is ideal for illustrating concepts like monitoring, business technology, and internet-driven efficiency. The screen highlights key compliance indicators with check marks,
Free with trial Businessman analyzing profitability performance forecasting company future 2023. Positive indicators of growing virtual digital graphs investments with informative and financial assessments. Efficiency indicators illustrations Businessman analyzing profitability performance forecasting company future 2023.
Free with trial Business growth analysis concept. Businessman plan growth and increase of positive indicators in his business. Efficiency indicators illustrations Business growth analysis
Free with trial Set of fuel indicators with different petrol amount. Efficiency indicators vectors Fuel indicator. Set of fuel indicators with different petrol amount.
Free with trial EXCELLENCE colorful overlapping letters banner. Vector. Rainbow palette. Efficiency indicators vectors EXCELLENCE colorful overlapping letters banner
Free with trial Time management and workflow, organization, control of the result of operations, analysis and statistics indicators. Illustration thin line design of vector doodles, infographics elements. Efficiency indicators vectors Time management, workflow, organization, control of the result operations. Time management and workflow, organization, control of the result of operations, analysis and statistics indicators. Illustration thin line design of vector doodles, infographics elements.
Free with trial Evaluation word on purple background. Efficiency indicators illustrations Evaluation word on purple
Free with trial Benchmarking concept. Analysis of the effective functioning of the business. The idea of development and improvement of business. Business risk testing. Compare quality with competitors. Evaluation of possible ways to improve the business. Efficiency indicators vectors Benchmarking concept. Analysis of the effective functioning of the business. The idea of development and improvement of business.
Free with trial Best practices traffic sign on blue sky background. Efficiency indicators illustrations Best practices traffic sign on blue sky
Free with trial Top-down illustration of a modern smart city showcasing interconnected high-rise buildings and spacious green parks arranged systematically in a grid layout. Solar panels are visible on many rooftops, emphasizing sustainable energy use. Wind turbines are strategically placed throughout the city. Roads form a neat network, and trees line the streets, adding greenery. Blue connectivity indicators suggest advanced communication systems. The overall design reflects innovation and environmental consciousness, emphasizing the integration of technology and nature for sustainable urban living. Efficiency indicators illustrations Top-down illustration of a modern smart city featuring interconnected buildings, lush green parks, and sustainable solar energy. Top-down illustration of a modern smart city showcasing interconnected high-rise buildings and spacious green parks arranged systematically in a grid layout. Solar panels are visible on many rooftops, emphasizing sustainable energy use. Wind turbines are strategically placed throughout the city. Roads form a neat network, and trees line the streets, adding greenery. Blue connectivity indicators suggest advanced communication systems. The overall design reflects innovation and environmental consciousness, emphasizing the integration of technology and nature for sustainable urban living.
Free with trial Analysing KPI Rates on Laptop Vector Illustration. Cartoon HR Expert, Boss, Top Manager Studying Employees Key Performance Indicators. Converting Workers Efficiency into Higher Profit, Income. Efficiency indicators vectors Analysing KPI Rates on Laptop Vector Illustration
Free with trial Businessman analyzes sales data and economic growth charts on a tablet. Focused on business strategy, financial trends, and digital marketing. Creating Ai. Efficiency indicators illustrations Businessman analyzes sales data and economic growth charts on a tablet.
Free with trial A diverse team collaborates on agile project management, utilizing charts, tools, and digital devices in a bright and modern office environment. Efficiency indicators vectors A diverse team collaborates on agile project management, utilizing charts, tools
Free with trial Transform raw data into actionable insights with this visually compelling data analysis. Designed for maximum clarity and impact, the charts feature crisp line graphs and robust bar charts presented on a clean white background. Ideal for business reports, presentations, and dashboards, this meticulously crafted design ensures your data is easily understood and your message resonates effectively. Efficiency indicators illustrations Visualizing Business Insights: Clear, Concise Data Analysis with Line and Bar Charts for Powerful. Transform raw data into actionable insights with this visually compelling data analysis. Designed for maximum clarity and impact, the charts feature crisp line graphs and robust bar charts presented on a clean white background. Ideal for business reports, presentations, and dashboards, this meticulously crafted design ensures your data is easily understood and your message resonates effectively
Free with trial An analytical perspective on understanding and measuring liquidity in the cryptocurrency markets. Efficiency indicators illustrations Understanding Liquidity in Crypto Markets. An analytical perspective on understanding and measuring liquidity in the cryptocurrency markets
Free with trial Increase productivity concept. Level scale with arrow. The measuring device icon. Sign tachometer, speedometer, indicators. Infographic gauge element. Efficiency indicators illustrations Productivity increase illustration. Increase productivity concept. Level scale with arrow. The measuring device icon. Sign tachometer, speedometer, indicators. Infographic gauge element.
Free with trial A sleek, modern tablet displays a user-friendly dashboard interface. The screen showcases data visualization elements like charts, graphs, and numerical data, presented in a clean and organized layout. The interface features a navigation menu, key performance indicators (KPIs), and progress indicators. The image conveys concepts of data analysis, business intelligence, and user experience design. Ideal for illustrating tech, finance, and business-related content. Efficiency indicators illustrations Modern Dashboard Interface on Tablet. A sleek, modern tablet displays a user-friendly dashboard interface. The screen showcases data visualization elements like charts, graphs, and numerical data, presented in a clean and organized layout. The interface features a navigation menu, key performance indicators (KPIs), and progress indicators. The image conveys concepts of data analysis, business intelligence, and user experience design. Ideal for illustrating tech, finance, and business-related content.
Free with trial KPI. Business. Vector illustration Optimization maximizes efficiency and performance KPIs provide measurable targets for performance evaluation Research provides valuable insights for informed. Efficiency indicators vectors KPI. Business. Companies strive for marketing success through effective strategies. KPI. Business. Vector illustration Optimization maximizes efficiency and performance KPIs provide measurable targets for performance evaluation Research provides valuable insights for informed
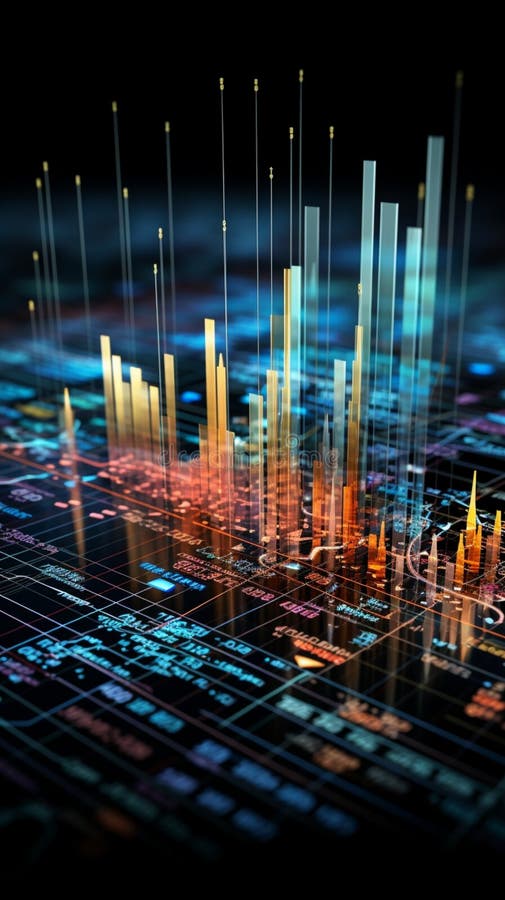
Free with trial Financial diagrams representing data and analytics in a business context Vertical Mobile Wallpaper. Efficiency indicators illustrations Financial diagrams representing data and analytics in a business context
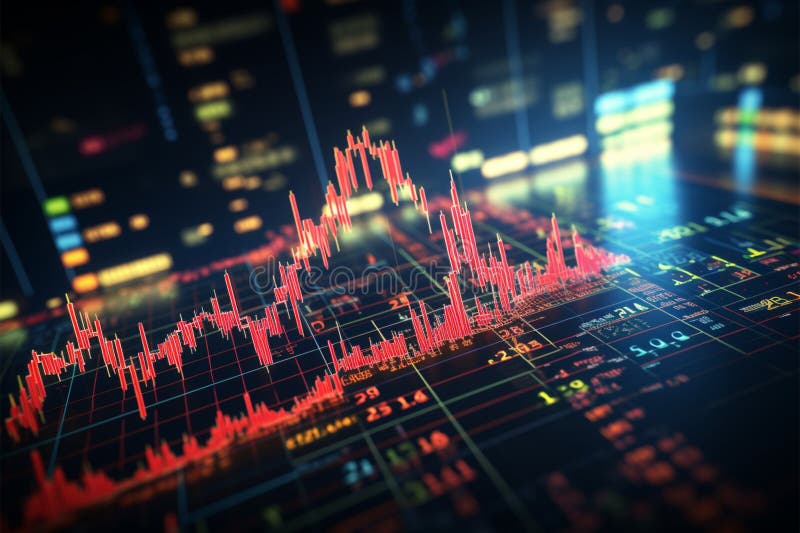
Free with trial Visualizing the stock markets fluctuations through forex trading graphs Generative AI. Efficiency indicators illustrations Visualizing the stock markets fluctuations through forex trading graphs
Free with trial Dashboard healthcare data analytics illustration metrics patient, satisfaction wait, quality care dashboard healthcare data analytics. Efficiency indicators illustrations Dashboard healthcare data analytics
Free with trial This image depicts hands typing on a laptop with glowing icons representing key elements of achieving business goals strategic planning, innovation, team work, and target market. It symbolizes the digital transformation required for success in today's business environment. Efficiency indicators illustrations Achieving Business Goals Strategic Planning and Digital Transformation. This image depicts hands typing on a laptop with glowing icons representing key elements of achieving business goals strategic planning, innovation, team work, and target market. It symbolizes the digital transformation required for success in today's business environment.
Free with trial The visual features a series of red arrows pointing upward against a textured background, representing positive growth trends. This design emphasizes progress and success in data metrics, suitable for marketing or finance presentations. Efficiency indicators illustrations Red Arrows Indicating Growth Trends in a Data Visualization Design. Generative AI. The visual features a series of red arrows pointing upward against a textured background, representing positive growth trends. This design emphasizes progress and success in data metrics, suitable for marketing or finance presentations.
Free with trial Business and finance strategies shaped by insights from stock market trading charts Generative AI. Efficiency indicators illustrations Business and finance strategies shaped by insights from stock market trading charts
Free with trial Business and finance strategies shaped by insights from stock market trading charts Generative AI. Efficiency indicators illustrations Business and finance strategies shaped by insights from stock market trading charts
Free with trial Performance metrics outline icons collection. Evaluation, Analysis, KPIs, Scorecard, Metrics, Measurements, Analytics. Efficiency indicators vectors Performance metrics line icons collection. Evaluation, Analysis, KPIs, Scorecard, Metrics, Measurements, Analytics
Free with trial Analyzing predictive kpi dashboard on laptop for actionable business growth insights, Generated by AI. Efficiency indicators illustrations Analyzing predictive kpi dashboard on laptop for actionable business growth insights
Free with trial A vibrant illustration showcasing business performance metrics through colorful bar graphs and icons, Great business performance, unimpressive illustration. Efficiency indicators vectors A vibrant illustration showcasing business performance metrics through colorful bar graphs and icons, Great business performance
Free with trial Investors analyze data on laptops to evaluate growth strategies and monitor investment capital progress, Investors use laptops to track growth, invest capital, and analyze profit graphs. Efficiency indicators vectors Investors analyze data on laptops to evaluate growth strategies and monitor investment capital progress, Investors use laptops to
Free with trial Data analysis reveals flat trends with targets highlighted, representing performance metrics over time, Analyst data and time targets are trending flat. Efficiency indicators vectors Data analysis reveals flat trends with targets highlighted, representing performance metrics over time, Analyst data and time
Free with trial Energy efficiency, sustainability, renewable energy, home improvement, electricity usage, power saving. Light bulb and house with percentage indicators. Energy efficiency and sustainability ideas. Efficiency indicators vectors Energy Efficiency Concept with Light Bulb, House, and Percentage Indicators for Sustainability Ideas. Energy efficiency, sustainability, renewable energy, home. Energy efficiency, sustainability, renewable energy, home improvement, electricity usage, power saving. Light bulb and house with percentage indicators. Energy efficiency and sustainability ideas
Free with trial A technical measurement scale illustrates sample-to-detector distance with clearly marked efficiency sections, featuring a vertical axis labeled 100 cm, horizontal axes at 200 cm and 450 cm, three vertical bars indicating angular positions, color-coded indicators including orange and red dots, a black rectangular device representation with detection points, and a downward red arrow emphasizing. Efficiency indicators illustrations Scientific measurement scale showing sample-to-detector distance with efficiency indicators and labeled segments for experimental. A technical measurement scale illustrates sample-to-detector distance with clearly marked efficiency sections, featuring a vertical axis labeled 100 cm, horizontal axes at 200 cm and 450 cm, three vertical bars indicating angular positions, color-coded indicators including orange and red dots, a black rectangular device representation with detection points, and a downward red arrow emphasizing
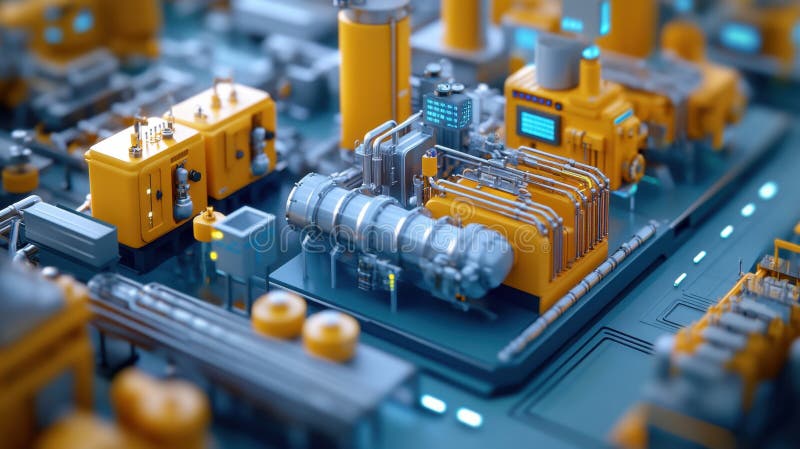
Free with trial Lean Manufacturing, A 3D visualization of a lean manufacturing process featuring efficiency indicators to enhance productivity, Lean Manufacturing. Efficiency indicators illustrations Lean Manufacturing, A 3D visualization of a lean manufacturing process featuring efficiency indicators to enhance productivity
Free with trial Lean Manufacturing, A 3D visualization of a lean manufacturing process featuring efficiency indicators to enhance productivity, Lean Manufacturing. Efficiency indicators illustrations Lean Manufacturing, A 3D visualization of a lean manufacturing process featuring efficiency indicators to enhance productivity
Free with trial Lean Manufacturing, A 3D visualization of a lean manufacturing process featuring efficiency indicators to enhance productivity, Lean Manufacturing. Efficiency indicators illustrations Lean Manufacturing, A 3D visualization of a lean manufacturing process featuring efficiency indicators to enhance productivity
Free with trial Lean Manufacturing, A 3D visualization of a lean manufacturing process featuring efficiency indicators to enhance productivity, Lean Manufacturing. Efficiency indicators illustrations Lean Manufacturing, A 3D visualization of a lean manufacturing process featuring efficiency indicators to enhance productivity
Free with trial Lean Manufacturing, A 3D visualization of a lean manufacturing process featuring efficiency indicators to enhance productivity, Lean Manufacturing. Efficiency indicators illustrations Lean Manufacturing, A 3D visualization of a lean manufacturing process featuring efficiency indicators to enhance productivity
Free with trial Lean Manufacturing, A 3D visualization of a lean manufacturing process featuring efficiency indicators to enhance productivity, Lean Manufacturing. Efficiency indicators illustrations Lean Manufacturing, A 3D visualization of a lean manufacturing process featuring efficiency indicators to enhance productivity
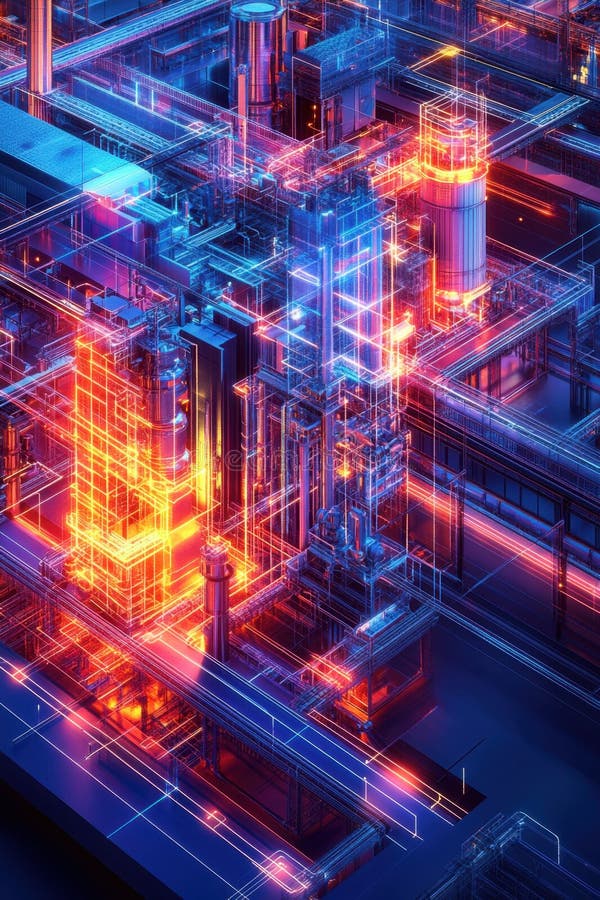
Free with trial Digital Workflow, A streamlined digital process featuring clear efficiency indicators and smooth operations, enhanced by, Digital Workflow. Efficiency indicators illustrations Digital Workflow, A streamlined digital process featuring clear efficiency indicators and smooth operations, enhanced by
Free with trial Digital Workflow, A streamlined digital process featuring clear efficiency indicators and smooth operations, enhanced by, Digital Workflow. Efficiency indicators illustrations Digital Workflow, A streamlined digital process featuring clear efficiency indicators and smooth operations, enhanced by
Free with trial A vibrant vector illustration of a scooter accompanied by speed lines, indicating swift movement. It also features three circular indicators, possibly representing speed, efficiency, or settings. Ideal for themes of urban transport, delivery services, and smart mobility. Clean line art and appealing color palette make it versatile for various design projects, vector design Generative AI. Efficiency indicators vectors Scooter with Speed Lines and Efficiency Indicators, vector design Generative AI. A vibrant vector illustration of a scooter accompanied by speed lines, indicating swift movement. It also features three circular indicators, possibly representing speed, efficiency, or settings. Ideal for themes of urban transport, delivery services, and smart mobility. Clean line art and appealing color palette make it versatile for various design projects, vector design Generative AI
Free with trial A graphic showing smartphone battery life with colorful indicators and levels of charge efficiency Smartphone battery life, flat image. Efficiency indicators vectors A graphic showing smartphone battery life with colorful indicators and levels of charge efficiency Smartphone battery life, flat
Free with trial Business professional analyzing digital indicators of energy efficiency trends with symbols for renewable energy and sustainability concepts Quark. Efficiency indicators illustrations Business professional analyzing digital indicators of energy efficiency trends with symbols for renewable energy and
Free with trial A dashboard displaying key performance indicators for supply chain efficiency such as ontime delivery and inventory turnover.. Vector illustration. Efficiency indicators illustrations A dashboard displaying key performance indicators for supply chain efficiency such as ontime delivery and inventory
Free with trial Lean Manufacturing, A 3D visualization of a lean manufacturing process featuring efficiency indicators to enhance productivity, Lean Manufacturing. Efficiency indicators illustrations Lean Manufacturing, A 3D visualization of a lean manufacturing process featuring efficiency indicators to enhance productivity
Free with trial Digital Workflow, A streamlined digital process featuring clear efficiency indicators and smooth operations, enhanced by, Digital Workflow. Efficiency indicators illustrations Digital Workflow, A streamlined digital process featuring clear efficiency indicators and smooth operations, enhanced by
Free with trial Digital Workflow, A streamlined digital process featuring clear efficiency indicators and smooth operations, enhanced by, Digital Workflow. Efficiency indicators illustrations Digital Workflow, A streamlined digital process featuring clear efficiency indicators and smooth operations, enhanced by
Free with trial Digital Workflow, A streamlined digital process featuring clear efficiency indicators and smooth operations, enhanced by, Digital Workflow. Efficiency indicators illustrations Digital Workflow, A streamlined digital process featuring clear efficiency indicators and smooth operations, enhanced by