Free with trial Crude oil barrel price growing. Energy decrease graphic illustrations Global oil price. Crude oil barrel price growing
Free with trial Decrease colorful stick diagram icon with reflection II. Energy decrease graphic vectors Decrease colorful stick diagram II. Decrease colorful stick diagram icon with reflection II.
Free with trial 3d render image with decreasing graph of real estate. Energy decrease graphic illustrations Decreasing graph of real estate
Free with trial Battery lithium energy storage price goes down drop decrease cheap in global commodity market trade export transaction vector. Energy decrease graphic vectors Battery lithium energy storage price goes down drop decrease cheap in global commodity market trade export transaction
Free with trial Energy icon set. It included electric, power, charge, ev, and more icons. Energy decrease graphic vectors Energy icon set. It included electric, power, charge, and more icons.
Free with trial Net zero carbon footprint icon vector emissions free no atmosphere pollution CO2 neutral stamp for graphic design, logo, website, social media, mobile app, UI. Energy decrease graphic vectors Net zero carbon footprint icon vector emissions free no atmosphere pollution CO2 neutral stamp for graphic design, logo, website
Free with trial Net zero carbon footprint icon vector emissions free no atmosphere pollution CO2 neutral stamp for graphic design, logo, website, social media, mobile app, UI. Energy decrease graphic vectors Net zero carbon footprint icon vector emissions free no atmosphere pollution CO2 neutral stamp for graphic design, logo, website
Free with trial Net zero carbon footprint icon vector emissions free no atmosphere pollution CO2 neutral stamp for graphic design, logo, website, social media, mobile app, UI. Energy decrease graphic vectors Net zero carbon footprint icon vector emissions free no atmosphere pollution CO2 neutral stamp for graphic design, logo, website
Free with trial Net zero carbon footprint icon vector emissions free no atmosphere pollution CO2 neutral stamp for graphic design, logo, website, social media, mobile app, UI. Energy decrease graphic vectors Net zero carbon footprint icon vector emissions free no atmosphere pollution CO2 neutral stamp for graphic design, logo, website
Free with trial Petroleum and oil prices business graphic design, vector illustration eps10. Energy decrease graphic vectors Petroleum and oil prices business
Free with trial Reducing CO2 emissions icon vector stop climate change sign for graphic design, logo, website, social media, mobile app, ui illustration. Energy decrease graphic vectors Reducing CO2 emissions icon vector stop climate change sign for graphic design, logo, website, social media, mobile app, ui
Free with trial Reducing CO2 emissions icon vector stop climate change sign for graphic design, logo, website, social media, mobile app, ui illustration. Energy decrease graphic vectors Reducing CO2 emissions icon vector stop climate change sign for graphic design, logo, website, social media, mobile app, ui
Free with trial Petroleum oil industry icon illustration graphic design. Energy decrease graphic illustrations Petroleum oil industry
Free with trial Crude oil diagram, barrel price. Energy decrease graphic illustrations Crude oil diagram
Free with trial Falling business graph with magnet. Energy decrease graphic illustrations Falling business diagram. Falling business graph with magnet.
Free with trial Falling business graph with magnet. Energy decrease graphic illustrations Falling business diagram. Falling business graph with magnet.
Free with trial Carbon capture storage sequestration technology isometric composition with flowchart of isolated operational procedures icons with text vector illustration. Energy decrease graphic illustrations Carbon Capture Storage Flowchart. Carbon capture storage sequestration technology isometric composition with flowchart of isolated operational procedures icons with text vector illustration
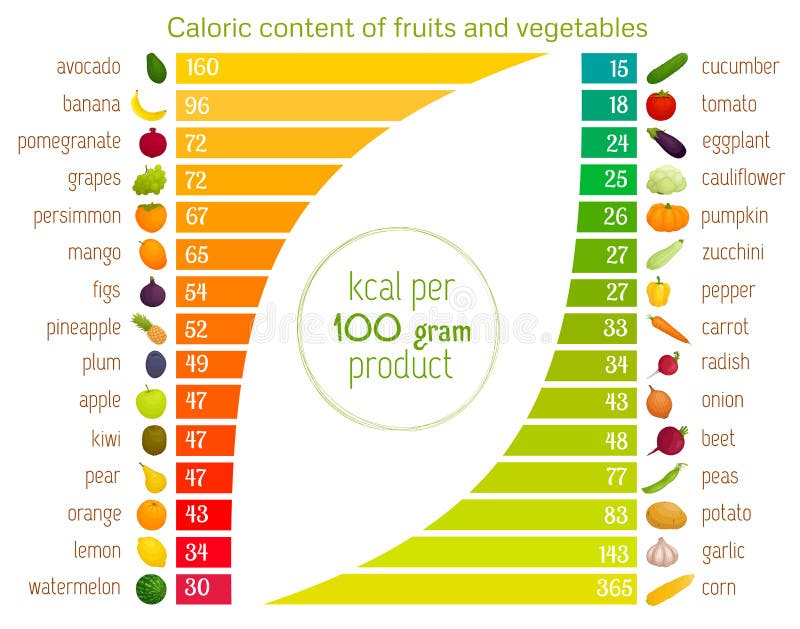
Free with trial Caloric content of vegetables and fruits in ascending order. Informative visual collage about healthy nutrition. Vector infographics and a table with values. Energy decrease graphic vectors Infographics on the calorie content of food. Vector. Caloric content of vegetables and fruits in ascending order. Informative visual collage about healthy nutrition. Vector infographics and a table with values.
Free with trial Carbon capture storage sequestration technology isometric composition with isolated view of factory facilities for capturing co2 vector illustration. Energy decrease graphic vectors Carbon Storage Facility Composition. Carbon capture storage sequestration technology isometric composition with isolated view of factory facilities for capturing co2 vector illustration
Free with trial Reduce carbon footprint grunge rubber stamp on white background, vector illustration. Energy decrease graphic vectors Reduce carbon footprint grunge rubber stamp
Free with trial Direction of inflation and deflation of the red and green neon on a black background. Energy decrease graphic vectors Direction of inflation and deflation
Free with trial Oil barrels on Decline chart diagram and red down arrow background vector. Energy decrease graphic vectors Oil barrels on Decline chart diagram and red down arrow
Free with trial Carbon capture storage sequestration technology isometric set of isolated compositions with text industrial icons and vehicles vector illustration. Energy decrease graphic vectors Isometric Carbon Capture Compositions. Carbon capture storage sequestration technology isometric set of isolated compositions with text industrial icons and vehicles vector illustration
Free with trial Oil price fall graph with red down arrow. vector illustration. Energy decrease graphic vectors Oil price fall graph with red down arrow
Free with trial Oil industry crisis concept. Oil barrels with crude oil 6 month price chart and an arrow pointing downwards on background. Vector Illustration. Square format. Energy decrease graphic vectors Oil crisis concept. Oil industry crisis concept. Oil barrels with crude oil 6 month price chart and an arrow pointing downwards on background. Vector Illustration. Square format
Free with trial This vector illustration depicts the concept of high entropy and low entropy states, showcasing the differences in molecular disorder and order. The design features a clean white background, making it an ideal educational tool for explaining thermodynamic principles. High entropy is represented by a disordered state with increased molecular movement, while low entropy is shown as an ordered state with less molecular chaos. This visual aid is perfect for classroom presentations, scientific publications, and educational materials, providing a clear and concise representation of entropy. The vector format ensures high-quality and scalability for various applications. Energy decrease graphic vectors Illustration of High Entropy and Low Entropy States in a White Background. This vector illustration depicts the concept of high entropy and low entropy states, showcasing the differences in molecular disorder and order. The design features a clean white background, making it an ideal educational tool for explaining thermodynamic principles. High entropy is represented by a disordered state with increased molecular movement, while low entropy is shown as an ordered state with less molecular chaos. This visual aid is perfect for classroom presentations, scientific publications, and educational materials, providing a clear and concise representation of entropy. The vector format ensures high-quality and scalability for various applications.
Free with trial Falling oil prices. arrow down dollar. flat vector illustration. Energy decrease graphic vectors Falling oil prices. arrow down dollar.
Free with trial Appetite and hunger hormones. Ghrelin and leptin in the human body. Human endocrine system, metabolism, hunger and satiety concept. Medical poster flat vector illustration for education. Energy decrease graphic vectors Hunger appetite hormones. Appetite and hunger hormones. Ghrelin and leptin in the human body. Human endocrine system, metabolism, hunger and satiety concept. Medical poster flat vector illustration for education
Free with trial Oil pump and decline graph against the background of the US night map. Fall in the value of American oil. Concept - a crisis in the raw materials industry. Fall of stocks. Decrease in oil revenues. 3D Illustration. Energy decrease graphic illustrations Oil pump and decline graph against the background of the US night map. Fall in the value of American oil. Concept - a crisis in
Free with trial Carbon Dioxide CO2 Charts and Graphs colored concept vector icons set or design elements collection. Energy decrease graphic vectors Carbon Dioxide CO2 Charts and Graphs colored vector icons. Carbon Dioxide CO2 Charts and Graphs colored concept vector icons set or design elements collection
Free with trial Kilocalorie emblem, kcal reduction. Zero calories diet program packaging. Vector stock illustration. Energy decrease graphic vectors Kilocalorie emblem, kcal reduction. Zero calories diet program packaging. Vector stock illustration.
Free with trial Coal price goes down drop decrease cheap in global commodity market trade export transaction energy stone mining vector. Energy decrease graphic vectors Coal price goes down drop decrease cheap in global commodity market trade export transaction energy stone mining
Free with trial Natural gas LPG LNG energy price goes down drop decrease cheap in global commodity market trade export transaction vector. Energy decrease graphic illustrations Natural gas LPG LNG energy price goes down drop decrease cheap in global commodity market trade export transaction
Free with trial This graphic illustration depicts the concepts of stress, calmness, energy level, and mental load. The image features four distinct sections, each representing one of these aspects. The stress section is represented by a gauge with a needle pointing to a high level, indicating a sense of anxiety or overwhelm. The calmness section features a wavy line, symbolizing a peaceful and serene state. The energy level section is illustrated with a bar graph, showing a decrease in energy. The mental load section is represented by a gauge with a needle pointing to a high level, indicating a heavy mental burden. This illustration can be used to represent the importance of maintaining a balance between stress and calmness, and the impact it has on our mental health and well-being. Energy decrease graphic vectors Mental health A graphic illustration of stress, calmness, energy level, and mental load. This graphic illustration depicts the concepts of stress, calmness, energy level, and mental load. The image features four distinct sections, each representing one of these aspects. The stress section is represented by a gauge with a needle pointing to a high level, indicating a sense of anxiety or overwhelm. The calmness section features a wavy line, symbolizing a peaceful and serene state. The energy level section is illustrated with a bar graph, showing a decrease in energy. The mental load section is represented by a gauge with a needle pointing to a high level, indicating a heavy mental burden. This illustration can be used to represent the importance of maintaining a balance between stress and calmness, and the impact it has on our mental health and well-being.
Free with trial This clean vector graphic depicts a vertical thermometer with a red liquid column indicating a downward trend. A red arrow points toward a snowflake icon, symbolizing cooling weather or a decrease in thermal energy. The design uses a minimalist style with clear numerical markings against a plain white background, suitable for weather reports or climate data visualization. Energy decrease graphic vectors A graphic illustration of a thermometer showing a drop in temperature levels. This clean vector graphic depicts a vertical thermometer with a red liquid column. This clean vector graphic depicts a vertical thermometer with a red liquid column indicating a downward trend. A red arrow points toward a snowflake icon, symbolizing cooling weather or a decrease in thermal energy. The design uses a minimalist style with clear numerical markings against a plain white background, suitable for weather reports or climate data visualization
Free with trial A person's hands hover over a laptop displaying a vibrant green home energy efficiency graphic with a bar chart showing energy consumption levels A, B, and G. The overall tone is dark and moody. Energy decrease graphic illustrations Dark toned image of hands interacting with a glowing green home energy efficiency graphic. A person's hands hover over a laptop displaying a vibrant green home energy efficiency graphic with a bar chart showing energy consumption levels A, B, and G. The overall tone is dark and moody
Free with trial Battery Charge Cycle Vector Graphic Decreasing Energy Level with Arrow Indicator. Energy decrease graphic vectors Battery Charge Cycle Vector Graphic Decreasing Energy Level with Arrow Indicator
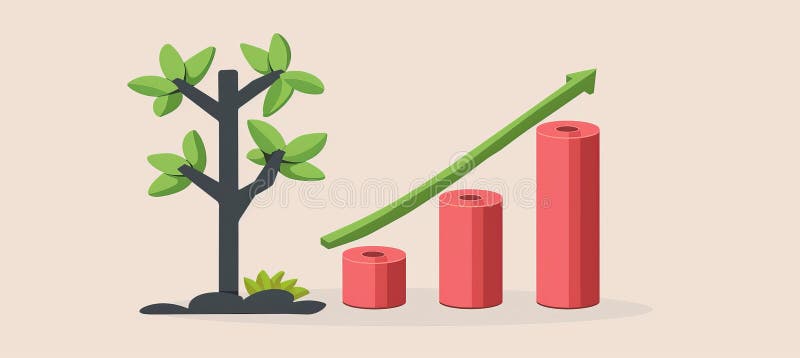
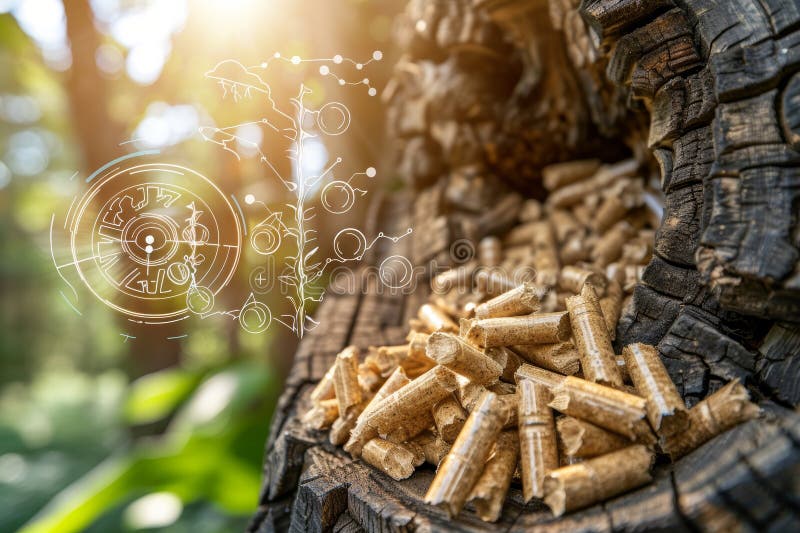
Free with trial Tree graphic with bar graph displaying decrease in carbon emissions from wood pellets, Generated by AI. Energy decrease graphic illustrations Tree graphic with bar graph displaying decrease in carbon emissions from wood pellets
Free with trial A minimalist black and white icon featuring a lightning bolt symbol within a circle. A jagged arrow, representing a downward trend or decline, originates from the top of the circle and points towards the bottom right. The lightning bolt is positioned to the left of the arrow's path. This graphic symbolizes concepts like energy loss, power decrease, economic downturn, or a negative trend in performance. Its clean design makes it suitable for various digital and print applications. Energy decrease graphic vectors Lightning Bolt Downward Trend Icon. A minimalist black and white icon featuring a lightning bolt symbol within a circle. A jagged arrow, representing a downward trend or decline, originates from the top of the circle and points towards the bottom right. The lightning bolt is positioned to the left of the arrow's path. This graphic symbolizes concepts like energy loss, power decrease, economic downturn, or a negative trend in performance. Its clean design makes it suitable for various digital and print applications.
Free with trial A minimalist line art icon representing eco-friendly energy. It features an electrical plug with a leaf symbol inside, connected by a wavy line to a downward-pointing arrow. This graphic symbolizes sustainable power, reduced energy usage, and environmental consciousness in electricity consumption. Ideal for concepts related to green energy, conservation, and responsible power management. Energy decrease graphic vectors Eco-Friendly Energy Consumption Icon. A minimalist line art icon representing eco-friendly energy. It features an electrical plug with a leaf symbol inside, connected by a wavy line to a downward-pointing arrow. This graphic symbolizes sustainable power, reduced energy usage, and environmental consciousness in electricity consumption. Ideal for concepts related to green energy, conservation, and responsible power management.
Free with trial A dynamic black illustration depicts a lightning bolt with emanating lines and a downward-pointing arrow, symbolizing energy discharge, power reduction, or data download against a clean white backdrop. Energy decrease graphic vectors Powerful Energy Download: Black Graphic Symbol on White Background. A dynamic black illustration depicts a lightning bolt with emanating lines and a downward-pointing arrow, symbolizing energy discharge, power reduction, or data download against a clean white backdrop.
Free with trial A black and white graphic illustration depicts three stylized clouds. Each cloud contains the text "CO2" with the "2" as a subscript. Below each cloud, a downward-pointing arrow is shown, indicating a reduction or decrease. The clouds are connected by lines, suggesting a process or flow. The overall design is simple and symbolic, representing the concept of carbon dioxide reduction. Energy decrease graphic vectors Carbon dioxide reduction clouds with downward arrows decrease emission. A black and white graphic illustration depicts three stylized clouds. Each cloud contains the text "CO2" with the "2" as a subscript. Below each cloud, a downward-pointing arrow is shown, indicating a reduction or decrease. The clouds are connected by lines, suggesting a process or flow. The overall design is simple and symbolic, representing the concept of carbon dioxide reduction
Free with trial A clean and informative energy report summary displaying winter usage data. The graphic shows a 15% decrease in energy consumption compared to the previous year, indicated by a green checkmark. Ideal for illustrating energy efficiency, sustainability, or cost savings. Energy decrease graphic illustrations Energy Report Summary with Winter Usage Statistics. A clean and informative energy report summary displaying winter usage data. The graphic shows a 15% decrease in energy consumption compared to the previous year, indicated by a green checkmark. Ideal for illustrating energy efficiency, sustainability, or cost savings
Free with trial Red arrow crashes through wall. Abstract concept of energy burst, destruction, force, impact. Dynamic motion, velocity. Explosion, shatter, damage. Graphic design element business. Energy decrease graphic illustrations Red arrow crashes through wall. Abstract concept of energy burst, destruction, force, impact. Dynamic motion, velocity.
Free with trial Gradual decrease in life indicator. Pixel heart, health bar level lowering, retro video game symbol, love and romantic, 8 bit arcade symbol, cartoon flat isolated illustration, nowaday vector set. Energy decrease graphic vectors Gradual decrease in life indicator. Pixel heart, health bar level lowering, retro video game symbol, love and romantic
Free with trial Dynamic CO2 reduction icon symbolizes environmental sustainability and carbon footprint decrease for eco-conscious solutions. Energy decrease graphic illustrations Dynamic CO2 reduction icon symbolizes environmental sustainability and carbon footprint decrease for eco-conscious solutions
Free with trial Reduced emissions soft blue concept icon. Decrease in release of greenhouse gases. Renewable power benefit. Round shape line illustration. Abstract idea. Graphic design. Easy to use in presentation. Energy decrease graphic vectors Reduced emissions soft blue concept icon
Free with trial Reduced emissions multi color concept icon. Decrease in release of greenhouse gases. Renewable power benefit. Round shape line illustration. Abstract idea. Graphic design. Easy to use in presentation. Energy decrease graphic vectors Reduced emissions multi color concept icon
Free with trial A minimalist, stylized icon representing a power line pylon with electrical wires. A prominent teal downward arrow is positioned directly below the pylon, suggesting a decrease in power, energy consumption, or a related concept. The clean lines and simple color palette make it suitable for various digital and print applications related to energy, utilities, economics, or technical diagrams. Energy decrease graphic vectors Power Line Icon with Downward Arrow. A minimalist, stylized icon representing a power line pylon with electrical wires. A prominent teal downward arrow is positioned directly below the pylon, suggesting a decrease in power, energy consumption, or a related concept. The clean lines and simple color palette make it suitable for various digital and print applications related to energy, utilities, economics, or technical diagrams.
Free with trial This minimalist illustration depicts a downward trending graph superimposed with two stylized power pylons. A vibrant green leaf is positioned near the end of the graph, symbolizing the shift towards renewable or sustainable energy sources. The composition suggests a decline in traditional energy infrastructure or consumption, with an implied transition to eco-friendly alternatives. Ideal for concepts related to energy policy, environmental impact, economic shifts in the power sector, and the future of electricity. Energy decrease graphic vectors Green Energy Transition and Power Grid Decline Graph. This minimalist illustration depicts a downward trending graph superimposed with two stylized power pylons. A vibrant green leaf is positioned near the end of the graph, symbolizing the shift towards renewable or sustainable energy sources. The composition suggests a decline in traditional energy infrastructure or consumption, with an implied transition to eco-friendly alternatives. Ideal for concepts related to energy policy, environmental impact, economic shifts in the power sector, and the future of electricity.
Free with trial Oil price drop and energy crisis concept. Retro halftone collage of oil rig with falling arrow on red sun background. Vintage pop art vector illustration for fuel market crash and economic recession. Energy decrease graphic vectors Oil price drop and energy crisis concept. Retro halftone collage of oil rig with falling arrow on red sun background. Vintage pop
Free with trial A minimalist, black and white line art icon depicting a swirling vortex or spiral. The design features concentric, curved lines that decrease in size towards the center, creating a sense of motion and depth. This versatile graphic can represent concepts like energy, movement, focus, or abstract patterns. Its clean, modern aesthetic makes it suitable for a wide range of applications, from web design and branding to educational materials and scientific illustrations. Energy decrease graphic vectors Abstract Swirl Icon. A minimalist, black and white line art icon depicting a swirling vortex or spiral. The design features concentric, curved lines that decrease in size towards the center, creating a sense of motion and depth. This versatile graphic can represent concepts like energy, movement, focus, or abstract patterns. Its clean, modern aesthetic makes it suitable for a wide range of applications, from web design and branding to educational materials and scientific illustrations.
Free with trial This set of four flat design icons visually represents key concepts related to climate change and sustainable energy. It includes a thermometer with a rising graph indicating global warming, a stylized Earth with continents and oceans, a young plant sprout symbolizing growth and nature, and a wind turbine representing renewable energy. These icons are ideal for illustrating environmental issues, conservation efforts, and the transition to clean power sources in presentations, articles, and educational materials. Energy decrease graphic illustrations Climate Change and Green Energy Icons. This set of four flat design icons visually represents key concepts related to climate change and sustainable energy. It includes a thermometer with a rising graph indicating global warming, a stylized Earth with continents and oceans, a young plant sprout symbolizing growth and nature, and a wind turbine representing renewable energy. These icons are ideal for illustrating environmental issues, conservation efforts, and the transition to clean power sources in presentations, articles, and educational materials.
Free with trial Battery status set. Power level icon. Energy progress Vector. Outline charge symbol. Manual vector only. No autotrace used. EPS 10. Energy decrease graphic vectors Battery status set. Power level icon. Energy progress Vector. Outline charge symbol. Manual vector only. No autotrace used
Free with trial LPG Liquified Petroleum Gas liquid commodity price in global market going down decrease low crisis in international transaction trading market vector. Energy decrease graphic vectors LPG Liquified Petroleum Gas liquid commodity price in global market going down decrease low crisis in international
Free with trial LNG Liquified Natural Gas price in global market going down decrease low international transaction trading commodity market vector. Energy decrease graphic vectors LNG Liquified Natural Gas price in global market going down decrease low international transaction trading commodity
Free with trial Set line Financial growth decrease, Light bulb, Factory and Delivery tracking icon. Vector. Energy decrease graphic illustrations Set line Financial growth decrease, Light bulb, Factory and Delivery tracking icon. Vector
Free with trial An illustration depicting periodic table trends, including ionization energy, electronegativity, metallic character, atomic radius, and electron affinity, for education. Energy decrease graphic vectors Vector art of periodic table trends with ionization energy, electronegativity, and metallic character. An illustration depicting periodic table trends, including ionization energy, electronegativity, metallic character, atomic radius, and electron affinity, for education
Free with trial A captivating abstract design featuring a black dashed spiral pattern against a clean white background. The lines gradually decrease in length and spacing towards the center, creating a mesmerizing optical illusion of depth and motion. This dynamic and modern graphic evokes a sense of rotation, energy, and a hypnotic effect. Ideal for backgrounds, web design, presentations, technology-related themes, or any project requiring a sleek, contemporary, and visually engaging abstract element. Energy decrease graphic vectors Abstract Dashed Spiral Hypnotic Pattern. A captivating abstract design featuring a black dashed spiral pattern against a clean white background. The lines gradually decrease in length and spacing towards the center, creating a mesmerizing optical illusion of depth and motion. This dynamic and modern graphic evokes a sense of rotation, energy, and a hypnotic effect. Ideal for backgrounds, web design, presentations, technology-related themes, or any project requiring a sleek, contemporary, and visually engaging abstract element.
Free with trial Power Symbol with Lightning Bolt and Downward Arrow � Representation of Energy Reduction, Electrical Issues, and Decreasing Power Supply. Energy decrease graphic vectors . Power Symbol with Lightning Bolt and Downward Arrow � Representation of Energy Reduction, Electrical Issues, and Decreasing Power Supply
Free with trial A minimalist and modern abstract background featuring a single, smooth orange wave flowing across a warm gradient. The background transitions seamlessly from a soft coral or reddish-orange at the top to a gentle peach tone at the bottom. This clean and elegant design evokes a sense of movement, rhythm, and gentle energy. It's a versatile graphic perfect for website headers, presentation slides, corporate branding, digital art, banners, and other creative projects that require a simple yet sophisticated and warm aesthetic with ample copy space. Energy decrease graphic illustrations Abstract Wavy Line on Warm Gradient Background. A minimalist and modern abstract background featuring a single, smooth orange wave flowing across a warm gradient. The background transitions seamlessly from a soft coral or reddish-orange at the top to a gentle peach tone at the bottom. This clean and elegant design evokes a sense of movement, rhythm, and gentle energy. It's a versatile graphic perfect for website headers, presentation slides, corporate branding, digital art, banners, and other creative projects that require a simple yet sophisticated and warm aesthetic with ample copy space.
Free with trial This minimalist graphic illustration features a stylized thermometer centered on a plain background. A bold red arrow curves downward next to the instrument, clearly symbolizing a decrease in temperature or a cooling process. The clean lines and simple color palette make this an effective visual representation for weather reports, climate control systems, or scientific data visualization. Energy decrease graphic vectors A flat vector icon showing a thermometer with a downward arrow indicating cooling. This minimalist graphic illustration features a stylized thermometer centered on a plain background. A bold red arrow curves downward next to the instrument, clearly symbolizing a decrease in temperature or a cooling process. The clean lines and simple color palette make this an effective visual representation for weather reports, climate control systems, or scientific data visualization
Free with trial Stylized graphic featuring a balance scale, security shield, lightning bolts, and a rising bar chart. Suitable for illustrating concepts of risk management, comparison, energy dynamics, or financial analysis in corporate presentations or editorial features. Energy decrease graphic illustrations Iconic Balance Scale With Security And Growth Symbols. Stylized graphic featuring a balance scale, security shield, lightning bolts, and a rising bar chart. Suitable for illustrating concepts of risk management, comparison, energy dynamics, or financial analysis in corporate presentations or editorial features.
Free with trial This graphic features three stylized orange flame icons, presented in increasing sizes from left to right. Each flame has a distinct, simplified shape with a bright orange gradient and a darker orange outline, set against a clean white background. This visual representation can symbolize growth, intensity, power, or different levels of heat and energy. It's ideal for use in web design, infographics, presentations, or any project requiring a clear and versatile fire graphic. Energy decrease graphic vectors Three Orange Flame Icons of Varying Sizes. This graphic features three stylized orange flame icons, presented in increasing sizes from left to right. Each flame has a distinct, simplified shape with a bright orange gradient and a darker orange outline, set against a clean white background. This visual representation can symbolize growth, intensity, power, or different levels of heat and energy. It's ideal for use in web design, infographics, presentations, or any project requiring a clear and versatile fire graphic.
Free with trial Blue oil barrels with a graphic orange arrow showing a significant decrease in market prices or production. Represents economic decline, energy costs, and global supply issues. With copy space. Energy decrease graphic illustrations Declining oil prices illustrated by barrels and downward market trend. Blue oil barrels with a graphic orange arrow showing a significant decrease in market prices or production. Represents economic decline, energy costs, and global supply issues. With copy space.
Free with trial Doodle style battery indicator showing reducing energy and decreasing power charge status. Energy decrease graphic vectors Doodle style battery indicator showing reducing energy and decreasing power charge status
Free with trial Icons indicating the level of battery charge, portraying a range of power levels from full to low energy, for use in digital user interfaces. Energy decrease graphic vectors Battery state of charge icons illustrating varying power levels, from full to low energy, for digital user interfaces. Icons indicating the level of battery charge, portraying a range of power levels from full to low energy, for use in digital user interfaces
Free with trial Crude oil price decrease Icon vector logo set collection for web app ui. Energy decrease graphic vectors Crude oil price decrease Icon
Free with trial Energy reduction icon Vector symbol or sign set collection in black and white outline. Energy decrease graphic vectors Energy reduction flat line icon set. Energy reduction Thin line illustration vector. Energy reduction icon Vector symbol or sign set collection in black and white outline
Free with trial Energy reduction icon logo sign vector outline in black and white color. Energy decrease graphic vectors Energy reduction icon symbol set collection. Energy reduction simple vector sign bundle. Energy reduction icon logo sign vector outline in black and white color
Free with trial Reduce energy usage, in line design, green. Reduce, energy, usage, conservation, efficiency, sustainable, power on white background vector. Reduce energy usage editable stroke icon. Energy decrease graphic vectors Reduce energy usage, in line design, green. Reduce, energy, usage, conservation, efficiency, sustainable, power on white
Free with trial Crude oil price decrease Icon logo sign vector outline in black and white color. Energy decrease graphic vectors Crude oil price decrease Icon collection of outline thin line symbol or sign. Crude oil price decrease Icon logo sign vector outline in black and white color
Free with trial Flame and arrow icon. Fire symbol with downward arrow. Heat reduction concept. Abstract vector graphic. EPS 10. Energy decrease graphic vectors Flame and arrow icon. Fire symbol with downward arrow. Heat reduction concept. Abstract vector graphic.
Free with trial Reduce energy usage, in line design. Reduce, energy, usage, conservation, efficiency, sustainable, power on white background vector. Reduce energy usage editable stroke icon. Energy decrease graphic vectors Reduce energy usage, in line design. Reduce, energy, usage, conservation, efficiency, sustainable, power on white
Free with trial Concept Environmental Conservation, Carbon Emissions Reduction, Green Symbolism Visual Representation Green Target Symbolizing Decrease in Carbon Emissions Against a Backdrop of Lush Greenery. Energy decrease graphic illustrations Visual Representation: Green Target Symbolizing Decrease in Carbon Emissions Against a Backdrop of. Concept Environmental Conservation, Carbon Emissions Reduction, Green Symbolism Visual Representation Green Target Symbolizing Decrease in Carbon Emissions Against a Backdrop of Lush Greenery
Free with trial Tree illustration with bar graph displaying decrease in carbon emissions from wood pellets, Generated by AI. Energy decrease graphic illustrations Tree illustration with bar graph displaying decrease in carbon emissions from wood pellets
Free with trial Tree illustration with bar graph displaying decrease in carbon emissions from wood pellets, Generated by AI. Energy decrease graphic illustrations Tree illustration with bar graph displaying decrease in carbon emissions from wood pellets
Free with trial Tree illustration with bar graph displaying decrease in carbon emissions from wood pellets, Generated by AI. Energy decrease graphic illustrations Tree illustration with bar graph displaying decrease in carbon emissions from wood pellets
Free with trial A simple vector illustration of a battery icon showing a critically low power level. The colorful bars decrease in size, symbolizing energy depletion, exhaustion, or an approaching deadline. Energy decrease graphic vectors Stylized Low Battery Charge Icon. A simple vector illustration of a battery icon showing a critically low power level. The colorful bars decrease in size, symbolizing energy depletion, exhaustion, or an approaching deadline