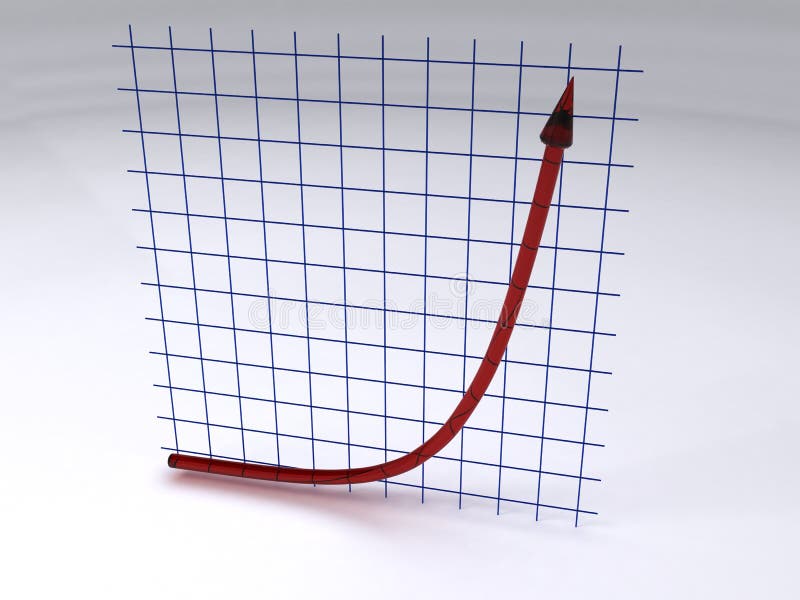
Free with trial Exponential curve is placed in front of a grid. Both are made of glass. Exponential function illustrations Exponential growth. Exponential curve is placed in front of a grid. Both are made of glass.
Free with trial Bar, chart, presentation, analysis, mathematics, exp, exponential, growth, function, glass, 3d, render, rendering, illustration. Exponential function illustrations Bar chart. Bar, chart, presentation, analysis, mathematics, exp, exponential, growth, function, glass, 3d, render, rendering, illustration
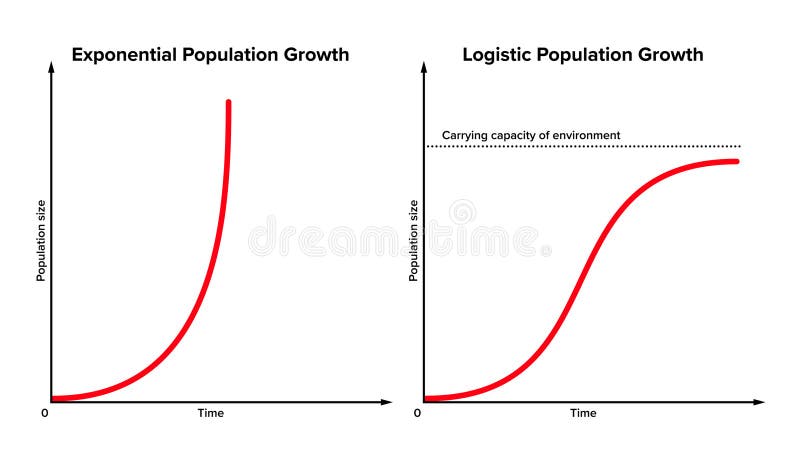
Free with trial Exponential versus logistic population growth. In reality, initial exponential growth is often not sustained forever. After some period, it will be slowed by external or environmental factors. Vector. Exponential function vectors Exponential versus logistic population growth
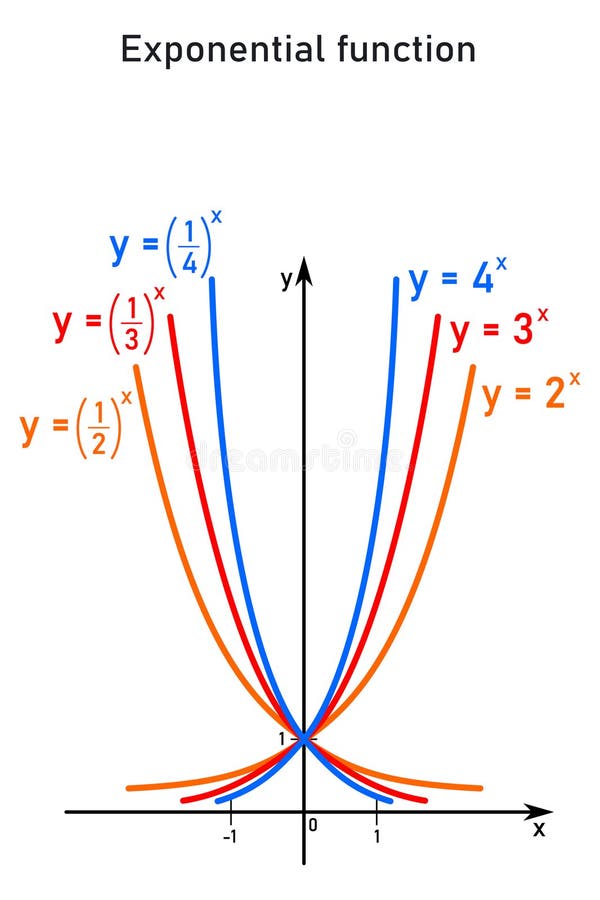
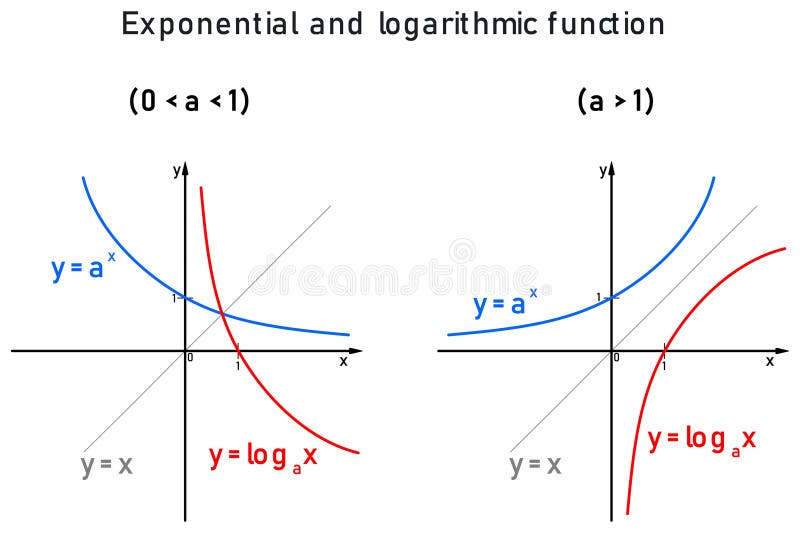
Free with trial Graphs of the exponential function on the number line, blue for base "a" from zero to one, red for base "a" greater than one. Exponential function illustrations Graphs of the exponential function on the number line
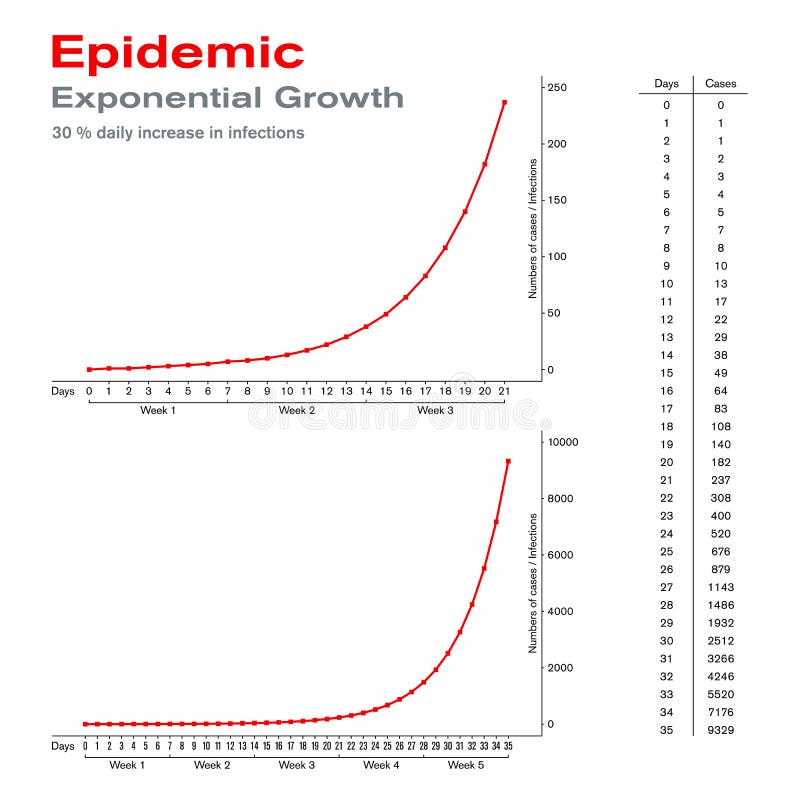
Free with trial Epidemic. Exponential growth. On the example of 30 percent daily increase in infections. Rapid spread and epidemic outbreak of a disease makes it clear how important early countermeasures are. Vector. Exponential function vectors Epidemic. Exponential growth with 30 percent daily increase in infections. Epidemic. Exponential growth. On the example of 30 percent daily increase in infections. Rapid spread and epidemic outbreak of a disease makes it clear how important early countermeasures are. Vector.
Free with trial Epidemic. Exponential growth. Rapid spread and epidemic outbreak of a disease to a large number of people in a short period of time. The number of cases increases exponentially. Illustration. Vector. Exponential function vectors Epidemic. Exponential growth. Rapid spread and epidemic outbreak of a disease
Free with trial Illustration with mathematical exponential growth chart and red arrow pointing up on dark black background over reflective surface. 3d illustration. Exponential function illustrations Mathematical exponential growth function. Illustration with mathematical exponential growth chart and red arrow pointing up on dark black background over reflective surface. 3d illustration
Free with trial Available in high-resolution and several sizes to fit the needs of your project. Exponential function vectors Exponential function graph. Available in high-resolution and several sizes to fit the needs of your project
Free with trial Exponential functions - color-coded graphs of six different functions on the coordinate axis - orange, red, blue. Exponential function illustrations Exponential functions - color-coded graphs of six different functions on the coordinate axis
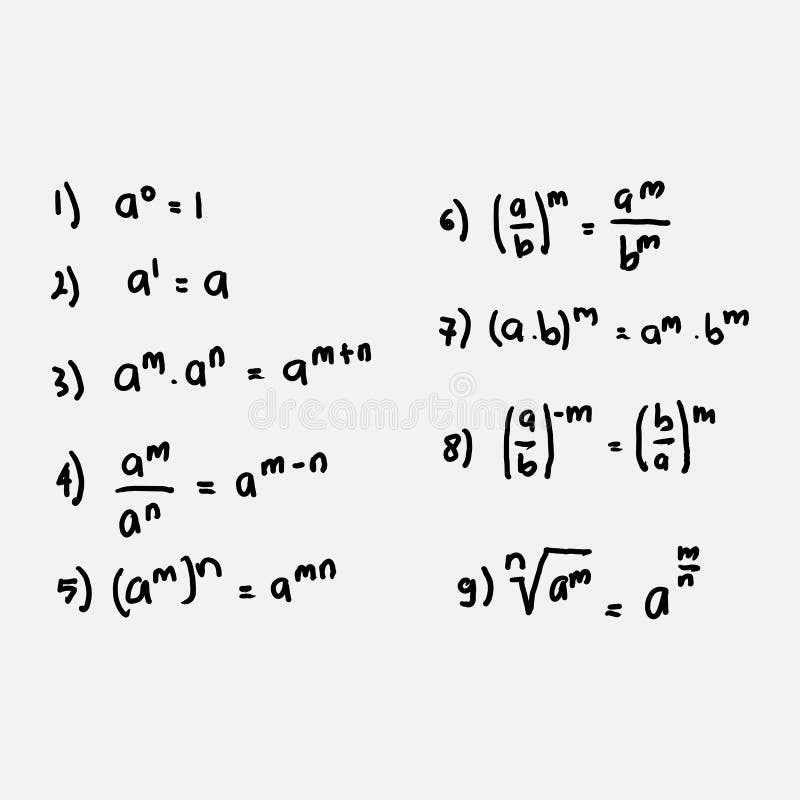
Free with trial Math formula. Characteristics of numbers to exponents written by hand. High level math. Chapter Exponential and root form. Exponential function vectors Math formula. Characteristics of numbers to exponents written by hand.
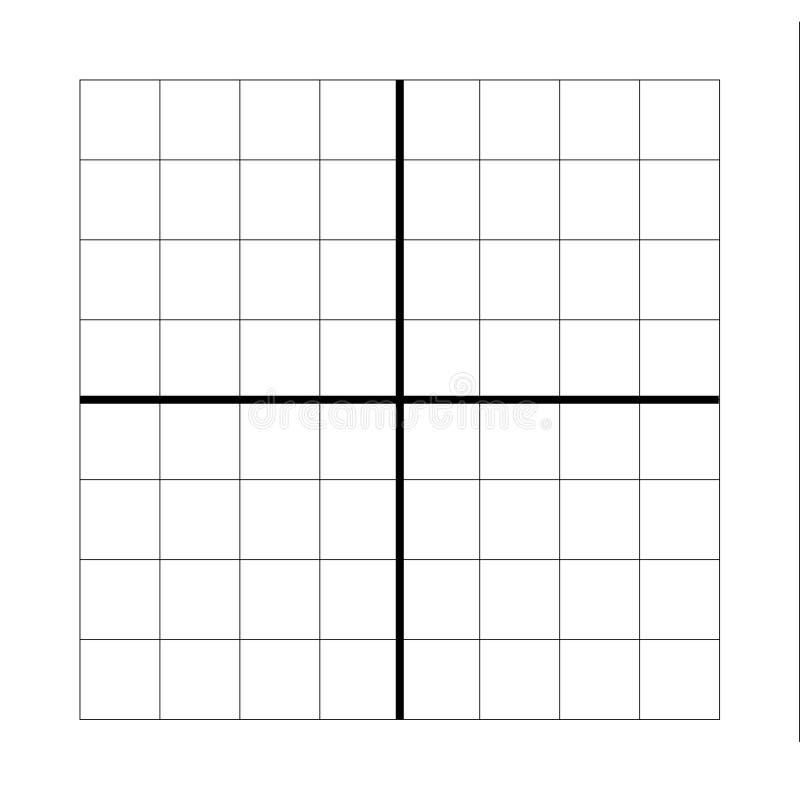
Free with trial Two math axis empty graphic for yours usage. Exponential function vectors Two math axis empty graphic for presentation. Two math axis empty graphic for yours usage
Free with trial Two math axis empty graphic for yours usage. Exponential function vectors Two axis empty graphic for yours drawing. two math axis empty graphic for yours usage
Free with trial Bar chart or bar graph decreasing vector icon with drop down arrow. Statistical data of stock, financial in business to loss, negative, decline or crisis. Graphic for report, presentation. 48x48 px. n. Exponential function vectors Bar chart or bar graph decreasing vector icon with drop down arrow. 48x48 pixel perfect and editable stroke. Bar chart or bar graph decreasing vector icon with drop down arrow. Statistical data of stock, financial in business to loss, negative, decline or crisis. Graphic for report, presentation. 48x48 px.n
Free with trial Bar chart or bar graph decreasing vector icon with drop down arrow. Statistical data of stock, financial in business to loss, negative, decline or crisis. Graphic for report, presentation. 48x48 px. n. Exponential function illustrations Bar chart or bar graph decreasing vector icon with drop down arrow. 48x48 pixel perfect and editable stroke. Bar chart or bar graph decreasing vector icon with drop down arrow. Statistical data of stock, financial in business to loss, negative, decline or crisis. Graphic for report, presentation. 48x48 px.n
Free with trial Bar chart or bar graph decreasing vector icon with drop down arrow. Statistical data of stock, financial in business to loss, negative, decline or crisis. Graphic for report, presentation. 48x48 px. n. Exponential function vectors Bar chart or bar graph decreasing vector icon with drop down arrow. 48x48 pixel perfect and editable stroke. Bar chart or bar graph decreasing vector icon with drop down arrow. Statistical data of stock, financial in business to loss, negative, decline or crisis. Graphic for report, presentation. 48x48 px.n
Free with trial An exponential decay function graph displayed on a black background features a prominent orange curved line that starts at the top left and gradually decreases toward the bottom right, with the x-axis labeled X and y-axis labeled 10X indicating logarithmic scaling, while four distinct numerical values 3, 2, 0, and 1 are displayed in crisp white text along the left side corresponding to different. Exponential function illustrations Exponential decay curve graph on black background showing mathematical function with orange line and numerical values. An exponential decay function graph displayed on a black background features a prominent orange curved line that starts at the top left and gradually decreases toward the bottom right, with the x-axis labeled X and y-axis labeled 10X indicating logarithmic scaling, while four distinct numerical values 3, 2, 0, and 1 are displayed in crisp white text along the left side corresponding to different
Free with trial A graphical representation of the natural exponential function compared to its tangent, linear x plus 1 function. Exponential function illustrations A graphical representation of the natural exponential function
Free with trial Exponential function - formula and two red graphs on the number line for base zero to one and for base greater than one. Exponential function illustrations Exponential function - formula and two red graphs on the number line
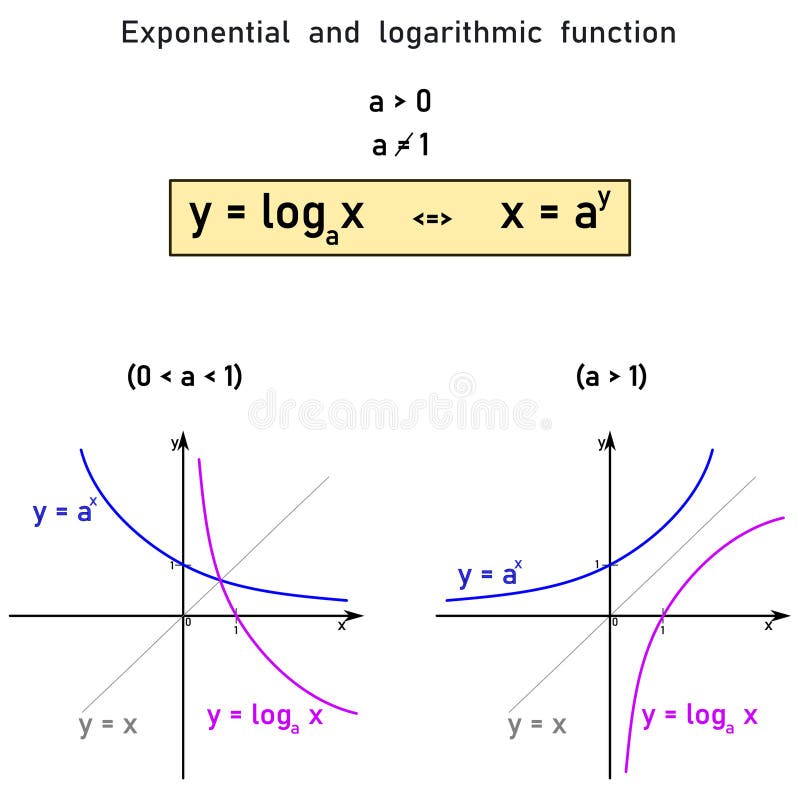
Free with trial Graphic representation and comparison of the natural (Napier) logarithm function and its inverse exponential function distinguished by red and blue. Exponential function illustrations Graphic representation and comparison of the natural (Napier) logarithm function and its inverse exponential function
Free with trial Vector graph or chart of exponential function with formula or equation f(x) ax, or f(x) exp x. The mathematical operation, basic function. Graph with grid and coordinates isolated on white background. Exponential function vectors Vector graph or chart of the exponential function. The mathematical operation, basic function. Vector graph or chart of exponential function with formula or equation f(x) ax, or f(x) exp x. The mathematical operation, basic function. Graph with grid and coordinates isolated on white background.
Free with trial Exponential and logistic population growth. In reality, initial exponential growth is often not sustained forever. After some period, it will be slowed by external or environmental factors. Vector. Exponential function vectors Exponential and logistic population growth
Free with trial Function stretching graph illustration vertical dilation, compression coordinate, geometry algebra function stretching graph. Exponential function illustrations Function stretching graph
Free with trial A hand-drawn graph showing a function with local maxima and minima, plotted on a coordinate plane with axes labeled. Exponential function illustrations Graph of a Function with Local Maxima and Minima. A hand-drawn graph showing a function with local maxima and minima, plotted on a coordinate plane with axes labeled
Free with trial Mathematical showing black curve graph showing exponential decay on white background keywords: graph, chart. Exponential function illustrations Black curve graph showing exponential decay on white background Keywords: graph, chart, curve. Mathematical showing black curve graph showing exponential decay on white background keywords: graph, chart
Free with trial This image shows a whiteboard with various plotted mathematical functions and graphs. The board contains a grid layout with several curves, lines, and equations, likely representing different types of functions such as linear, quadratic, and possibly trigonometric or exponential functions. The graphs illustrate intersections, slopes, and other key features used in mathematical analysis, making it. Exponential function illustrations Whiteboard featuring mathematical graphing and function plotting with multiple curves. This image shows a whiteboard with various plotted mathematical functions and graphs. The board contains a grid layout with several curves, lines, and equations, likely representing different types of functions such as linear, quadratic, and possibly trigonometric or exponential functions. The graphs illustrate intersections, slopes, and other key features used in mathematical analysis, making it
Free with trial Function stretching graph illustration vertical dilation, compression coordinate, geometry algebra function stretching graph. Exponential function illustrations Function stretching graph
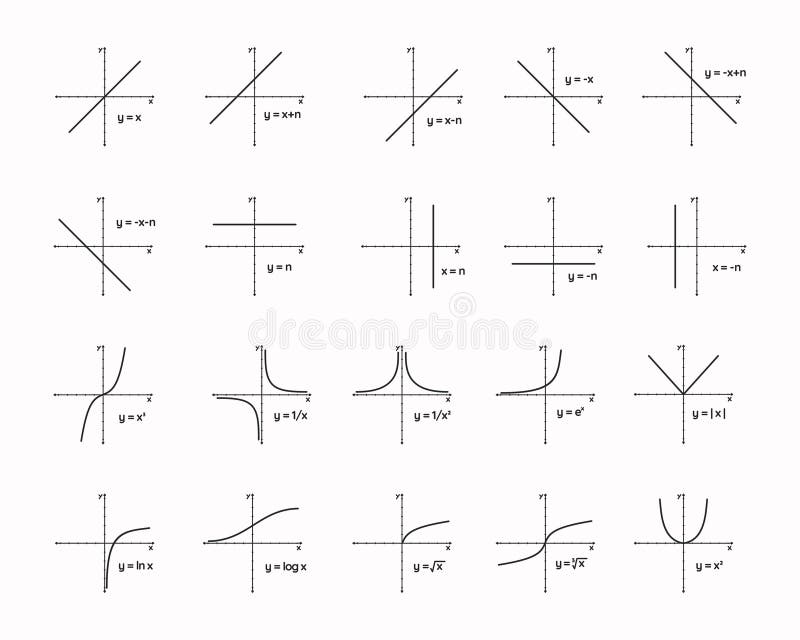
Free with trial Vector set of graphs or charts with nine basic mathematical functions with grid and coordinates isolated on a white background. Linear, constant, absolute value or modulus, logarithmic, exponential, reciprocal, goniometric or trigonometric, quadratic or polynomial, and cubing, cube, or cubic function. Exponential function vectors Vector set of graphs with 9 basic mathematical functions with grid and coordinates. Vector set of graphs or charts with nine basic mathematical functions with grid and coordinates isolated on a white background. Linear, constant, absolute value or modulus, logarithmic, exponential, reciprocal, goniometric or trigonometric, quadratic or polynomial, and cubing, cube, or cubic function.
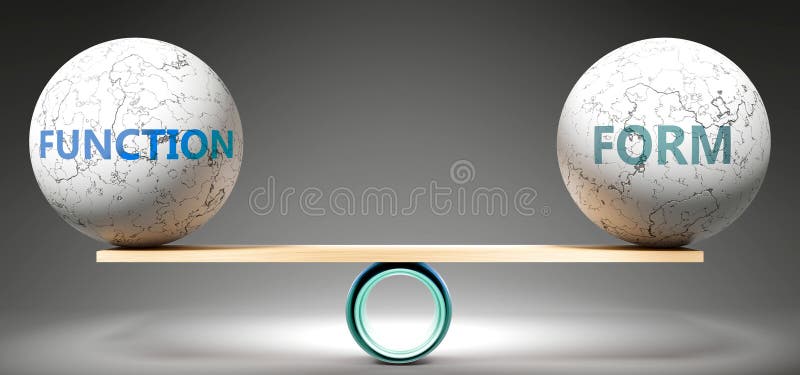
Free with trial A metaphor showing Function in equilibrium with Form, symbolizing a desired harmony between them. Stability. Harmonious and preferable setup. Exponential function illustrations Function and form in balance. A metaphor showing Function in equilibrium with Form, symbolizing a desired harmony between them. Stability. Harmonious and preferable setup
Free with trial Collection of mathematical graph functions including linear, quadratic, trigonometric, and exponential curves on coordinate grids, perfect for education and analytics visuals. Exponential function vectors Mathematical Graph Functions Set with Linear Quadratic and Trigonometric Curves. Collection of mathematical graph functions including linear, quadratic. Collection of mathematical graph functions including linear, quadratic, trigonometric, and exponential curves on coordinate grids, perfect for education and analytics visuals
Free with trial Binary fission and the power of two. Cell division in biology, where a single cell produce 2 parts. Nuclear fission in physics, where an atomic nucleus splits into 2 nuclei, leading to chain reaction. Exponential function vectors Binary fission and the power of two, binary cell division, or chain reaction. Binary fission and the power of two. Cell division in biology, where a single cell produce 2 parts. Nuclear fission in physics, where an atomic nucleus splits into 2 nuclei, leading to chain reaction.
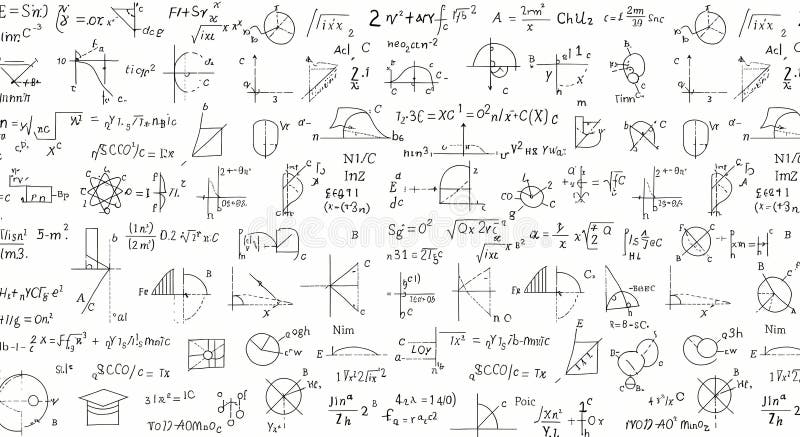
Free with trial This image is a busy collage of various hand-drawn mathematical equations, formulas, graphs, and geometric diagrams. The style is reminiscent of notes taken during lectures or study sessions, featuring a mix of algebraic expressions, calculus symbols, trigonometric functions, and geometric shapes. The overall impression is one of complex scientific or academic study, suitable for backgrounds related to education, research, science, technology, or problem-solving. Exponential function illustrations Collage of Hand-Drawn Mathematical Formulas and Diagrams. This image is a busy collage of various hand-drawn mathematical equations, formulas, graphs, and geometric diagrams. The style is reminiscent of notes taken during lectures or study sessions, featuring a mix of algebraic expressions, calculus symbols, trigonometric functions, and geometric shapes. The overall impression is one of complex scientific or academic study, suitable for backgrounds related to education, research, science, technology, or problem-solving.
Free with trial A sleek, AI-generated abstract graphic shows a clear growth trajectory. The smooth, upward-sloping green curve, set against a two-tone coordinate background, is a powerful visual metaphor for success and improvement. Ideal for financial analysts and marketing teams who need to represent business data efficiently. Exponential function illustrations Simplified graphical curve showing data growth on a Cartesian plane background. A sleek, AI-generated abstract graphic shows a clear growth trajectory. The smooth, upward-sloping green curve, set against a two-tone coordinate background, is a powerful visual metaphor for success and improvement. Ideal for financial analysts and marketing teams who need to represent business data efficiently.
Free with trial Dive into the mesmerizing world of mathematical concepts with this captivating image. The abstract representation of Euler's number showcases the dynamic and ever-expanding nature of infinity. Intricate spirals, meticulously crafted, create a visual symphony of mathematical elegance. The image's vibrant colors and complex patterns invite contemplation of the boundless possibilities inherent. Exponential function illustrations Exploring the Intricate Spirals of Eulers Number A Visual Representation of Infinity Through Abstract Geometry. Dive into the mesmerizing world of mathematical concepts with this captivating image. The abstract representation of Euler's number showcases the dynamic and ever-expanding nature of infinity. Intricate spirals, meticulously crafted, create a visual symphony of mathematical elegance. The image's vibrant colors and complex patterns invite contemplation of the boundless possibilities inherent
Free with trial This captivating surreal photography series unveils the enigmatic mathematical constant 'e' through visually stunning and thought-provoking imagery. The intricate patterns, impossible geometries, and otherworldly landscapes serve as a powerful metaphor for the beauty and complexity inherent within this fundamental mathematical constant. 'e' is a cornerstone of calculus, appearing in formulas. Exponential function illustrations Exploring the Mystical Beauty of Eulers Number e Through Surreal Photography A Visual Journey into Mathematical. This captivating surreal photography series unveils the enigmatic mathematical constant 'e' through visually stunning and thought-provoking imagery. The intricate patterns, impossible geometries, and otherworldly landscapes serve as a powerful metaphor for the beauty and complexity inherent within this fundamental mathematical constant. 'e' is a cornerstone of calculus, appearing in formulas
Free with trial Bright Yellow Productivity Journal Planner Track Your Progress on Modern Wooden Desk Setup with Open Math Calculus Notes Coffee Cup and Potted Succulent Plant. Exponential function illustrations Bright Yellow Productivity Journal Planner Track Your Progress on Modern Wooden Desk Setup with Open Math Calculus Notes Coffee
Free with trial Oil gas refinery or petrochemical plant. Include arrow, graph or bar chart. Decrease trend or low of production, market price, demand, supply. Concept of business, industry, fuel, power energy. Exponential function illustrations Oil gas refinery or petrochemical plant with concept of business. Oil gas refinery or petrochemical plant. Include arrow, graph or bar chart. Decrease trend or low of production, market price, demand, supply. Concept of business, industry, fuel, power energy
Free with trial This image shows various mathematical equations and graphs hand-drawn in chalk on a chalkboard. The complex formulas and charts were likely generated by AI for illustrative purposes, showcasing different mathematical concepts visually. Exponential function illustrations Chalkboard Math Equations & Graphs. This image shows various mathematical equations and graphs hand-drawn in chalk on a chalkboard. The complex formulas and charts were likely generated by AI for illustrative purposes, showcasing different mathematical concepts visually.
Free with trial The bell curve, also known as a normal distribution, is a fundamental concept in statistical analysis. This visual representation of data helps researchers and analysts understand how data points cluster around a central tendency. Its symmetrical shape reveals patterns in data sets, allowing for the calculation of probabilities and the identification of outliers. Understanding the. Exponential function illustrations Understanding Data Distribution with the Bell Curve A Comprehensive Guide to Statistical Analysis. The bell curve, also known as a normal distribution, is a fundamental concept in statistical analysis. This visual representation of data helps researchers and analysts understand how data points cluster around a central tendency. Its symmetrical shape reveals patterns in data sets, allowing for the calculation of probabilities and the identification of outliers. Understanding the
Free with trial Natural Exponential Function, Math /Symbol, 3D Rendering Illustration. Exponential function illustrations Natural Exponential Function. 3D Rendering Illustration. Natural Exponential Function, Math /Symbol, 3D Rendering Illustration
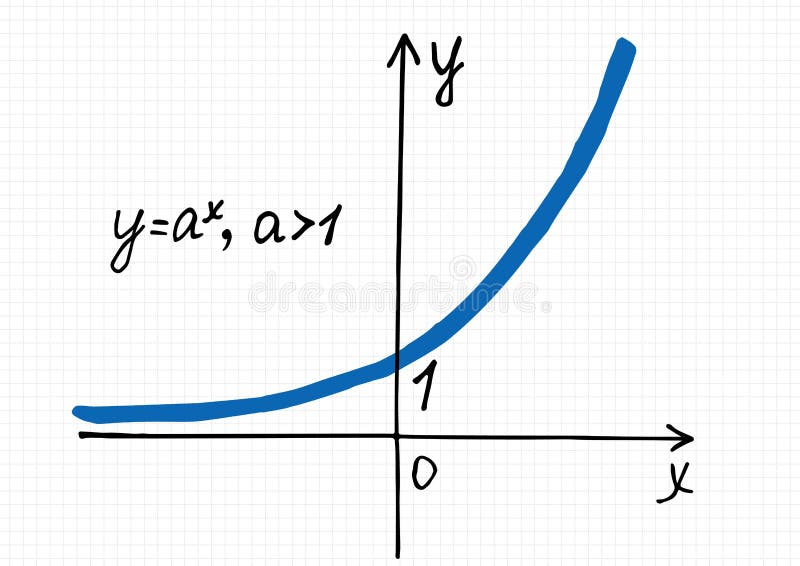
Free with trial A hand-drawn graph of an Exponential function for a base greater than one on a checkered sheet of paper. Vector drawing of a graph of a mathematical curve. Exponential function vectors A hand-drawn graph of an Exponential function for a base greater than one on a checkered sheet of paper
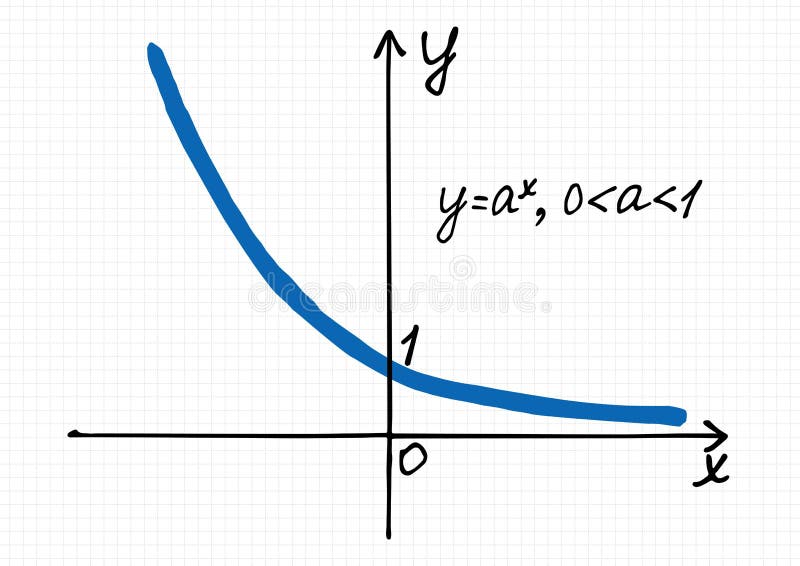
Free with trial A hand-drawn plot of an Exponential function for fractional base less than one on a checkered sheet of paper. Vector drawing of a graph of a mathematical curve. Exponential function vectors A hand-drawn plot of an Exponential function for fractional base less than one on a checkered sheet of paper. Vector drawing of a
Free with trial Function equation formula fx f(x) icon hand drawn doodle vector illustration collection set. Linear, constant, logarithmic, exponential, square root, logistic, trigonometric function. Exponential function vectors Function equation formula fx f(x) icon hand drawn doodle collection set. Linear, constant, logarithmic. function equation formula fx f(x) icon hand drawn doodle vector illustration collection set. Linear, constant, logarithmic, exponential, square root, logistic, trigonometric function
Free with trial Math geometry graphs collection set vector illustration. Linear, constant, logarithmic, exponential, square root, logistic function. Graphic presentation for math teachers. Exponential function vectors Math geometry graphs collection set vector illustration. Linear, constant, logarithmic, exponential, square root, logistic
Free with trial Math geometry graphs collection set vector illustration. Linear, constant, logarithmic, exponential, square root, logistic function. Graphic presentation for math teachers. Exponential function vectors Math geometry graphs collection set vector illustration. Linear, constant, logarithmic, exponential, square root, logistic
Free with trial Function type is represented as a binary code 3D illustration. Exponential function illustrations Function type
Free with trial Exponential growth of covid-19 or coronavirus outbreak - concept showing of Rapid spread and epidemic outbreak of a disease. Exponential function illustrations Exponential growth of covid-19 or coronavirus outbreak - concept showing of Rapid spread and epidemic outbreak of a disease
Free with trial Outline exponential graph black line vector doodle icon for web design and presentation isolated on background. Exponential function vectors Exponential graph line vector doodle simple icon. Outline exponential graph black line vector doodle icon for web design and presentation isolated on background
Free with trial Table of graphs of exponential and logarithmic functions in red. Exponential function illustrations Table of graphs of exponential and logarithmic functions
Free with trial Numerical and graphical representation of the relationship between logarithmic and exponential functions. Exponential function illustrations Representation of the relationship between logarithmic and exponential functions
Free with trial Graphical representation and comparison of logarithmic and exponential functions distinguished by blue and red colors. Exponential function illustrations Graphical representation and comparison of logarithmic and exponential functions distinguished
Free with trial Math exercise with a curve drawn on school materials. Exponential function illustrations Exponential curve drawn on a school slate. Math exercise with a curve drawn on school materials
Free with trial Math formula. Characteristics of the root form written by hand. High level math. Chapter Exponential and root form. Exponential function vectors Math formula. Characteristics of the root form written by hand. High level math.
Free with trial Complex Number traffic sign on blue sky background. Exponential function illustrations Complex Number traffic sign on blue sky
Free with trial Formula word block on white background. Exponential function illustrations Formula word block on white
Free with trial Two math axis empty graphic for yours usage. Exponential function vectors Two math axis empty graphic for you
Free with trial Normal distribution formula in probability. Scientific vector illustration isolated on white background. Exponential function vectors Normal distribution formula in probability.
Free with trial Illustration with statistics elements. Growing exponential function with red arrow. 3d illustration. Exponential function illustrations White statistics graph. Illustration with statistics elements. Growing exponential function with red arrow. 3d illustration
Free with trial Two math axis empty graphic for yours usage. Exponential function vectors Two math axis empty graphic for presentation. Two math axis empty graphic for yours usage
Free with trial Two axis market sales time and money graphic. Exponential function vectors Two axis market sales time money graphic
Free with trial Math exponentiation simple icons in color rounded square frames on white background. Exponential function vectors Math exponentiation simple icons
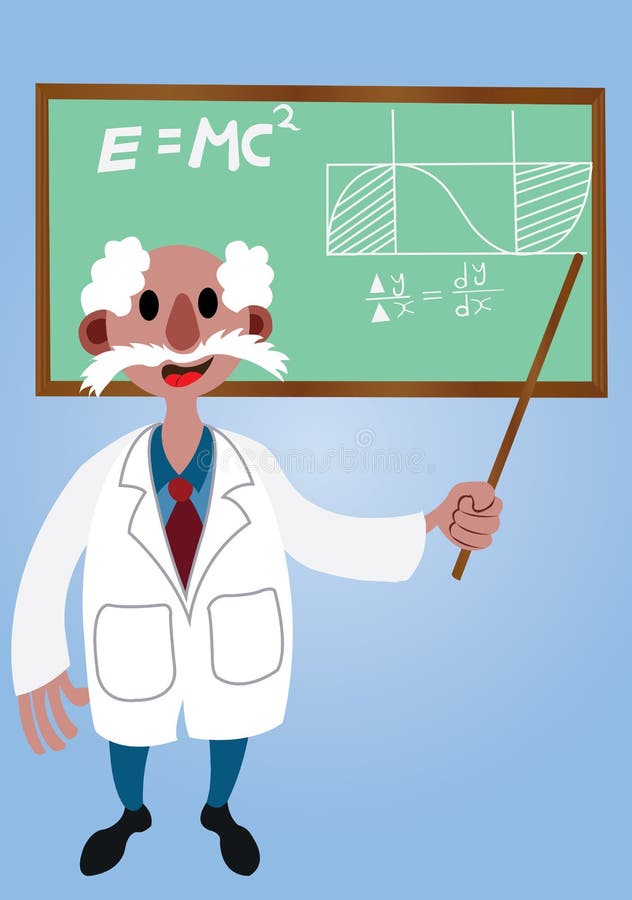
Free with trial A professor explaining a scientific concept on the chalk board. Exponential function vectors Professor showing some math equations. A professor explaining a scientific concept on the chalk board
Free with trial Math exponentiation on rounded square carved wooden button styles. Exponential function vectors Math exponentiation wooden buttons. Math exponentiation on rounded square carved wooden button styles
Free with trial Math exponentiation round color beveled buttons with smooth surfaces and flat white icons. Exponential function vectors Math exponentiation beveled buttons. Math exponentiation round color beveled buttons with smooth surfaces and flat white icons
Free with trial Math exponentiation flat color icons in square frames on white background. Exponential function vectors Math exponentiation flat framed icons. Math exponentiation flat color icons in square frames on white background
Free with trial Math exponentiation icons in rounded square color glossy button set. Exponential function vectors Math exponentiation color square buttons. Math exponentiation icons in rounded square color glossy button set