Free with trial Subtraction interface icon. Negative Vector representation. Minimalist circular illustration. Prohibited removal identification. EPS 10. Flat decrease vectors Subtraction interface icon. Negative Vector representation. Minimalist circular illustration. Prohibited removal identification.
Free with trial Percent search magnify glass icon. Search investment. Flat decrease illustrations Percent search magnify glass icon
Free with trial Minimalist Icon Depicting Subtraction Symbol in Earthy Tones with Long Shadow. Flat decrease vectors Minimalist Icon Depicting Subtraction Symbol in Earthy Tones with Long Shadow
Free with trial Line chart tracks data trends over time, with a downward arrow implying decline and a globe representing global impact. Ideal for analytics, performance, global strategy, tracking, economics, market. Flat decrease illustrations Line Chart with Data Points, Downward Arrow, and Globe for Analysis and Global Trends. Line chart tracks data trends over time, with a downward arrow implying decline and a globe representing global impact. Ideal for analytics, performance, global strategy, tracking, economics, market
Free with trial Minus sign within a blue circle button, depicting negative subtraction, a mathematical symbol. Flat decrease vectors Minus sign within a blue circle button, depicting negative subtraction, a mathematical symbol
Free with trial Minus Symbol in Yellow Circle with Blue Outline for UI Design and User Interface Elements. Flat decrease vectors Minus Symbol in Yellow Circle with Blue Outline for UI Design and User Interface Elements
Free with trial A paper cutout illustration of two arrows, one red, one green, indicating upward & downward trends. Flat decrease illustrations Stock market growth red arrow outpacing. A paper cutout illustration of two arrows, one red, one green, indicating upward & downward trends
Free with trial A dynamic black illustration depicts a lightning bolt with emanating lines and a downward-pointing arrow, symbolizing energy discharge, power reduction, or data download against a clean white backdrop. Flat decrease vectors Powerful Energy Download: Black Graphic Symbol on White Background. A dynamic black illustration depicts a lightning bolt with emanating lines and a downward-pointing arrow, symbolizing energy discharge, power reduction, or data download against a clean white backdrop.
Free with trial A comprehensive set of line icons illustrating various e-commerce, retail, and shopping concepts, including payment, discounts, returns, and logistics. Rendered by Ai, this collection provides essential visual tools for web and app interfaces related to buying and selling. Flat decrease illustrations E-commerce and Shopping Cart Icon Set. A comprehensive set of line icons illustrating various e-commerce, retail, and shopping concepts, including payment, discounts, returns, and logistics. Rendered by Ai, this collection provides essential visual tools for web and app interfaces related to buying and selling
Free with trial Euro currency down and up icon. Rise and fall European economy sign symbol vector. Flat decrease vectors Euro currency down and up icon. Rise and fall European economy sign symbol
Free with trial Shopping cart with a downward arrow, bar graph indicating loss, and sad face illustrating declining sales or performance. Ideal for business, ecommerce, market decline, economic loss, analytics. Flat decrease vectors Declining Sales Concept with Shopping Cart, Downward Arrow, Bar Graph, and Sad Face. Shopping cart with a downward arrow, bar graph indicating loss, and sad face illustrating declining sales or performance. Ideal for business, ecommerce, market decline, economic loss, analytics
Free with trial Illustration of a minus sign in a circle indicating subtraction or negation on a white backdrop. Flat decrease vectors Illustration of a minus sign in a circle indicating subtraction or negation on a white backdrop
Free with trial Downward arrow, segmented pie chart, and analog clock suggest concepts of time management, data analysis, and decline. Ideal for productivity, efficiency, business, strategy evaluation finance. Flat decrease vectors Downward Arrow, Pie Chart, and Clock Representing Time, Decline, and Data Analysis Concept. Downward arrow, segmented pie chart, and analog clock suggest concepts of time management, data analysis, and decline. Ideal for productivity, efficiency, business, strategy evaluation finance
Free with trial Vector Illustration. Sugar Cubes and Candy. Healthy Eating. Healthy Lifestyle. Weight Loss Concept. Flat decrease vectors Colored Sugar Reduction Icon. Vector Illustration. Sugar Cubes and Candy. Healthy Eating. Healthy Lifestyle. Weight Loss Concept
Free with trial Graph line icon. Halftone dotted pattern. Gradient icon with grain shadow. Column chart sign. Ab test diagram symbol. Line graph chart icon. Various designs. Vector. Flat decrease vectors Graph line icon. Column chart sign. Halftone dotted pattern. Vector. Graph line icon. Halftone dotted pattern. Gradient icon with grain shadow. Column chart sign. Ab test diagram symbol. Line graph chart icon. Various designs. Vector
Free with trial Yellow circle with horizontal bar indicating subtraction simple negative mathematical symbol. Flat decrease vectors Yellow circle with horizontal bar indicating subtraction simple negative mathematical symbol
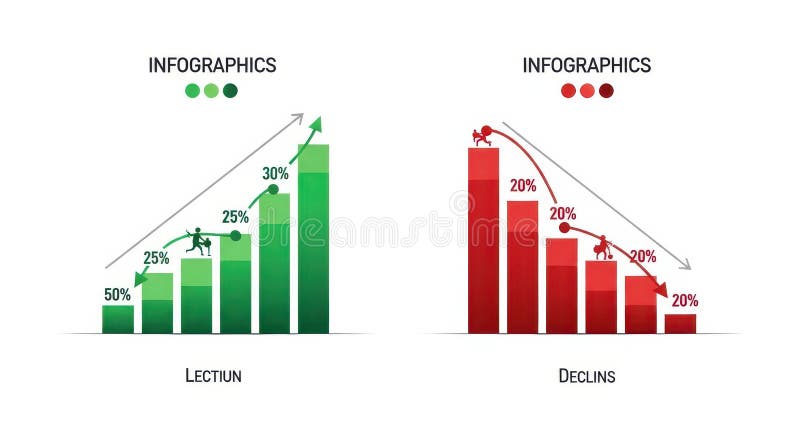
Free with trial The image displays two infographics side by side. the left infographic, titled "lection," depicts a green bar graph showing growth, starting at 50% and increasing to 30% with a figure climbing the bars. an upward-pointing arrow indicates positive growth. the right infographic, titled "declins," shows a red bar graph illustrating decline, starting at 20% and decreasing to 20% with a figure falling down the bars. a downward-pointing arrow indicates negative growth. Flat decrease illustrations Infographics showing growth and decline charts. the image displays two infographics side by side. the left infographic, titled "lection," depicts a green bar graph showing growth, starting at 50% and increasing to 30% with a figure climbing the bars. an upward-pointing arrow indicates positive growth. the right infographic, titled "declins," shows a red bar graph illustrating decline, starting at 20% and decreasing to 20% with a figure falling down the bars. a downward-pointing arrow indicates negative growth.
Free with trial Line graph with a green line and a red dot on top. The red dot is located at the top left corner of the graph. Flat decrease illustrations Graph with a green line and a red dot
Free with trial Blue downward arrow, injured thumbs-up hand, and calculator icon highlight financial setback, risk management, medical expenses, cost analysis. Ideal for business, healthcare, budgeting. Flat decrease vectors Financial Loss Concept with Downward Arrow, Bandaged Thumbs-Up, and Calculator Symbol. Blue downward arrow, injured thumbs-up hand, and calculator icon highlight financial setback, risk management, medical expenses, cost analysis. Ideal for business, healthcare, budgeting
Free with trial Line graph with downward trend, sad face for dissatisfaction, alert bell for warning, and magnifier symbolizing evaluation. Ideal for data analysis, performance tracking, decline, warning, failure. Flat decrease vectors Declining Graph with Sad Face, Alert Bell, and Magnifier Indicating Negative Trends. Line graph with downward trend, sad face for dissatisfaction, alert bell for warning, and magnifier symbolizing evaluation. Ideal for data analysis, performance tracking, decline, warning, failure
Free with trial A bar graph with descending blue, yellow, and red bars, accompanied by a downward-pointing arrow, symbolizes economic decline or negative trends on a clean white background. Flat decrease illustrations Colorful Bar Graph with Downward Arrow Illustrating Economic Decline. A bar graph with descending blue, yellow, and red bars, accompanied by a downward-pointing arrow, symbolizes economic decline or negative trends on a clean white background
Free with trial An upward trending line graph showcases data points increasing, symbolizing growth and progress. The visual represents success, development, and positive statistics. Flat decrease vectors Positive Trend Graph, Data Points Rising Upward. An upward trending line graph showcases data points increasing, symbolizing growth and progress. The visual represents success, development, and positive statistics.
Free with trial Computer screen displaying a webinar with a presenter explaining graphs and charts, recording indicators, audio, and HD video tags. Ideal for e-learning, remote work, business, analytics. Flat decrease vectors Online Webinar on Business Metrics with Recording and Data Analytics Representation. Computer screen displaying a webinar with a presenter explaining graphs and charts, recording indicators, audio, and HD video tags. Ideal for e-learning, remote work, business, analytics
Free with trial Money growth and fall on chart graph with arrow up and down, financial business invest. Vector flat illustration. Flat decrease vectors Money growth and fall on chart graph with arrow up and down, financial business invest. Vector illustration
Free with trial Security concept. Security highlighted through a shield and padlock with related symbols of sustainability, a CO2 footprint, and temperature decrease. For software, environmental awareness, corporate. Flat decrease vectors Blue shield with padlock security, climate-friendly footprint with CO2 label, thumbs-up, and temperature reduction. Security concept. Security highlighted through a shield and padlock with related symbols of sustainability, a CO2 footprint, and temperature decrease. For software, environmental awareness, corporate
Free with trial A set of nine minimalist vector icons depicting various types of charts and graphs including bar charts, progress bars, and trend lines for data visualization and analytics. Flat decrease vectors Collection of simple black glyph icons representing business charts graphs and data analysis. A set of nine minimalist vector icons depicting various types of charts and graphs including bar charts, progress bars, and trend lines for data visualization and analytics
Free with trial Sad face symbolizing dissatisfaction or issues, with data point focus and declining performance graph. Ideal for business analytics, performance drops, feedback, emotions, troubleshooting, reporting. Flat decrease illustrations Sad face with declining graph and focus on data highlighting underperformance and issues. Sad face symbolizing dissatisfaction or issues, with data point focus and declining performance graph. Ideal for business analytics, performance drops, feedback, emotions, troubleshooting, reporting
Free with trial Up and Down Arrows Inside Target Graphic Illustration Representing Directional Motion and Strategy. Flat decrease vectors Up and Down Arrows Inside Target Graphic Illustration Representing Directional Motion and Strategy
Free with trial Minus Symbol in Circular Button Indicates Subtraction or Negative Value. Flat decrease vectors Minus Symbol in Circular Button Indicates Subtraction or Negative Value
Free with trial Cartoon style grey minus button delete sign icon hand drawn illustration. Flat decrease vectors Cartoon style grey minus button delete sign icon hand drawn illustration
Free with trial Growth and decline arrow graph icon. Up and down arrows symbol illustration. Flat decrease vectors Growth and decline arrow graph icon. Up and down arrows symbol
Free with trial Business bar graph with upward and downward arrow. Trend analysis icon vector. Flat decrease vectors Business bar graph with upward and downward arrow. Trend analysis icon
Free with trial Two flat design icons representing financial trends. One shows an upward bar chart with an arrow and percentage symbol, the other a downward bar chart with a percentage symbol. Flat decrease vectors Upward and Downward Bar Chart Icons with Percentage Symbols Ai-Generated. Two flat design icons representing financial trends. One shows an upward bar chart with an arrow and percentage symbol, the other a downward bar chart with a percentage symbol
Free with trial A man is pointing at a stock chart with a sell indicator and a downward arrow, indicating a potential downward trend in the market. Flat decrease vectors Man pointing at sell chart with downward arrow indicator. a man is pointing at a stock chart with a sell indicator and a downward arrow, indicating a potential downward trend in the market.
Free with trial Minus Sign Drawn in a Circle, Subtraction Math Symbol, Outline Illustration. Flat decrease vectors Minus Sign Drawn in a Circle, Subtraction Math Symbol, Outline Illustration
Free with trial Downward arrow, spiral calendar, and bar graph signifying trend analysis, scheduling, and metrics. Ideal for time management, progress tracking, productivity, data analytics planning forecasting. Flat decrease vectors Calendar, Downward Arrow, and Bar Graph Representing Time Management and Performance Analysis. Downward arrow, spiral calendar, and bar graph signifying trend analysis, scheduling, and metrics. Ideal for time management, progress tracking, productivity, data analytics planning forecasting
Free with trial Blue sad face next to dollar symbol with an arrow pointing forward, symbolizing financial loss, economic downturn, challenges, budgeting issues, income concerns, business decline. Ideal for economic. Flat decrease vectors Sad Face and Dollar Sign with Arrow Indicating Financial Loss or Unhappiness About Money. Blue sad face next to dollar symbol with an arrow pointing forward, symbolizing financial loss, economic downturn, challenges, budgeting issues, income concerns, business decline. Ideal for economic
Free with trial Business bar graph icon with upward and downward arrow. Trend analysis symbol vector in circular outline. Flat decrease vectors Business bar graph icon with upward and downward arrow. Trend analysis symbol in circular outline
Free with trial Illustration showing declining sales after initial product launch and strategic recovery using drip promotions, seasonal marketing refreshes, and bundle offers. Flat decrease illustrations . illustration showing declining sales after initial product launch and strategic recovery using drip promotions, seasonal marketing refreshes, and bundle offers.
Free with trial Set of Plus and Minus icon vector isolated on white background. Flat decrease vectors Set of Plus and Minus icon vector
Free with trial This illustration features a collection of five distinct icons representing various financial concepts. From left to right, it shows a Bitcoin symbol with an upward trending graph, an envelope overflowing with cash, a hand holding a gold coin, a calculator with a downward arrow and stacked coins labeled 'Cost Management', and a magnifying glass over a market analysis graph. The icons are stylized with a clean, flat design and vibrant colors, making them ideal for presentations, infographics, and financial content. Flat decrease vectors Financial Concepts Icons: Bitcoin Growth, Cash Envelope, Investment, Cost Management, Market Analysis. This illustration features a collection of five distinct icons representing various financial concepts. From left to right, it shows a Bitcoin symbol with an upward trending graph, an envelope overflowing with cash, a hand holding a gold coin, a calculator with a downward arrow and stacked coins labeled 'Cost Management', and a magnifying glass over a market analysis graph. The icons are stylized with a clean, flat design and vibrant colors, making them ideal for presentations, infographics, and financial content.
Free with trial Circular arrows pointing in opposite directions, creating a balanced and visually appealing design element. Perfect for website icons, app design, or any project requiring a sense of balance and movement. High-resolution vector graphic ensures scalability without loss of quality. Flat decrease vectors Abstract Circular Arrows: Symmetrical Design Element. Circular arrows pointing in opposite directions, creating a balanced and visually appealing design element. Perfect for website icons, app design, or any project requiring a sense of balance and movement. High-resolution vector graphic ensures scalability without loss of quality.
Free with trial Isometric illustration of a woman analyzing a graph with a magnifying glass, laptop, and coins, representing finance and business analysis. Flat decrease vectors Woman analyzes graph with magnifying glass and laptop coin. isometric illustration of a woman analyzing a graph with a magnifying glass, laptop, and coins, representing finance and business analysis.
Free with trial An outlined, simplified rendering illustrating a zoom out search functionality. The icon includes a magnifying glass with a minus sign and a small reset button; starkly contrasted on white. Flat decrease vectors Simplified Outline: Zoom Out and Reset Search Functionality for Interfaces. An outlined, simplified rendering illustrating a zoom out search functionality. The icon includes a magnifying glass with a minus sign and a small reset button; starkly contrasted on white.
Free with trial Simple line graph illustrating data points and trends. Ideal for presentations, reports, and infographics related to business analysis, market research, or financial reporting. Flat decrease vectors Simple Line Graph, Data Visualization, Business Chart. Simple line graph illustrating data points and trends. Ideal for presentations, reports, and infographics related to business analysis, market research, or financial reporting.
Free with trial Report line icon. Continuous line with share plane. Column graph, pie chart sign. Market analytics symbol. 3d heart in speech bubble. Report single line ribbon. Loop curve pattern. Vector. Flat decrease vectors Report line icon. Column graph, pie chart sign. Continuous line with plane. Vector. Report line icon. Continuous line with share plane. Column graph, pie chart sign. Market analytics symbol. 3d heart in speech bubble. Report single line ribbon. Loop curve pattern. Vector
Free with trial A visual creation that highlights a balanced composition with interesting details and style, presenting a harmonious and aesthetic blend of elements, suitable for various creative purposes. Flat decrease vectors Four colorful arrow icons illustrate actions: resize, upload, delete, and scale. A visual creation that highlights a balanced composition with interesting details and style, presenting a harmonious and aesthetic blend of elements, suitable for various creative purposes.
Free with trial Deposit insurance vector symbol. percent shiled icon silhouette. Flat decrease illustrations Deposit insurance vector symbol
Free with trial This image features a set of up and down arrows in three color variations (black, red, and a gradient from red to blue). Flat decrease vectors Up and Down Arrows in Black, Red, and Blue. This image features a set of up and down arrows in three color variations (black, red, and a gradient from red to blue).
Free with trial Red curved arrow pointing downwards on a white background. Flat decrease vectors Red curved arrow pointing downwards
Free with trial Minus Sign in Red Circle with Drop Shadow Simple Symbol for Subtraction Icon. Flat decrease vectors Minus Sign in Red Circle with Drop Shadow Simple Symbol for Subtraction Icon
Free with trial Blue coin with dollar sign paired with downward arrow suggesting decreased value, budget cuts, or cost reductions. Ideal for economics, money management, cost-saving, depreciation, finance. Flat decrease illustrations Coin with Dollar Sign and Downward Arrow Representing Financial Decline or Cost Reduction. Blue coin with dollar sign paired with downward arrow suggesting decreased value, budget cuts, or cost reductions. Ideal for economics, money management, cost-saving, depreciation, finance
Free with trial Vector Graphic of a Pink Minus Sign in a Circle with a Long Shadow for Symbolism and Design Applications. Flat decrease vectors Vector Graphic of a Pink Minus Sign in a Circle with a Long Shadow for Symbolism and Design Applications
Free with trial Blood sugar tracking concept. Illustration of stress affecting glucose levels with people meditating and expressing concern. Vector illustration. Flat decrease vectors Blood Sugar Tracking. Flat Vector. Blood sugar tracking concept. Illustration of stress affecting glucose levels with people meditating and expressing concern. Vector illustration.
Free with trial Women in technology concept. Analyzing cryptocurrency trends and market data. Collaboration in digital finance research. Vector illustration. Flat decrease vectors Women In Technology. Flat Vector. Women in technology concept. Analyzing cryptocurrency trends and market data. Collaboration in digital finance research. Vector illustration.
Free with trial Simple, elegant double arrow icon pointing both up and down. Perfect for website, app, or presentation use. Clean lines and dark gray color. Flat decrease vectors Double Arrow Up and Down Icon: Modern Minimalist Design. Simple, elegant double arrow icon pointing both up and down. Perfect for website, app, or presentation use. Clean lines and dark gray color.
Free with trial View of Graphs showing declining CO₂ emissions. Flat decrease illustrations Graphs showing declining CO₂ emissions
Free with trial Reduce CO2 isolated cartoon vector illustrations. Young man riding a bike, using eco-friendly transport, reduce carbon emissions, responsible attitude, no air pollution vector cartoon. Flat decrease vectors Reduce CO2 isolated cartoon vector illustrations.
Free with trial Calories reduction icon. Low kilocalories graphics sign. Kcal reduction isolated symbol on white background. Symbol of healthy nutrition. Vector illustration. Flat decrease vectors Low kilocalories graphics sign
Free with trial Coins with dollar signs falling downward alongside directional arrows pointing up and down. Ideal for finance, investment risk, economic downturn, recovery strategy, savings, market fluctuation. Flat decrease vectors Falling Coins and Arrows Representing Financial Loss with Potential Opportunity for Recovery. Coins with dollar signs falling downward alongside directional arrows pointing up and down. Ideal for finance, investment risk, economic downturn, recovery strategy, savings, market fluctuation
Free with trial A colorful bar graph with a line graph overlayed on a blue background. it shows data trends and market analysis in a simple visual format. Flat decrease vectors Colorful bar graph with a line graph on a blue background. a colorful bar graph with a line graph overlayed on a blue background. it shows data trends and market analysis in a simple visual format
Free with trial Minus Sign Icon Round Black Circle Subtraction Symbol Graphical Representation Negative Operator Glyph. Flat decrease vectors Minus Sign Icon Round Black Circle Subtraction Symbol Graphical Representation Negative Operator Glyph
Free with trial A businesswoman presents data graphs and charts on a whiteboard during a meeting in a modern office setting. The scene is minimalist and uses a dark blue color palette, emphasizing the data visualization. The image depicts a professional work environment. Flat decrease illustrations Businesswoman Giving Presentation. A businesswoman presents data graphs and charts on a whiteboard during a meeting in a modern office setting. The scene is minimalist and uses a dark blue color palette, emphasizing the data visualization. The image depicts a professional work environment.
Free with trial Simple yet effective double lined bold down arrow icon, ideal for website design and app interfaces. This vector illustration symbolizes downloading, saving, or accessing content. Flat decrease vectors Double Lined Bold Down Arrow Icon Download Button Symbol. Simple yet effective double lined bold down arrow icon, ideal for website design and app interfaces. This vector illustration symbolizes downloading, saving, or accessing content.
Free with trial A graphic illustrating the concept of home value trends. A green arrow pointing upwards represents growth, while a red arrow pointing downwards signifies decline. A family icon is placed above the arrows. Flat decrease illustrations Family Home Value: Upward Trend, Downward Trend, Financial Concepts. A graphic illustrating the concept of home value trends. A green arrow pointing upwards represents growth, while a red arrow pointing downwards signifies decline. A family icon is placed above the arrows
Free with trial Three dark grey arrows pointing downwards, stacked vertically, create a simple yet effective visual. This minimalist design is perfect for website interfaces, presentations, or any project requiring a clear indication of downward movement or progression. Flat decrease vectors Three Stacked Down Arrows: Simple Geometric Design Element. Three dark grey arrows pointing downwards, stacked vertically, create a simple yet effective visual. This minimalist design is perfect for website interfaces, presentations, or any project requiring a clear indication of downward movement or progression.
Free with trial Simple square button with plus and minus icons. This clean design is perfect for website or app interfaces. Flat decrease vectors Adding New Item, Interface Icon Design, Plus and Minus Sign. Simple square button with plus and minus icons. This clean design is perfect for website or app interfaces.
Free with trial This image showcases a simple yet bold black down arrow icon, perfect for website design, app interfaces, or presentations. The clean and modern design ensures versatility across various applications. Flat decrease vectors Bold Black Down Arrow Icon Simple, Clean, and Modern Design. This image showcases a simple yet bold black down arrow icon, perfect for website design, app interfaces, or presentations. The clean and modern design ensures versatility across various applications.
Free with trial Decreasing graph line icon. Continuous line big heart. Column chart sign. Market analytics symbol. 3d hearts in heart shaped loop. Decreasing graph single line ribbon. Loop curve pattern. Vector. Flat decrease vectors Decreasing graph line icon. Column chart sign. Continuous line big heart. Vector. Decreasing graph line icon. Continuous line big heart. Column chart sign. Market analytics symbol. 3d hearts in heart shaped loop. Decreasing graph single line ribbon. Loop curve pattern. Vector
Free with trial A dollar sign is on a white background. There are two green arrows pointing up. Flat decrease vectors A dollar sign is on a white background
Free with trial A simple bar chart and line graph with a downward arrow illustrates a negative trend like recession or business failure ideal for financial reports about crisis or loss. Flat decrease illustrations Declining Blue Bar Chart and Line Graph Showing Financial Loss on Gray Background. A simple bar chart and line graph with a downward arrow illustrates a negative trend like recession or business failure ideal for financial reports about crisis or loss
Free with trial Stylized Blue and Yellow Arrows Pointing in Opposite Directions, Vector Illustration. Flat decrease vectors Stylized Blue and Yellow Arrows Pointing in Opposite Directions, Vector Illustration
Free with trial Wind turbine generating clean energy, reducing CO2 emissions, footprint, thermometer showing decrease, sustainable plants. Ideal for energy, environment, sustainability, ecology climate change. Flat decrease vectors Renewable Energy Reducing Carbon Footprint with Wind Turbine, CO2 Reduction, and Sustainable Plants. Wind turbine generating clean energy, reducing CO2 emissions, footprint, thermometer showing decrease, sustainable plants. Ideal for energy, environment, sustainability, ecology climate change
Free with trial A currency icon with downward arrows represents loss and declining financial value. This graphic suits risk reports, business dashboards, accounting materials, and market analysis presentations. Flat decrease vectors Loss Finance Downward Currency Symbol. A currency icon with downward arrows represents loss and declining financial value. This graphic suits risk reports. A currency icon with downward arrows represents loss and declining financial value. This graphic suits risk reports, business dashboards, accounting materials, and market analysis presentations
Free with trial Up and down arrow on bar chart icon set. Growth and decline graph symbol illustration. Financial trend concept. Flat decrease vectors Up and down arrow on bar chart icon set. Growth and decline graph symbol. Financial trend concept
Free with trial Simple icon design featuring a double-lined, rounded rectangle shape with a minus sign centrally positioned. Perfect for minimalist designs and user interfaces. Flat decrease vectors Double Lined Rounded Rectangle Shape Icon Minus Sign Inside. Simple icon design featuring a double-lined, rounded rectangle shape with a minus sign centrally positioned. Perfect for minimalist designs and user interfaces.
Free with trial Growth and decline chart icon. Green upward and red downward arrow symbol illustration. Flat decrease vectors Growth and decline chart icon. Green upward and red downward arrow symbol
Free with trial Calendar graph line icon. Halftone dotted pattern. Gradient icon with grain shadow. Column chart sign. Growth diagram symbol. Line calendar graph icon. Various designs. Vector. Flat decrease vectors Calendar graph line icon. Column chart sign. Halftone dotted pattern. Vector. Calendar graph line icon. Halftone dotted pattern. Gradient icon with grain shadow. Column chart sign. Growth diagram symbol. Line calendar graph icon. Various designs. Vector
Free with trial Dollar icon crossed out with arrow moving away from a digital dashboard featuring charts, graphs, and media content. Ideal for finance, budget management, loss analysis, expense tracking, resource. Flat decrease vectors Money flowing away from online analytics dashboard indicating financial loss or expense tracking. Dollar icon crossed out with arrow moving away from a digital dashboard featuring charts, graphs, and media content. Ideal for finance, budget management, loss analysis, expense tracking, resource
Free with trial Depositing money, financial savings, wealth accumulation, growing funds, investment growth. Flat decrease vectors Stack of Coins with Download Arrows: Financial Savings Concept. Depositing money, financial savings, wealth accumulation, growing funds, investment growth.