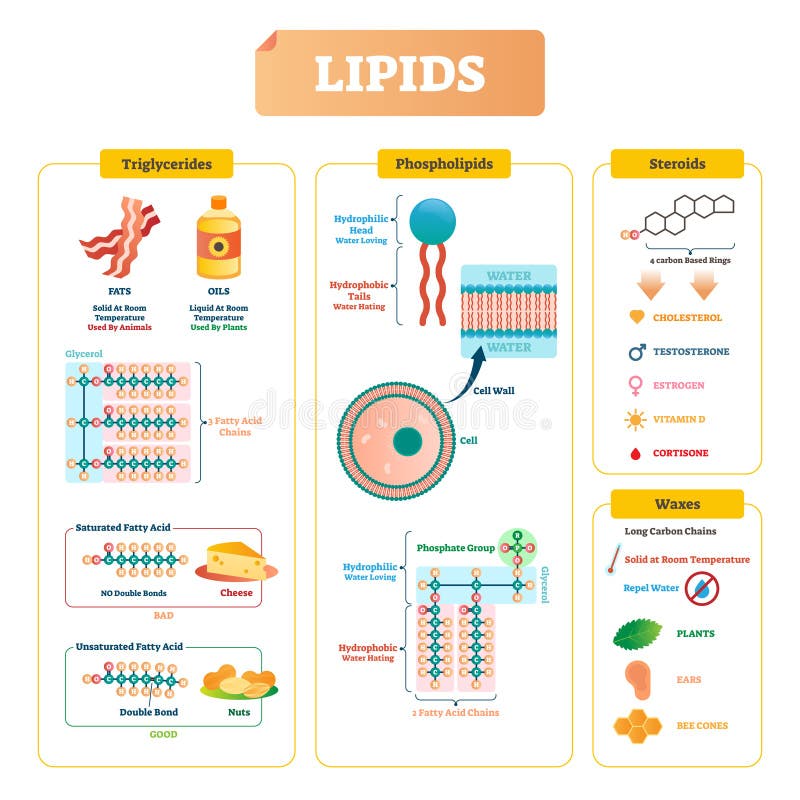
Free with trial Lipids vector illustration infographic. Triglycerides, waxes, phospholipids, and steroids diagram. Labeled structure with fatty chains, saturated bad acid example with cheese and unsaturated with nuts. Glycerol vectors Lipids vector illustration. Triglycerides, waxes and steroids diagram. Lipids vector illustration infographic. Triglycerides, waxes, phospholipids, and steroids diagram. Labeled structure with fatty chains, saturated bad acid example with cheese and unsaturated with nuts
Free with trial Structure of cholesterol and triglycerides, saturated and unsaturated fat molecules, eps8. Glycerol vectors Structure of cholesterol and triglycerides
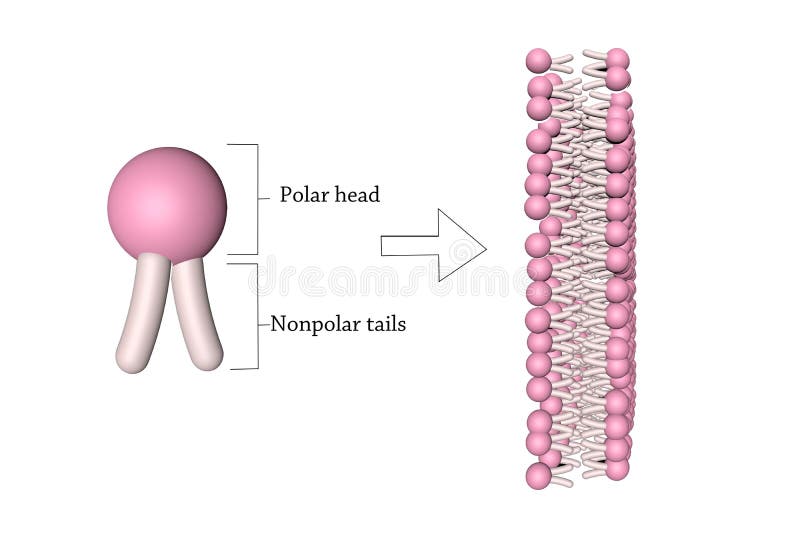
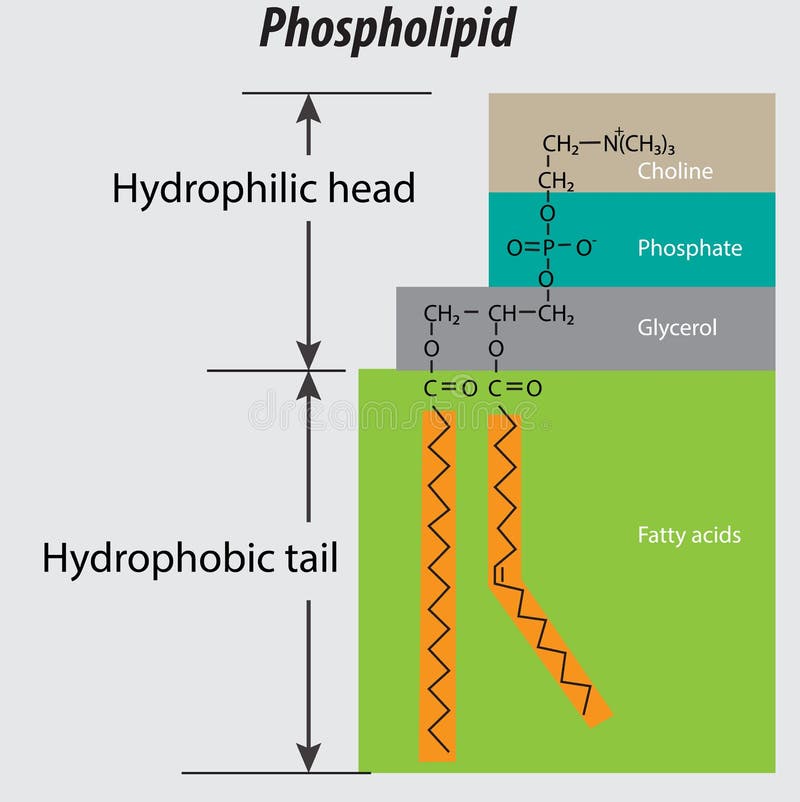
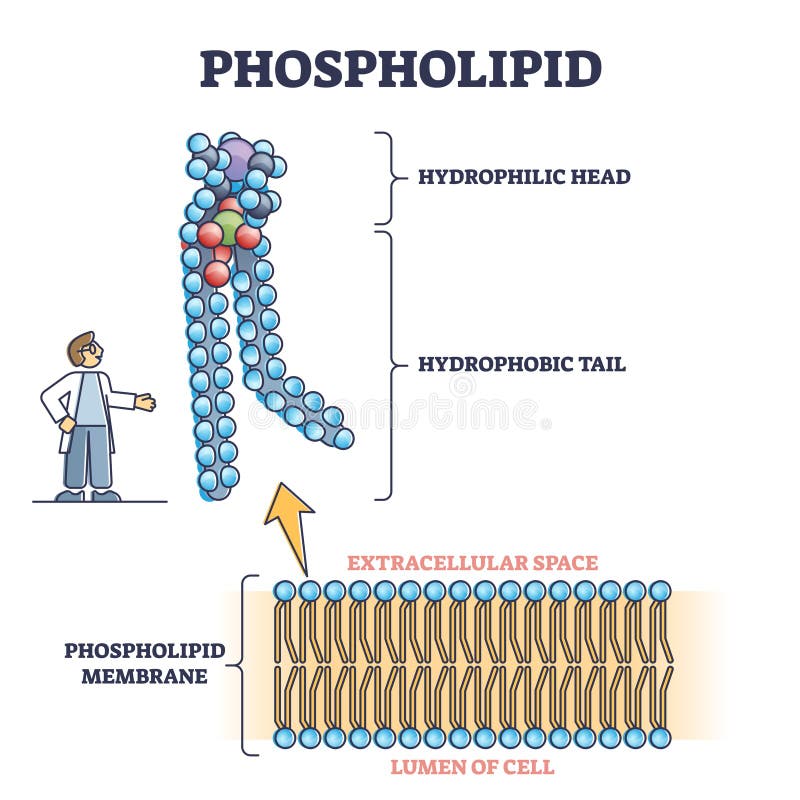
Free with trial Phospholipids are a class of lipids that are a major component of all cell membranes. They can form lipid bilayers because of their amphiphilic characteristic. The structure of the phospholipid molecule generally consists of two hydrophobic fatty acid "tails" and a hydrophilic phosphate "head", joined together by a glycerol molecule. The phosphate groups can be modified with simple organic molecules such as choline. Glycerol illustrations Phospholipid
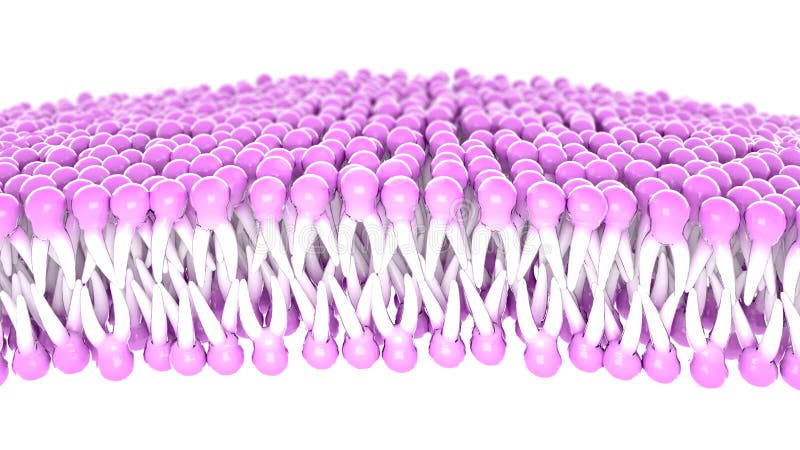
Free with trial Flexible Phosholipid bilayer illustration. Glycerol vectors Phosholipid bilayer illustration
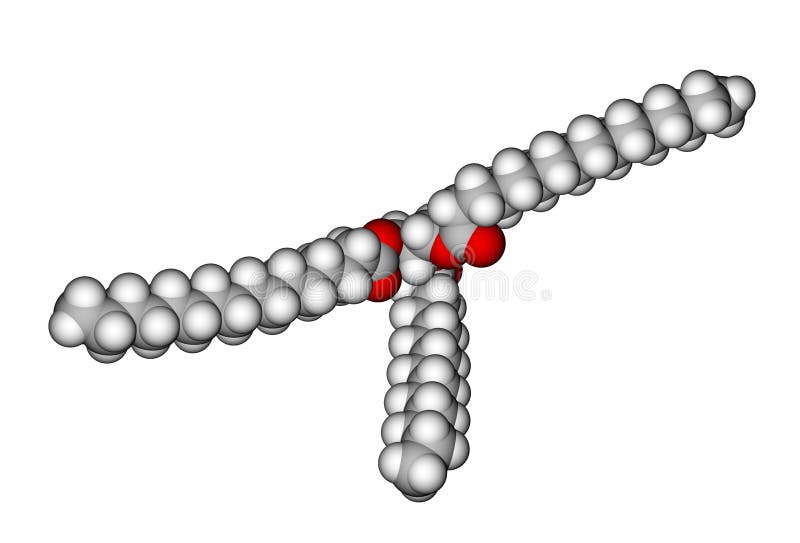
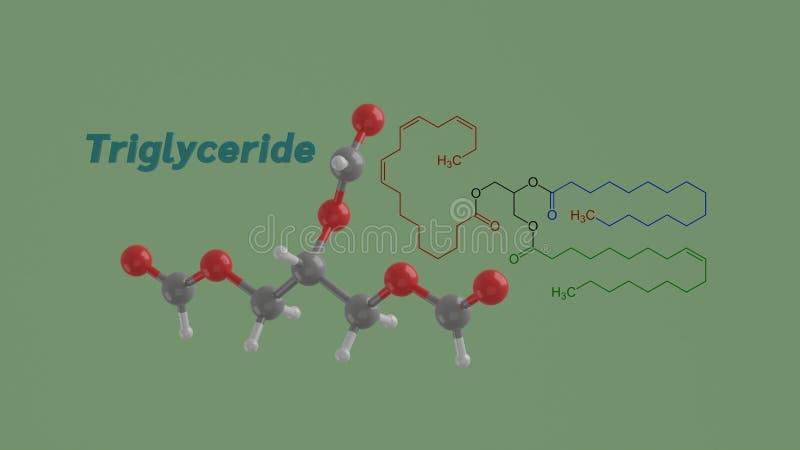
Free with trial Triglyceride optimized molecular structure on a white background. Glycerol illustrations Triglyceride molecular structure. Triglyceride optimized molecular structure on a white background
Free with trial Lipids and fats illustrations, viewed under a microscope. Glycerol illustrations Lipids and fats viewed under a microscope. Lipids and fats illustrations, viewed under a microscope
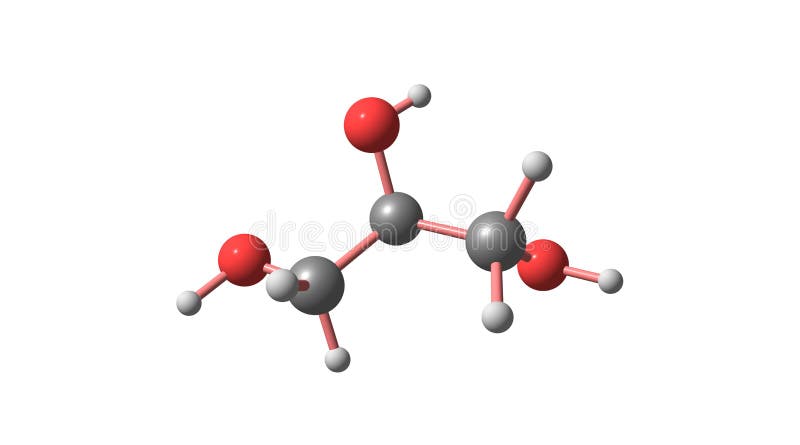
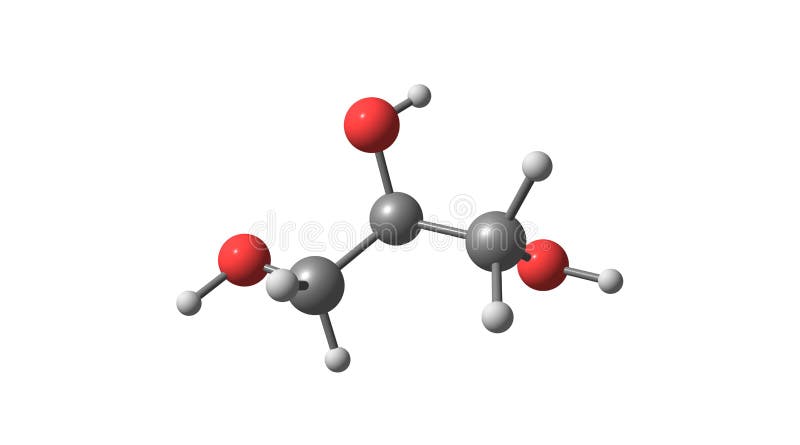
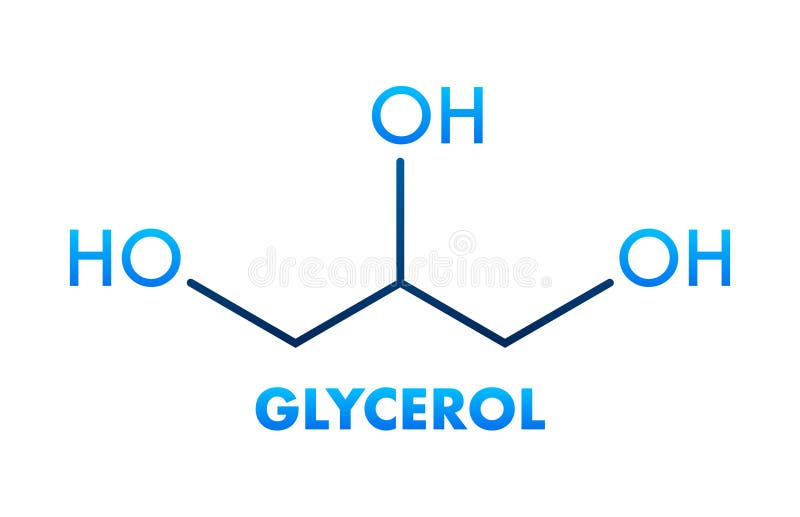
Free with trial Optimized molecular structure of glycerol (glycerin) on a white background. Glycerol illustrations Glycerol molecular structure. Optimized molecular structure of glycerol (glycerin) on a white background
Free with trial Phospholipid or phosphatides lipids head and tail structure outline diagram. Labeled educational inner description with polar group, phosphate or glycerol vector illustration. Bilayer membrane closeup. Glycerol vectors Phospholipid or phosphatides lipids head and tail structure outline diagram
Free with trial Nice sunflower vector illustration in a globe with a leaf. Glycerol vectors Sunflower concept. Nice sunflower vector illustration in a globe with a leaf
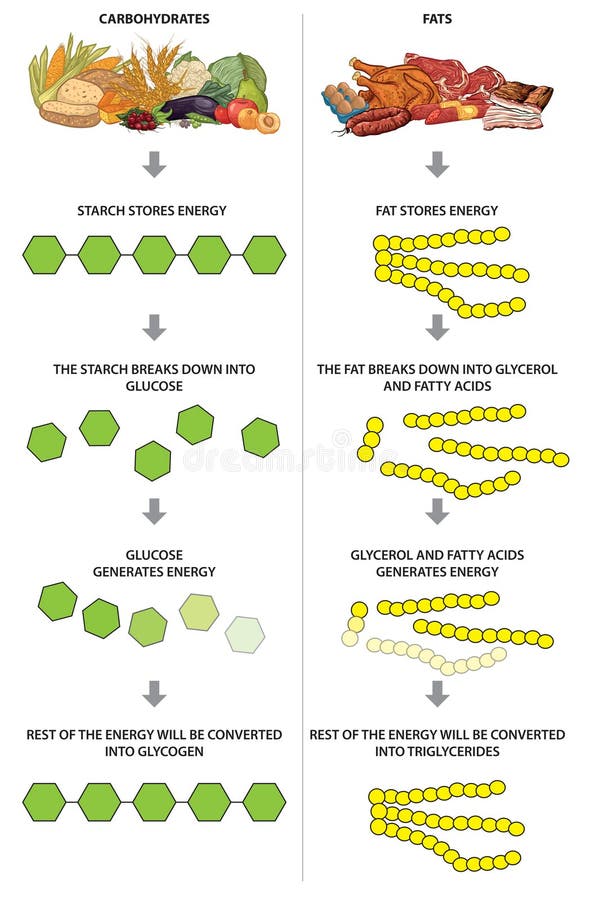
Free with trial Vector illustration of carbohydrates and fats - using and storage. Glycerol vectors Carbohydrates and fats
Free with trial Vector illustration of the chemical structure of lipids: fatty acids, triglycerides, phospholipids, cholesterol. Infohraphic design. Glycerol vectors Lipids
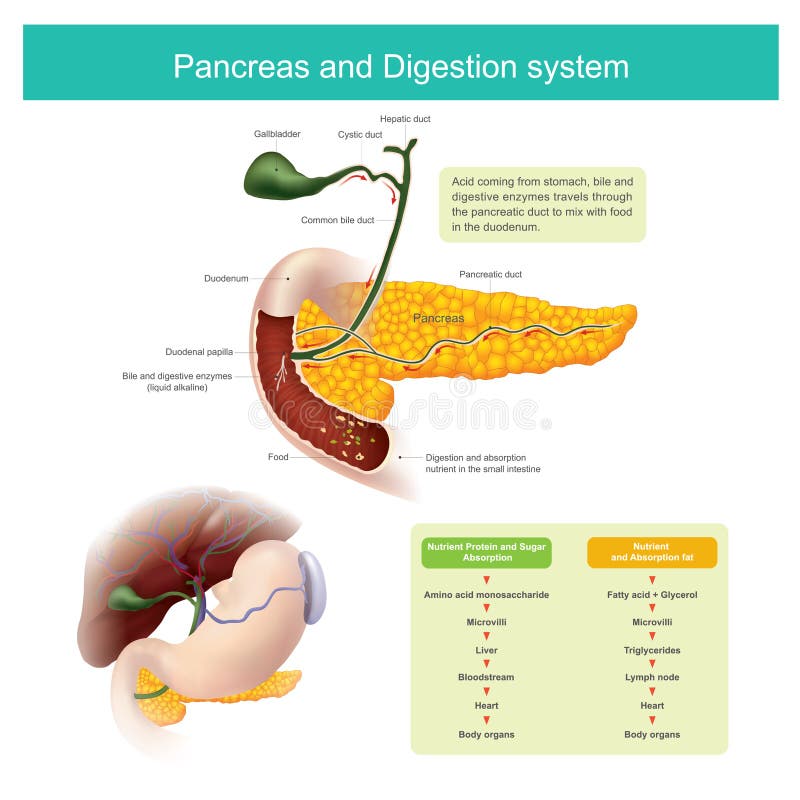
Free with trial The digestive enzymes travels through the pancreatic duct to mix with food in the duodenum. The liver produce Bile, which is stored in the gall bladder released into the small intestine. The small intestine enzymes need to work. Glycerol vectors The digestive enzymes travels through the pancreatic duct to mix
Free with trial Chemical structure of a molecule of triglyceride like it is typically found in animal (butter, cheese, beef) fat. It contains mostly saturated fatty acids. Glycerol illustrations Triglyceride (animal fat). Chemical structure of a molecule of triglyceride like it is typically found in animal (butter, cheese, beef) fat. It contains mostly saturated fatty acids.
Free with trial Lipids digestion. Lipolysis. Enzymes lipase that catalyzes the hydrolysis of fats. Lipid metabolism from triglyceride to Three fatty acids, and Glycerol. Lipase function. Vector poster. Isometric Flat illustration. Glycerol vectors Lipid metabolism from triglyceride to Three fatty acids, and Glycerol. Lipase function
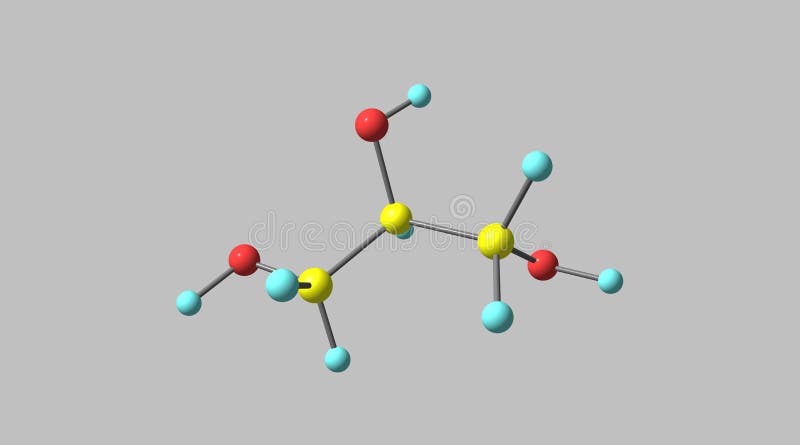
Free with trial 3d render of molecular structure of glycerol isolated over white background.. Atoms are represented as spheres with color and chemical symbol coding: hydrogenH - blue, carbonC - red, oxygenO - green. Glycerol illustrations Glycerol
Free with trial Hand with pen drawing the chemical formula of Glycerol. Glycerol illustrations Chemical formula of Glycerol
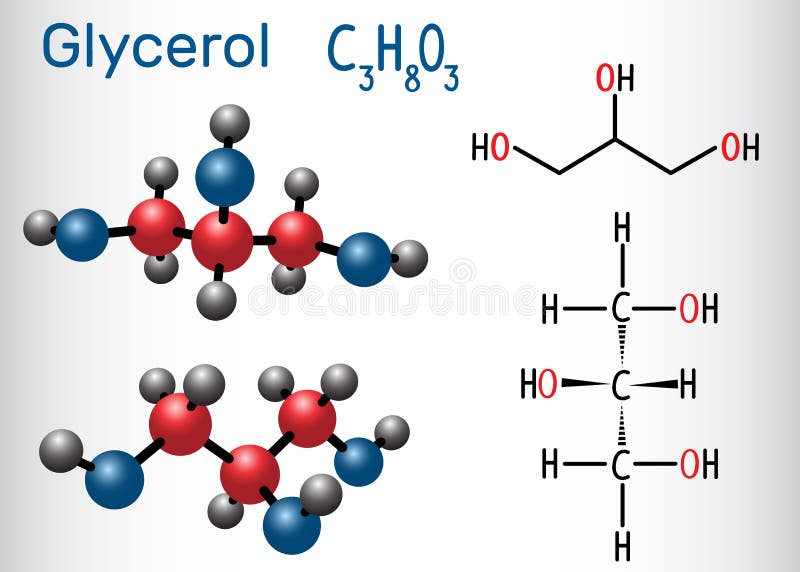
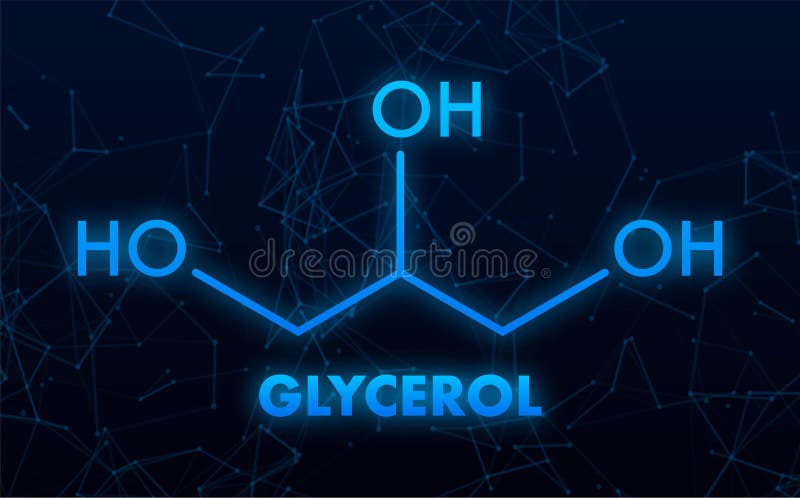
Free with trial Glycerol glycerine, glycerin. Structure of a molecule. chemical formula and model of the Glycerol molecule. vector illustration for medical, educational and science use. Glycerol vectors Glycerol glycerine, glycerin. Structure of a molecule
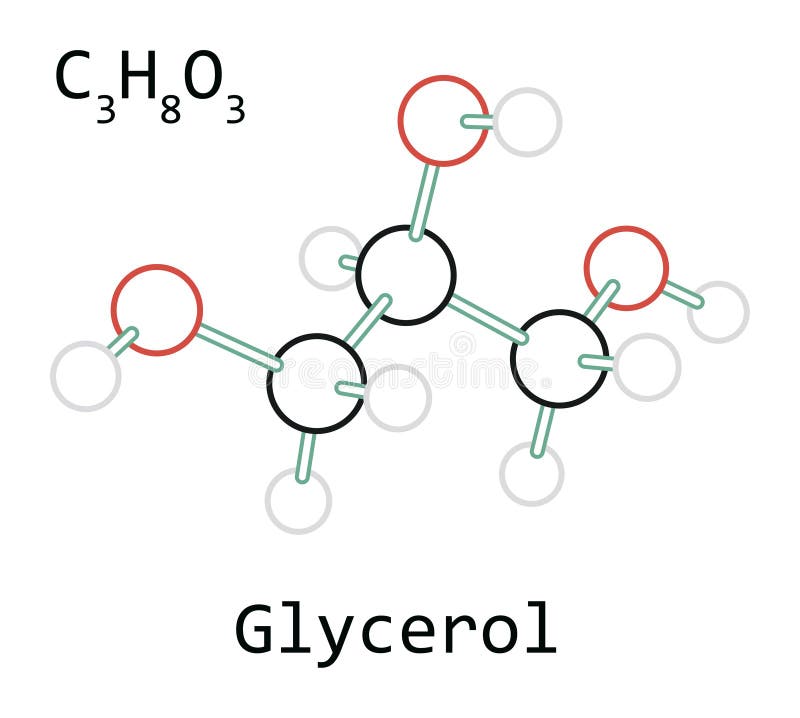
Free with trial Molecule C3H8O3 Glycerol on white in vector. Glycerol vectors Molecule C3H8O3 Glycerol
Free with trial Molecule C3H8O3 Glycerol on white in vector. Glycerol vectors Molecule C3H8O3 Glycerol
Free with trial Glycerol glycerine molecule. Structural chemical formula and molecule model. Vector illustration. Glycerol vectors Glycerol glycerine molecule. Structural chemical formula and m
Free with trial Glycerol is a simple polyol compound. It is a colorless, odorless, viscous liquid that is sweet-tasting and non-toxic. 3d illustration. Glycerol illustrations Glycerol molecular structure isolated on grey. Glycerol is a simple polyol compound. It is a colorless, odorless, viscous liquid that is sweet-tasting and non-toxic. 3d illustration
Free with trial Glycerol is a simple polyol compound. It is a colorless, odorless, viscous liquid that is sweet-tasting and non-toxic. 3d illustration. Glycerol illustrations Glycerol molecular structure isolated on white. Glycerol is a simple polyol compound. It is a colorless, odorless, viscous liquid that is sweet-tasting and non-toxic. 3d illustration
Free with trial Glycerol is a simple polyol compound. It is a colorless, odorless, viscous liquid that is sweet-tasting and non-toxic. 3d illustration. Glycerol illustrations Glycerol molecular structure isolated on white. Glycerol is a simple polyol compound. It is a colorless, odorless, viscous liquid that is sweet-tasting and non-toxic. 3d illustration
Free with trial Glycerol is a simple polyol compound. It is a colorless, odorless, viscous liquid that is sweet-tasting and non-toxic. 3d illustration. Glycerol illustrations Glycerol molecular structure isolated on black. Glycerol is a simple polyol compound. It is a colorless, odorless, viscous liquid that is sweet-tasting and non-toxic. 3d illustration
Free with trial Glycerol is a simple polyol compound. It is a colorless, odorless, viscous liquid that is sweet-tasting and non-toxic. 3d illustration. Glycerol illustrations Glycerol molecular structure isolated on white. Glycerol is a simple polyol compound. It is a colorless, odorless, viscous liquid that is sweet-tasting and non-toxic. 3d illustration
Free with trial Glycerol (glycerin) molecule. Produced from fat and oil triglycerides. Used as sweetener, solvent and preservative in food and drugs. Atoms are represented as spheres with conventional color coding: hydrogen (white), carbon (grey), oxygen (red. Glycerol illustrations Glycerol (glycerin) molecule. Produced from fat and oil triglycerides. Used as sweetener, solvent and preservative in food and
Free with trial Phospholipid structure backbone vector labeled properly. choline group phosphate glycerol fatty acids shown vector drawing illustration. Glycerol vectors Phospholipid structure backbone vector labeled properly. choline group phosphate glycerol fatty acids
Free with trial Phospholipids are a class of lipids that are a major component of all cell membranes. They can form lipid bilayers because of their amphiphilic characteristic. The structure of the phospholipid molecule generally consists of two hydrophobic fatty acid "tails" and a hydrophilic phosphate "head", joined together by a glycerol molecule. The phosphate groups can be modified with simple organic molecules such as choline. Glycerol illustrations Phospholipid
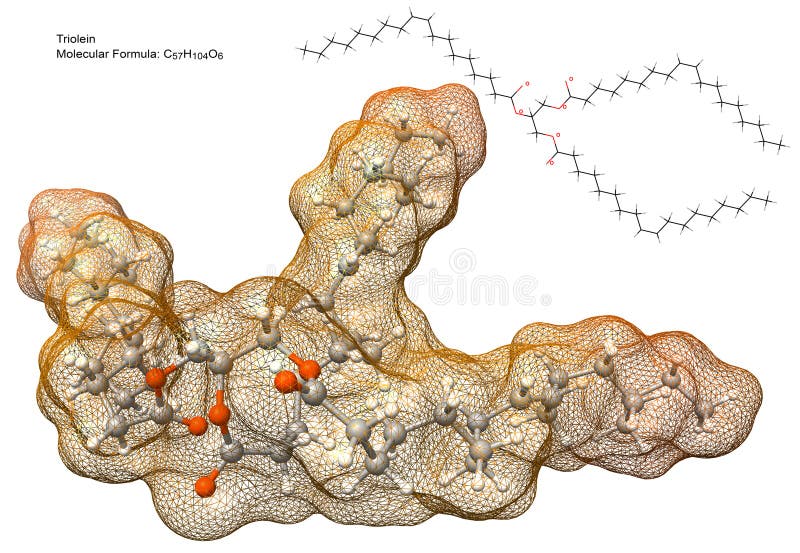
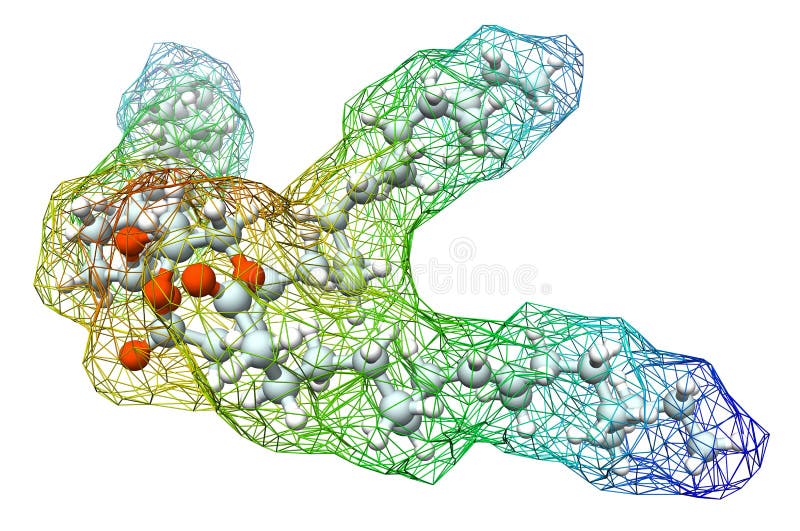
Free with trial 3d model of triolein molecule, chemical formula and 2d structure. This triglyceride, contained in olive oil, is derived from glycerol and three units of fatty acid oleic acid. Glycerol illustrations Triglyceride molecule. 3d model of triolein molecule, chemical formula and 2d structure. This triglyceride, contained in olive oil, is derived from glycerol and three units of fatty acid oleic acid
Free with trial 3d model of triolein molecule, chemical formula and 2d structure. This triglyceride, contained in olive oil, is derived from glycerol and three units of fatty acid oleic acid. Glycerol illustrations Triglyceride molecule. 3d model of triolein molecule, chemical formula and 2d structure. This triglyceride, contained in olive oil, is derived from glycerol and three units of fatty acid oleic acid
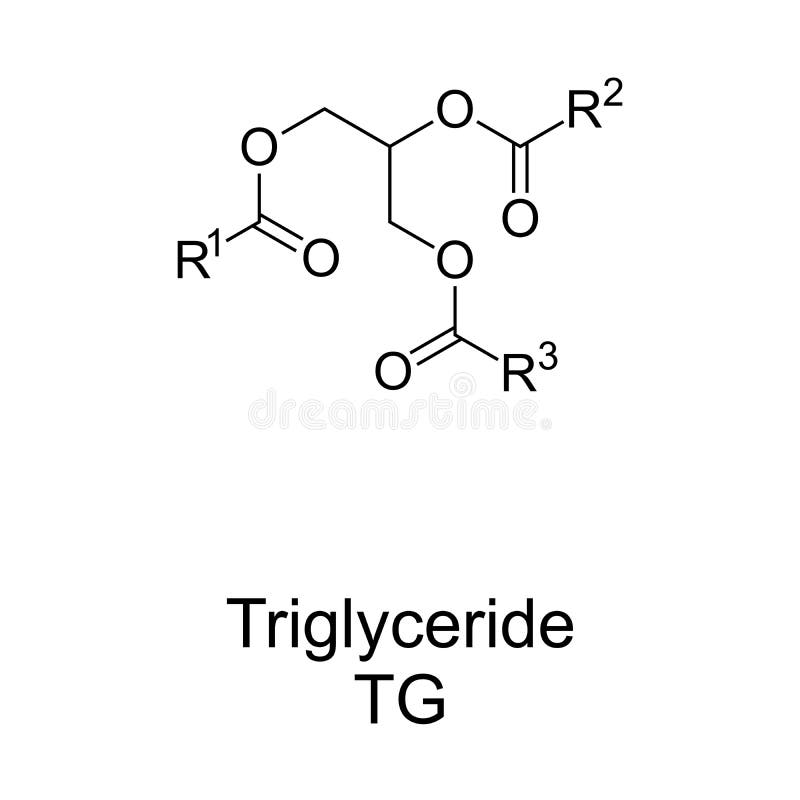
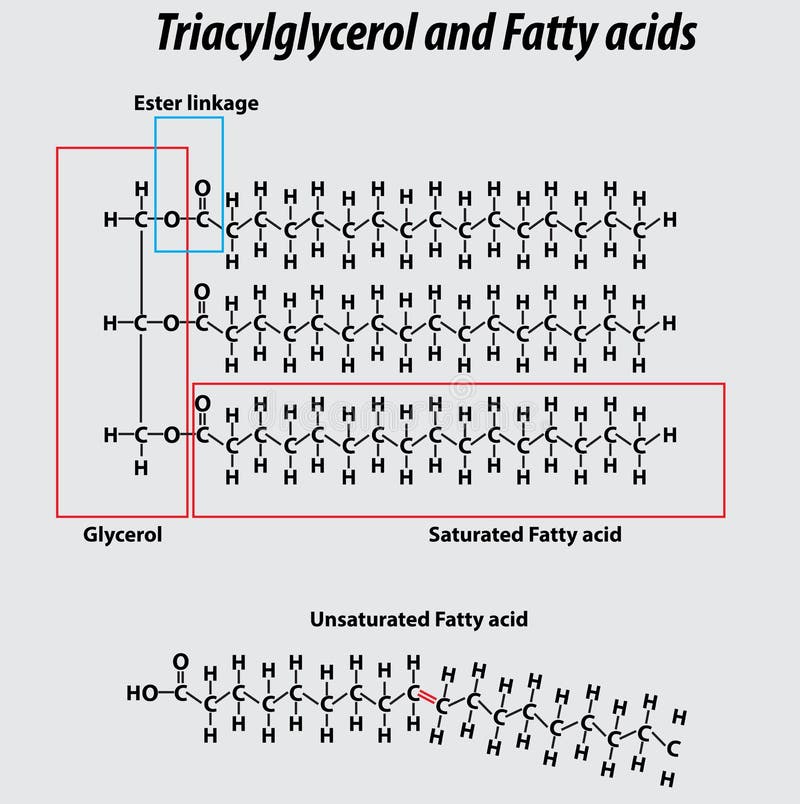
Free with trial Triglyceride chemical structure. Also triacylglycerol or triacylglyceride, ester derived from glycerol and 3 fatty acids. Main constituents of body fat in humans, in vertebrates, and in vegetable fat. Glycerol vectors Triglyceride, also triacylglycerol or triacylglyceride chemical structure. Triglyceride chemical structure. Also triacylglycerol or triacylglyceride, ester derived from glycerol and 3 fatty acids. Main constituents of body fat in humans, in vertebrates, and in vegetable fat.
Free with trial Lipolysis. Triglyceride Breakdown. Lipase is an enzyme that splits triglycerides into a glycerol molecule and three fatty acids. Vector illustration. Glycerol vectors Lipolysis. Triglyceride Breakdown
Free with trial Triglyceride structure fatty acids saturated fatty acids unsaturated fatty acids glycerol vector structure drawing illustration. Glycerol vectors Triglyceride structure fatty acids saturated fatty acids unsaturated fatty acids vector structure. Triglyceride structure fatty acids saturated fatty acids unsaturated fatty acids glycerol vector structure drawing illustration
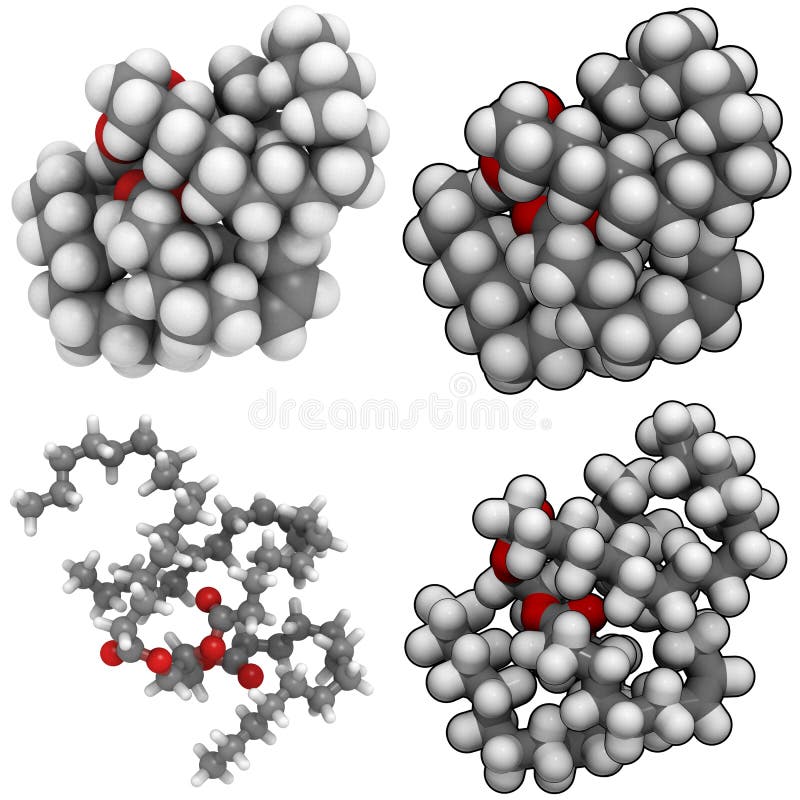
Free with trial Saturated animal fat triglyceride molecule. Typically found in animal (butter, cheese, beef) fat. Composed of glycerol molecule esterified with 3 fatty acids. Three representations: 2D skeletal formula, 3D ball-and-stick model, 3D space-filling model. Atoms are represented as spheres with conventional color coding: hydrogen (white), carbon (grey), oxygen (red. Glycerol illustrations Saturated animal fat triglyceride (butter, cheese, beef, etc) molecule. Saturated animal fat triglyceride molecule. Typically found in animal (butter, cheese, beef) fat. Composed of glycerol molecule esterified with 3 fatty acids. Three representations: 2D skeletal formula, 3D ball-and-stick model, 3D space-filling model. Atoms are represented as spheres with conventional color coding: hydrogen (white), carbon (grey), oxygen (red
Free with trial Available in high-resolution and good quality to fit the needs of your project. Glycerol vectors Product with `glycerol` or glycerin moisturizing compound information sign. Available in high-resolution and good quality to fit the needs of your project
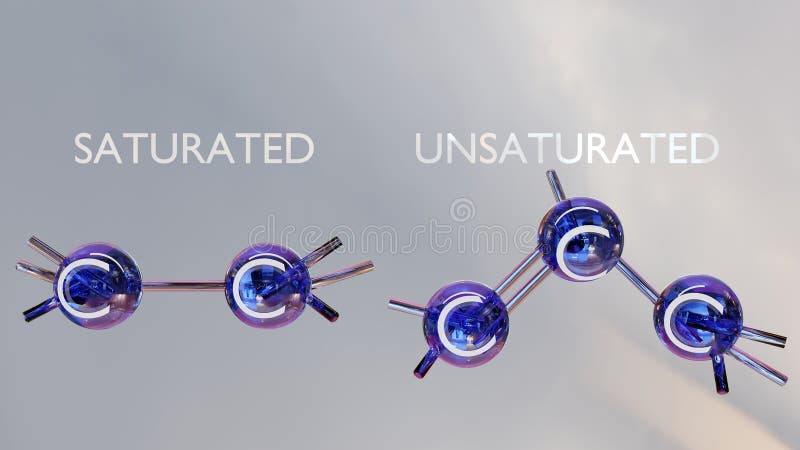
Free with trial Saturated and unsaturated fatty acids, triglyceride, triacylglycerol, triacylglyceride lipid, glycerol and 3 fatty acids, body fat in humans, structure formula, ball-and-stick model, 3d render. Glycerol illustrations Saturated and unsaturated fatty acids, triglyceride, triacylglycerol, triacylglyceride lipid, structure formula. saturated and unsaturated fatty acids, triglyceride, triacylglycerol, triacylglyceride lipid, glycerol and 3 fatty acids, body fat in humans, structure formula, ball-and-stick model, 3d render
Free with trial Nice sunflower vector illustration in a droplet. Glycerol vectors Sunflower drop. Nice sunflower vector illustration in a droplet
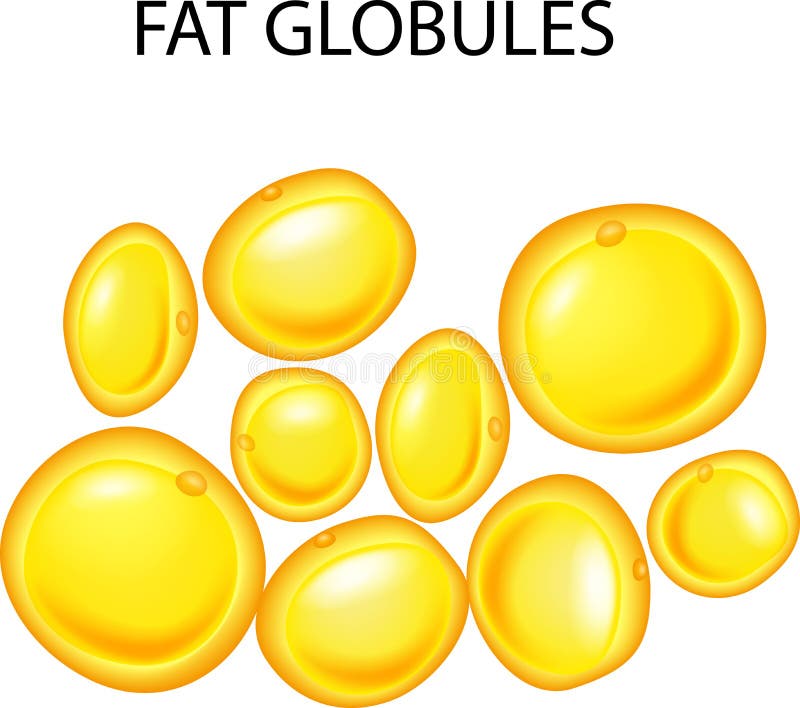
Free with trial Illustration of Illustration of fat globules. Glycerol vectors Illustration of fat globules
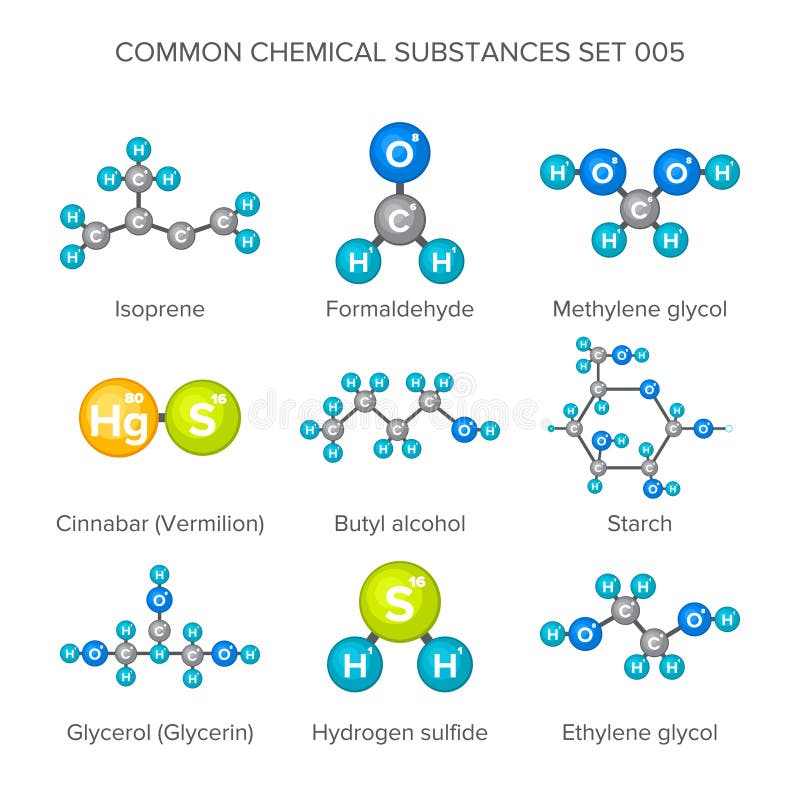
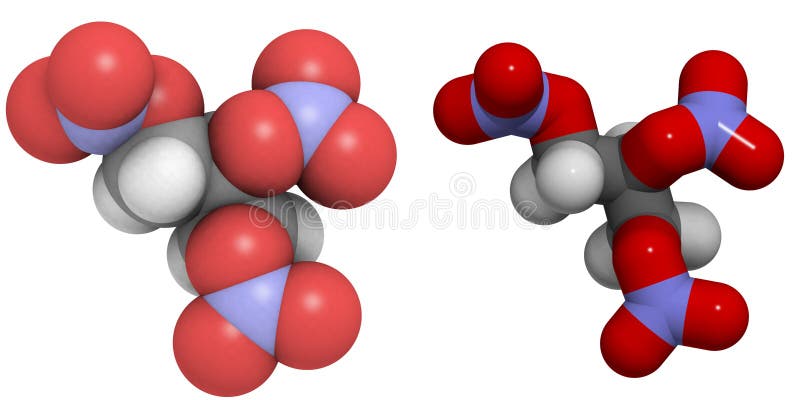
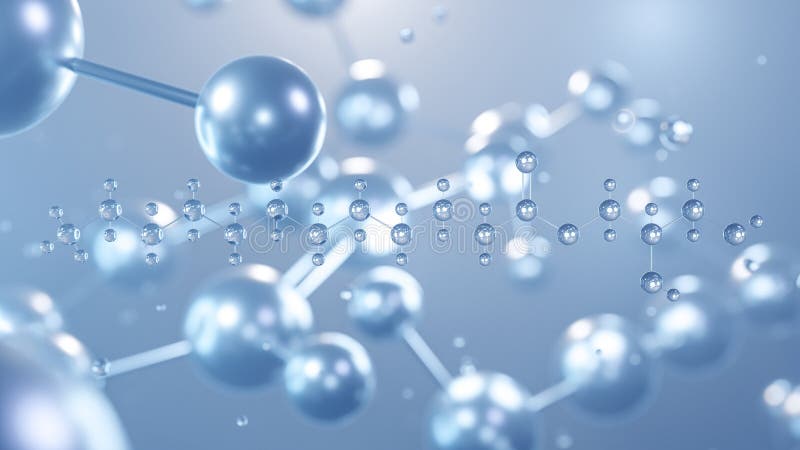
Free with trial Vector molecular structures of chemical substances isolated on white. Glycerol vectors Vector molecular structures of chemical substances isolated on white
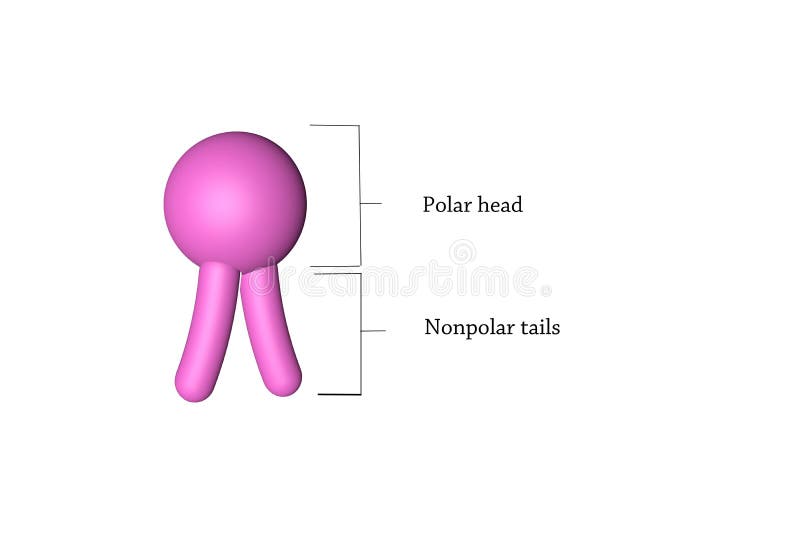
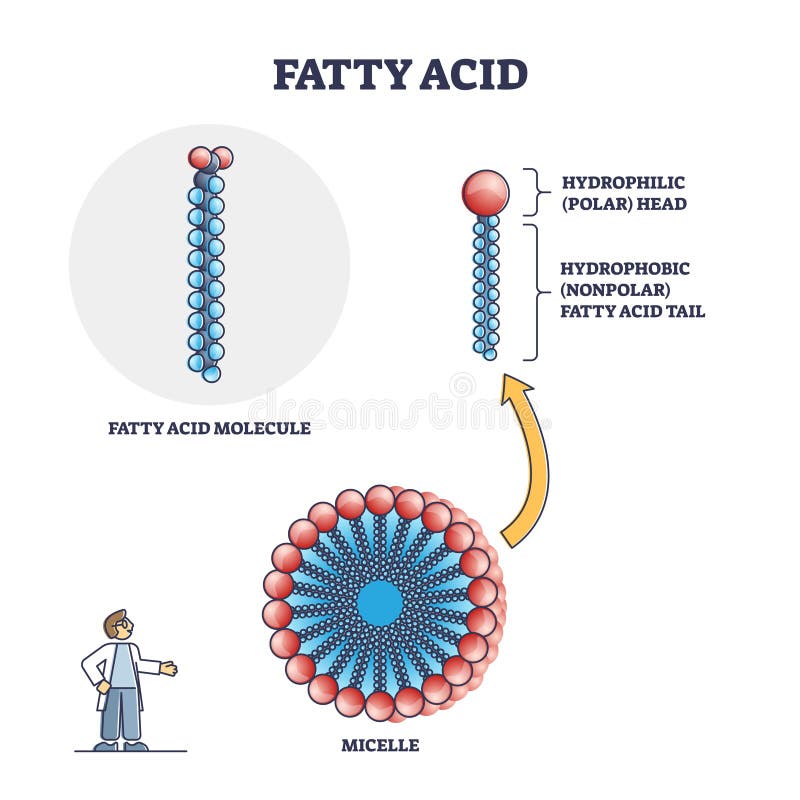
Free with trial Fatty acid molecule with micelle and side view structure outline diagram. Labeled educational chain with hydrophobic nonpolar tail and hydrophilic polar head vector illustration. Isolated closeup. Glycerol vectors Fatty acid molecule with micelle and side view structure outline diagram
Free with trial Phospholipid or phosphatides lipids microscopical structure outline diagram. Labeled educational description with cells hydrophilic head, hydrophobic tail and extracellular space vector illustration. Glycerol vectors Phospholipid or phosphatides lipids microscopical structure outline diagram
Free with trial Icons of E-Liquid. Vector E-Liquid illustration of different flavor. Liquid to vape. The taste of the electronic cigarette. Glycerol vectors Vector Icons of E-Liquid. Icons of E-Liquid. Vector E-Liquid illustration of different flavor.Liquid to vape. The taste of the electronic cigarette
Free with trial Biodiesel Production Process. It is renewable and natural domestic fuel extracted from animal fats or vegetable oils mostly from soy, bean, seed, palm oil. Glycerol vectors Biodiesel Production Process.
Free with trial Diagram depicting the metabolic processes in diabetic ketoacidosis (DKA). The liver is central, showing glycogen conversion to glucose and ketones. Pathways indicate increased glucagon, fatty acids, glycerol, and amino acids contributing to ketone production. A blood vessel highlights increased ketone and glucose levels. Text indicates the role of insufficient or absent insulin. Arrows connect substrates, glucose, and ketones with various cells, illustrating gluconeogenesis, glycogenolysis, and ketogenesis. Glycerol vectors Diabetic Ketoacidosis (DKA) sign and symptoms. Diagram depicting the metabolic processes in diabetic ketoacidosis (DKA). The liver is central, showing glycogen conversion to glucose and ketones. Pathways indicate increased glucagon, fatty acids, glycerol, and amino acids contributing to ketone production. A blood vessel highlights increased ketone and glucose levels. Text indicates the role of insufficient or absent insulin. Arrows connect substrates, glucose, and ketones with various cells, illustrating gluconeogenesis, glycogenolysis, and ketogenesis.
Free with trial Macromolecules formation from subunits to ribosomes as macromolecular assembles outline diagram. Labeled educational amino acids and nucleotides covalent bonding to protein and RNA vector illustration. Glycerol vectors Macromolecules formation from subunits to ribosomes assembles outline diagram. Macromolecules formation from subunits to ribosomes as macromolecular assembles outline diagram. Labeled educational amino acids and nucleotides covalent bonding to protein and RNA vector illustration
Free with trial Lipids digestion. Lipolysis. Enzymes lipase that catalyzes the hydrolysis of fats. vector flat illustration. Glycerol vectors Lipids digestion. Lipolysis
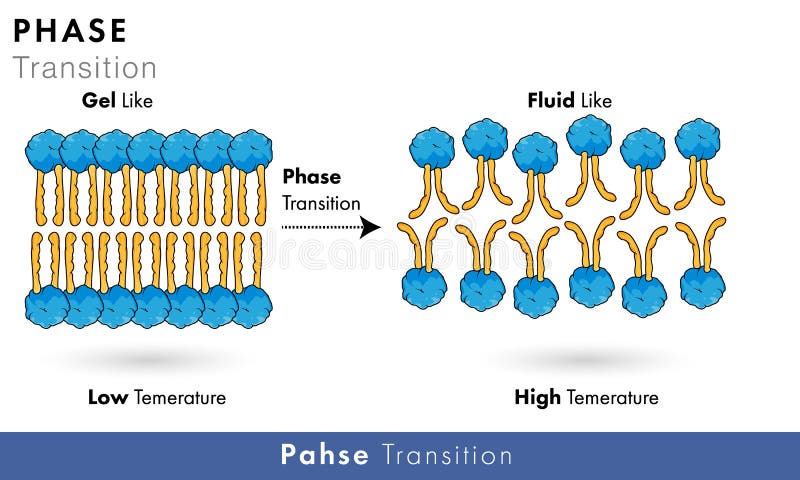
Free with trial Phase transition mechanism in Phospholipids of plasma membrane at different temperature vector design graphic for science projects and teaching. Glycerol illustrations Phase transition mechanism in Phospholipids of plasma membrane at different temperature vector design. Phase transition mechanism in Phospholipids of plasma membrane at different temperature vector design graphic for science projects and teaching
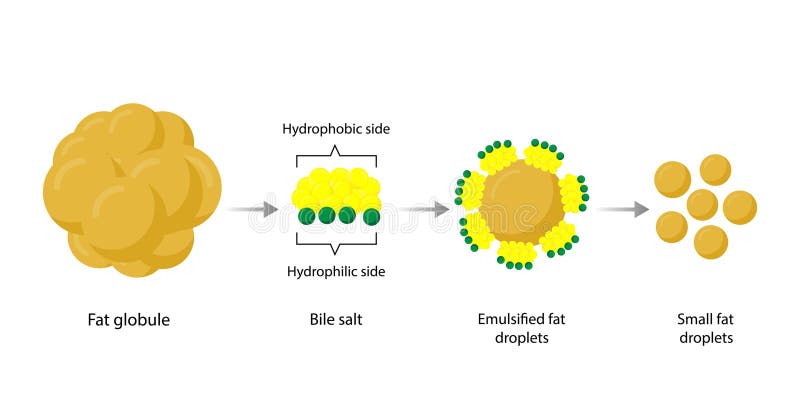
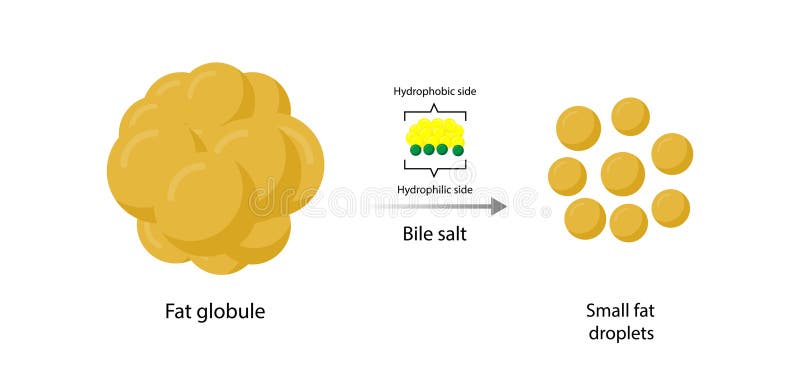
Free with trial Lipid emulsification, Fat Molecule, Lipid droplets, Lipid Digestion. Large fat globules are emulsified into small fat droplets. Bile salt. Gallbladder. Micelle formation. Vector Illustration. Glycerol vectors Lipid emulsification, Fat Molecule, Lipid droplets, Lipid Digestion.
Free with trial Lipid emulsification, Fat Molecule, Lipid droplets, Lipid Digestion. Large fat globules are emulsified into small fat droplets. Bile salt. Gallbladder. Micelle formation. Vector Illustration. Glycerol illustrations Lipid emulsification, Fat Molecule, Lipid droplets, Lipid Digestion.
Free with trial Lipid emulsification, Fat Molecule, Lipid droplets, Lipid Digestion. Large fat globules are emulsified into small fat droplets. Bile salt. Gallbladder. Micelle formation. Vector Illustration. Glycerol vectors Lipid emulsification, Fat Molecule, Lipid droplets, Lipid Digestion.
Free with trial Structure of the plasma membrane of a cell. Lipids and fats viewed under a microscope. 3d render. Glycerol illustrations Structure of the plasma membrane of a cell. Lipids and fats
Free with trial Use of laxatives rectal suppositories for constipation. Feces in colon. Infographics. Vector illustration on isolated background. Glycerol vectors Use of laxatives rectal suppositories for constipation. Feces in colon. Infographics. Vector illustration on isolated
Free with trial Structure of the plasma membrane of a cell. Lipids and fats viewed under a microscope. 3d render. Glycerol illustrations Structure of the plasma membrane of a cell. Lipids and fats
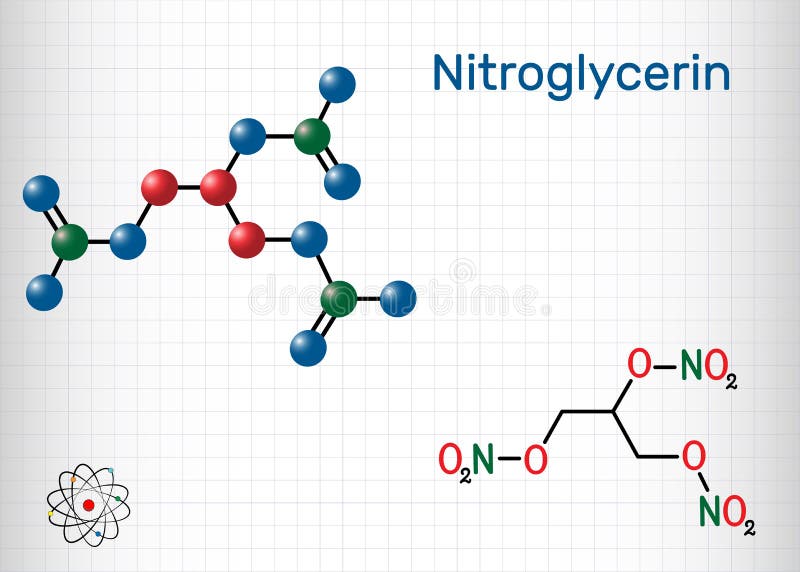
Free with trial Chemical structure of a nitroglycerine molecule, the explosive molecule found in dynamite that is also used as a drug to treat angina. Glycerol illustrations Nitroglycerine: molecular structure (3D). Chemical structure of a nitroglycerine molecule, the explosive molecule found in dynamite that is also used as a drug to treat angina.
Free with trial Triglyceride or triacylglycerol lipid science chemical structure formula and model 3D rendering illustration. Glycerol illustrations Triglyceride science molecule 3D render illustration. Triglyceride or triacylglycerol lipid science chemical structure formula and model 3D rendering illustration
Free with trial A molecule of triglyceride like it is typically found in animal (butter, cheese, beef) fat. It contains mostly saturated fatty acids. Glycerol illustrations Triglyceride (animal fat). A molecule of triglyceride like it is typically found in animal (butter, cheese, beef) fat. It contains mostly saturated fatty acids.
Free with trial Lipid formation, fat in the human body. View under the microscope. 3d render. Glycerol illustrations Lipid formation, fat in the human body. View under the microscope
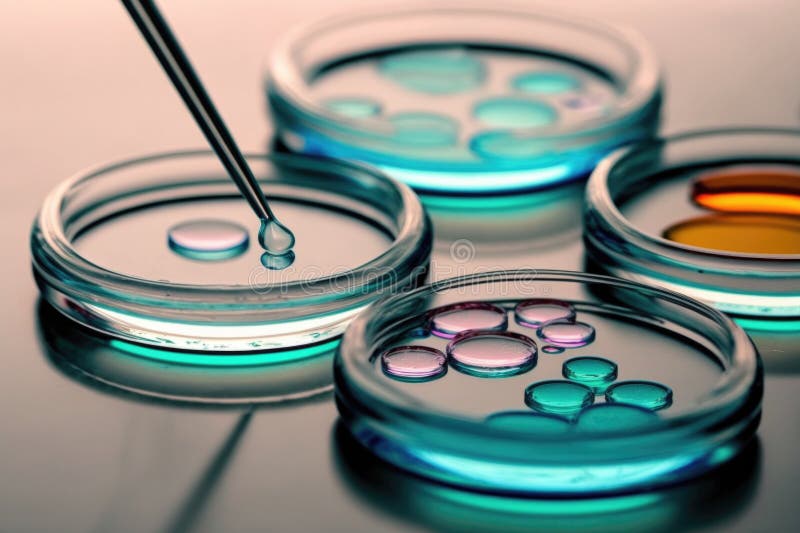
Free with trial Petri dishes medical lab illustration. Glycerol illustrations Petri dishes medical lab. Generative Ai. Petri dishes medical lab illustration.
Free with trial Revolutionizing Renewable Energy, The Power of Biofuel, Biofuel Energy, A Sustainable Solution for a Greener Future. Glycerol vectors The Power of Biofuel, Biofuel Energy, A Sustainable Solution for a Greener Future
Free with trial Fat cells and up arrow. concept of analysis of the state of the body, increasing cell growth, reproduction, congestion cellular mass. red yellow schematic representation on white background. Glycerol vectors Fat cells and up arrow
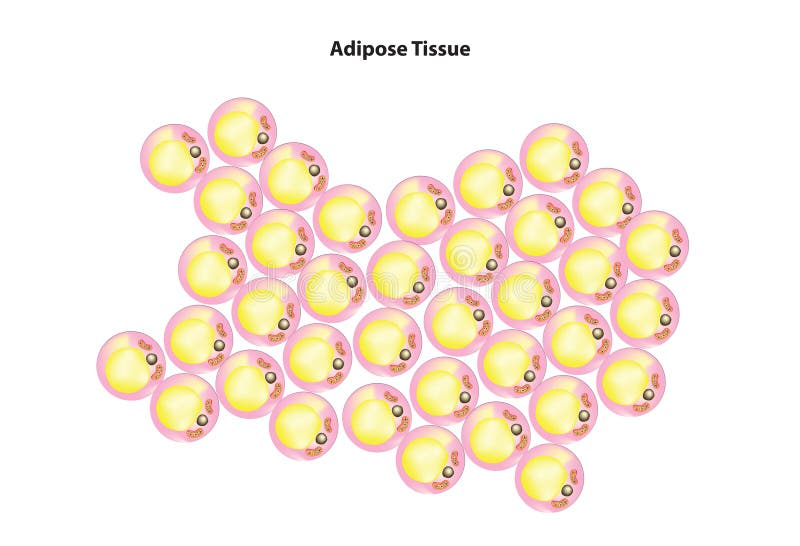
Free with trial Adipose tissue, commonly known as body fat, is a specialized connective tissue primarily composed of adipocytes (fat cells) that store energy in the form of fat. The main function of adipose tissue is energy storage. It serves as a reservoir for triglycerides, which are stored as lipid droplets within adipocytes. These triglycerides can be mobilized and broken down into fatty acids and glycerol to provide energy when needed by the body. Glycerol vectors Adipose tissue
Free with trial Biodiesel isolated icon. Simple element illustration from ecology concept. biodiesel editable logo symbol design on white background. Can be use for web and mobile. Glycerol vectors Biodiesel icon on white background. Simple element illustration from ecology concept. biodiesel isolated icon. Simple element illustration from ecology concept. biodiesel editable logo symbol design on white background. Can be use for web and mobile
Free with trial Isolated Structure of phospholipid molecules 3d rendering in the white background. Glycerol illustrations 3D ball structure of phospholipid molecules. isolated Structure of phospholipid molecules 3d rendering in the white background
Free with trial Monolaurin molecular structure 3d, flat model, monoglyceride, structural chemical formula view from a microscope. Glycerol illustrations Monolaurin molecular structure 3d, flat model, monoglyceride, structural chemical formula view from a microscope
Free with trial Nitroglycerin, glyceryl trinitrate, nitro molecule, is drug and explosive. Structural chemical formula and molecule model. Sheet of paper in a cage. Vector illustration. Glycerol vectors Nitroglycerin, glyceryl trinitrate, nitro molecule, is drug and explosive. Structural chemical formula and molecule model. Sheet
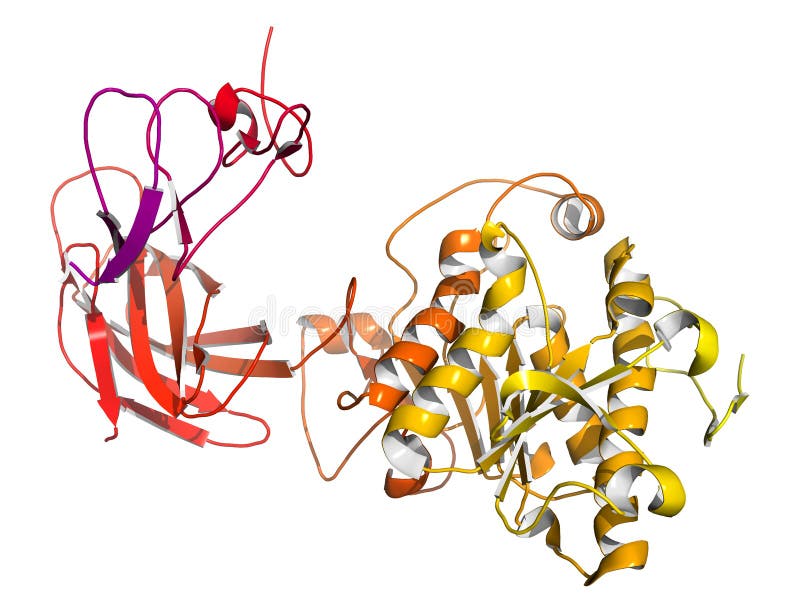
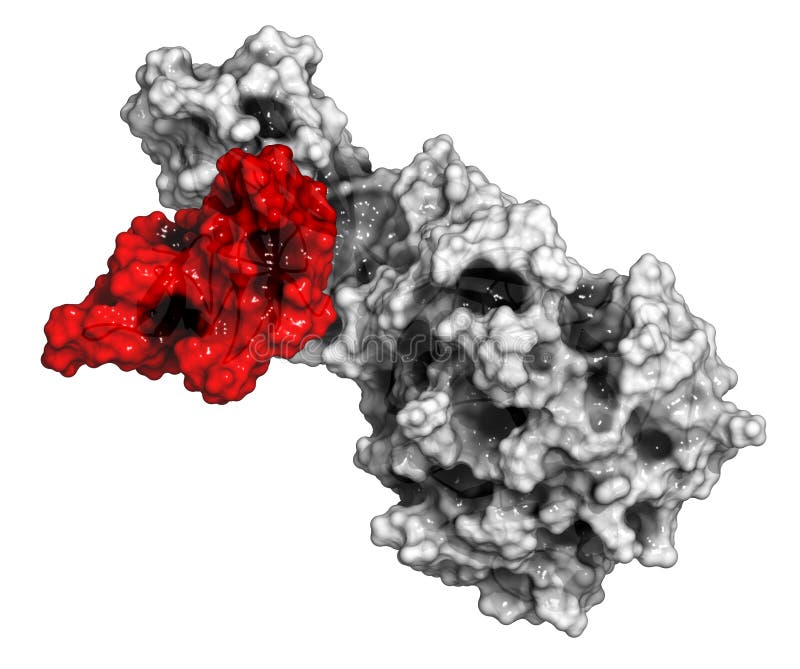
Free with trial Human pancreatic lipase (HPL) enzyme, in complex with colipase. Performs first steps in the digestion of triglycerides (fat, oil) in the duodenum. Cartoon model, N-to-C color gradient. Glycerol illustrations Human pancreatic lipase (HPL) enzyme, in complex with colipase. Performs first steps in the digestion of triglycerides (fat, oil)
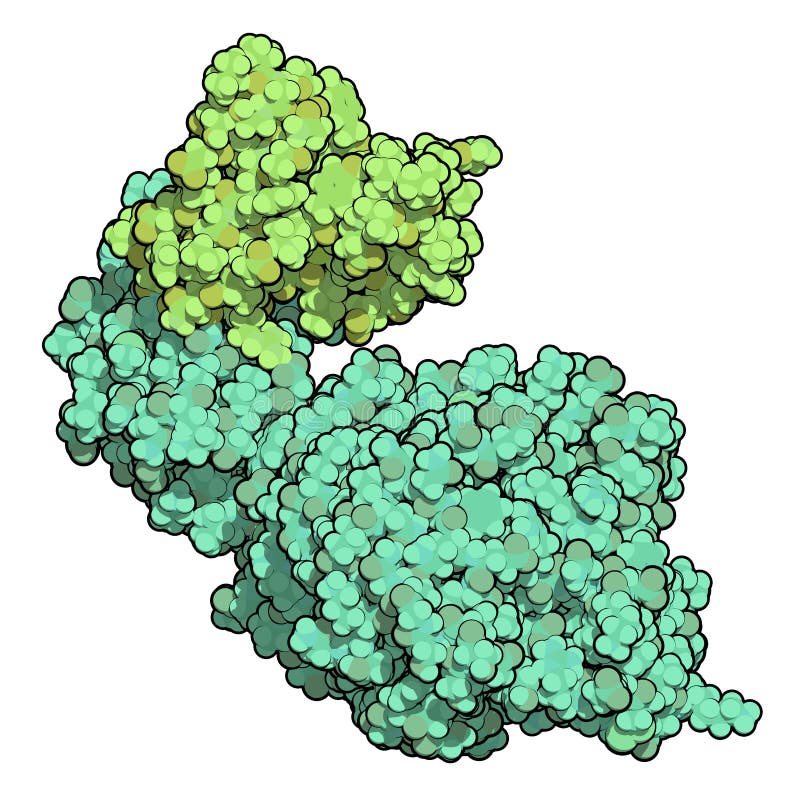
Free with trial Human pancreatic lipase (HPL) enzyme, in complex with colipase. Performs first steps in the digestion of triglycerides (fat, oil) in the duodenum. Atoms shown as color-coded spheres. Colipase colored green, lipase cyan. Glycerol illustrations Human pancreatic lipase (HPL) enzyme, in complex with colipase. Performs first steps in the digestion of triglycerides (fat, oil)
Free with trial Human pancreatic lipase (HPL) enzyme, in complex with colipase. Performs first steps in the digestion of triglycerides (fat, oil) in the duodenum. Cartoon model + semi-transparent surface. Colipase colored red, lipase colored grey. Glycerol illustrations Human pancreatic lipase (HPL) enzyme, in complex with colipase. Performs first steps in the digestion of triglycerides (fat, oil)
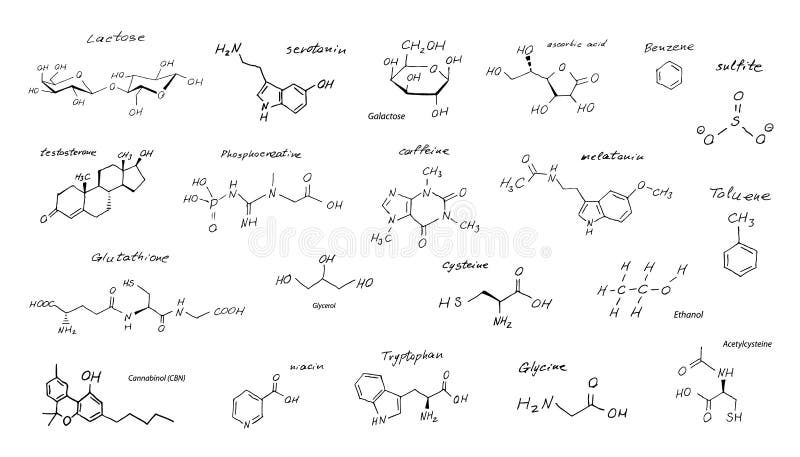
Free with trial Hand drawn chemistry formula set. Sketched molecule formulas, different chemical skeletal structural models collection, vector illustration. Glycerol vectors Hand Drawn Chemistry Formula Set, Sketched Molecule Formulas. Hand drawn chemistry formula set. Sketched molecule formulas, different chemical skeletal structural models collection, vector illustration
Free with trial Electronic cigarette set. Colorful vape pen hipster equipments for smoking. E-cigarette collection for vaping. Different vaporizers for vaping shop advertising. Vector flat eps illustration. Glycerol vectors Electronic cigarette set. Colorful vape pen hipster equipments for smoking. E-cigarette collection for vaping. Different
Free with trial Different cosmetic glass bottles reflections standing on orange beige background. Abstract pattern by shadows and illumination in the sunlight. Red and yellow shades. Flat lay style with copy space. Glycerol illustrations Different cosmetic glass bottles reflections standing on orange beige background. Abstract pattern
Free with trial Glycerol, Glycerin, Glycerine. Structural Chemical Formula and 3d Model of Molecule. C3H8O3. Atoms with Color Coding. Vector Illustration for educational materials, scientific articles, presentations. Glycerol vectors Glycerol, Glycerin, Glycerine. Structural Chemical Formula and 3d Model of Molecule. C3H8O3. Atoms with Color Coding. Vector
Free with trial Glycerol molecule diagram with chemical structure and formula on water surface featuring liquid, chemistry, science with laboratory and research elements for glycerin, glycerine projects, clean. Glycerol illustrations Glycerol molecule diagram with chemical structure and formula on water surface featuring
Free with trial Illustrates the chemical structure of Glycerol showing its carbon backbone hydroxyl groups and a methyl group presented as a clean scientific diagram. Glycerol illustrations Chemical structure of Glycerol with hydroxyl and methyl groups depicted. Illustrates the chemical structure of Glycerol showing its carbon backbone hydroxyl. Illustrates the chemical structure of Glycerol showing its carbon backbone hydroxyl groups and a methyl group presented as a clean scientific diagram
Free with trial Triglyceride structure icon. Glycerol backbone connected to three fatty acids. Simplified molecular diagram for biology, biochemistry, and nutrition education. Vector illustration. Editable stroke. Glycerol vectors Triglyceride structure icon. Glycerol backbone connected to three fatty acids.
Free with trial Triglyceride structure icon. Glycerol backbone connected to three fatty acids. Simplified molecular diagram for biology, biochemistry, and nutrition education. Vector illustration. Editable stroke. Glycerol vectors Triglyceride structure icon. Glycerol backbone connected to three fatty acids.
Free with trial Chemical structure of glycerol formal, drug substance. Glycerol illustrations Chemical structure of glycerol formal, drug substance
Free with trial Glycerol, also known as glycerine, is a simple polyol compound forming a sugar alcohol with three hydroxyl groups. Glycerol vectors Glycerol Molecular Structure with Hydroxyl Groups forming Sugar Alcohol. Glycerol, also known as glycerine, is a simple polyol compound forming a sugar alcohol with three hydroxyl groups
Free with trial Glycerol, or glycerine, is a simple polyol compound forming the backbone of triglycerides. Glycerol vectors Glycerol Molecular Structure with Plexus Effect Representing Chemical Bonds. Glycerol, or glycerine, is a simple polyol compound forming the backbone of triglycerides