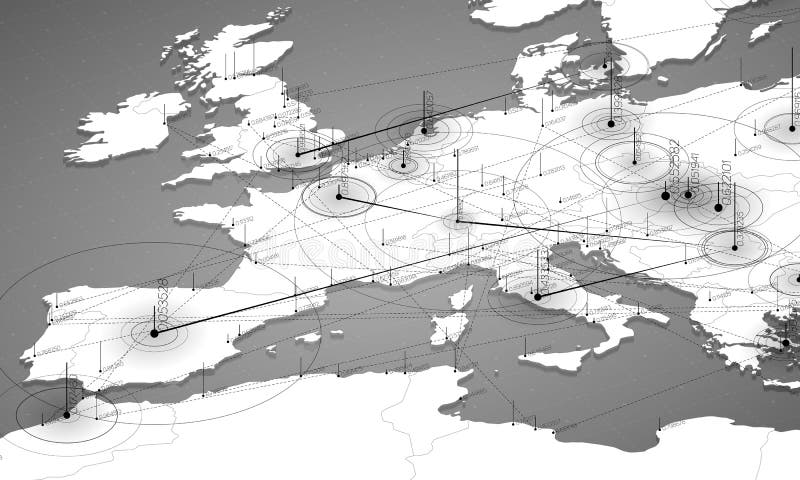
Free with trial Europe grayscale map big data visualization. Futuristic map infographic. Information aesthetics. Visual data complexity. Complex europe data graphic visualization. Abstract data on map graph. Grayscale visualization vectors Europe grayscale map big data visualization. Futuristic map infographic. Information aesthetics. Visual data complexity.
Free with trial Big data grayscale plot visualization. Futuristic infographic. Information aesthetic design. Visual data complexity. Complex data threads graphic visualization. Social network. Abstract data graph. Grayscale visualization vectors Big data grayscale plot visualization. Futuristic infographic. Information aesthetic design. Visual data complexity.
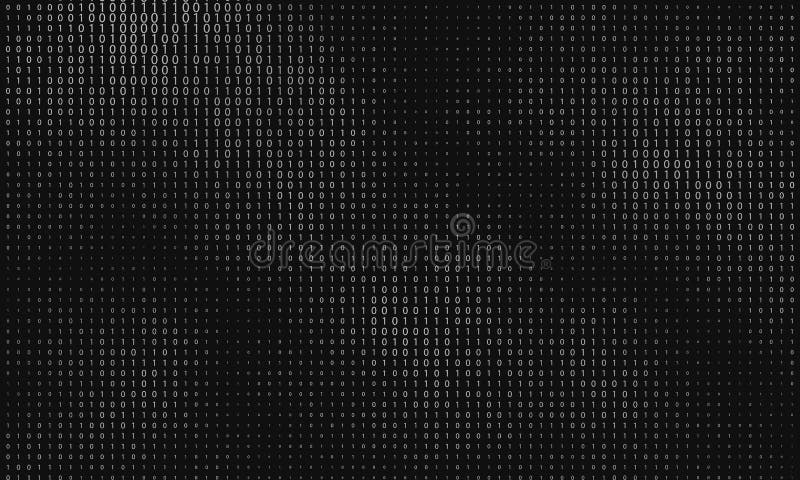
Free with trial Vector abstract big data visualization. Grayscale data flow as binary numbers strings. Computer code representation. Cryptographic analysis hacking. Bitcoin blockchain transfer. Program code pattern. Grayscale visualization vectors Vector abstract big data visualization. Grayscale data flow as binary numbers strings. Computer code representation
Free with trial Big data grayscale visualization. Futuristic infographic. Information aesthetic design. Visual data complexity. Complex data threads graphic visualization. Social network representation. Grayscale visualization vectors Big data grayscale visualization. Futuristic infographic. Information aesthetic design. Visual data complexity.
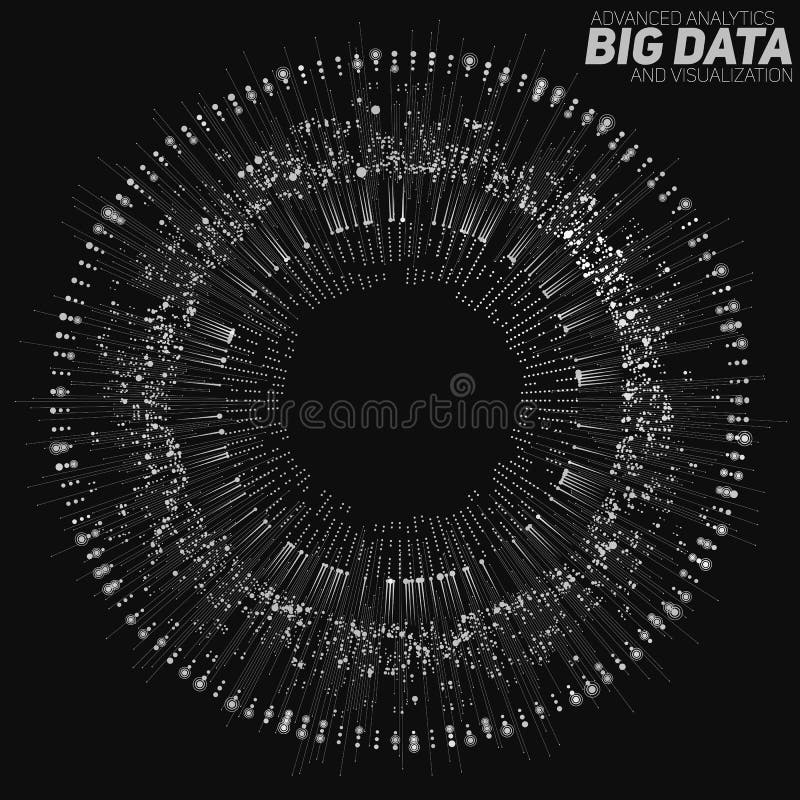
Free with trial Big data circular grayscale visualization. Futuristic infographic. Information aesthetic design. Visual data complexity. Complex data threads graphic visualization. Social network. Abstract data graph. Grayscale visualization vectors Big data circular grayscale visualization. Futuristic infographic. Information aesthetic design. Visual data complexity.
Free with trial Big data circular grayscale visualization. Futuristic infographic. Information aesthetic design. Visual data complexity. Complex data threads graphic visualization. Social network. Abstract data graph. Grayscale visualization vectors Big data circular grayscale visualization. Futuristic infographic. Information aesthetic design. Visual data complexity.
Free with trial Vector data flow visualization. Grayscale big data flow as binary numbers strings twisted in infinity tunnel. Information code stream. Cryptographic analysis. Bitcoin blockchain transfer. Grayscale visualization vectors Vector data flow visualization. Grayscale big data flow as binary numbers strings twisted in infinity tunnel.
Free with trial Vector abstract grayscale big data visualization. Futuristic infographics aesthetic design. Visual information complexity. Intricate data threads graphic. Social network or business analytics. Grayscale visualization vectors Vector abstract grayscale big data visualization. Futuristic infographics aesthetic design.
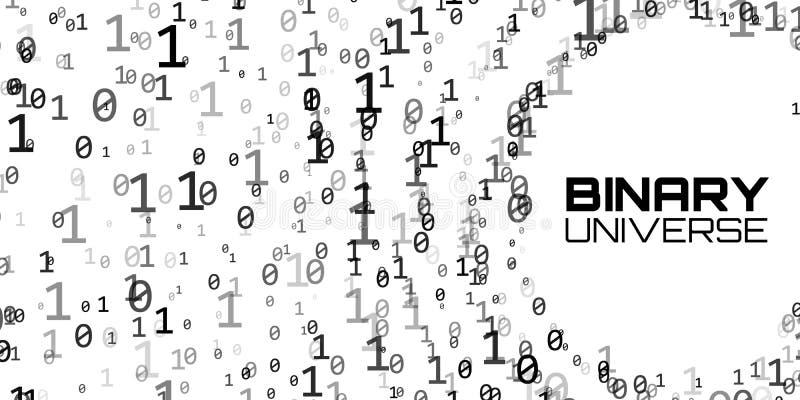
Free with trial Vector abstract big data visualization. Grayscale glowing data flow as binary numbers. Computer code representation. Cryptographic analysis, hacking. Bitcoin, blockchain transfer. Program code pattern. Grayscale visualization vectors Vector abstract big data visualization. Grayscale glowing data flow as binary numbers. Computer code representation
Free with trial Vector abstract grayscale big data visualization. Futuristic infographics aesthetic design. Visual information complexity. Intricate data threads graphic. Social network or business analytics. Grayscale visualization vectors Vector abstract grayscale big data visualization. Futuristic infographics aesthetic design. Visual information
Free with trial Big data grayscale visualization. Futuristic infographic. Information aesthetic design. Visual data complexity. Complex data threads graphic visualization. Social network, abstract data graph. Grayscale visualization vectors Big data grayscale visualization. Futuristic infographic. Information aesthetic design. Visual data complexity.
Free with trial Big data circular grayscale visualization. Futuristic infographic. Information aesthetic design. Visual data complexity. Complex data threads graphic. Social network representation. Abstract graph. Grayscale visualization vectors Big data circular grayscale visualization. Futuristic infographic. Information aesthetic design. Visual data complexity.
Free with trial Big data grayscale visualization. Futuristic infographic. Information aesthetic design. Visual data complexity. Complex data threads graphic visualization. Social network, abstract data graph. Grayscale visualization vectors Big data grayscale visualization. Futuristic infographic. Information aesthetic design. Visual data complexity.
Free with trial Lemnos. Administrative area of Greece highlighted and outlined on a darkened grayscale elevation map. Grayscale visualization illustrations Lemnos highlighted, Greece. Grayscale. Lemnos. Administrative area of Greece highlighted and outlined on a darkened grayscale elevation map
Free with trial Lemnos. Administrative area of Greece isolated on white on a grayscale elevation map. Grayscale visualization illustrations Lemnos, Greece, isolated on white. Grayscale. Lemnos. Administrative area of Greece isolated on white on a grayscale elevation map
Free with trial Barcelona. Administrative area of Spain isolated on white on a grayscale elevation map. Grayscale visualization illustrations Barcelona, Spain, isolated on white. Grayscale. Barcelona. Administrative area of Spain isolated on white on a grayscale elevation map
Free with trial La Marina Alta. Administrative area of Spain highlighted and outlined on a darkened grayscale elevation map. Grayscale visualization illustrations La Marina Alta highlighted, Spain. Grayscale. la Marina Alta. Administrative area of Spain highlighted and outlined on a darkened grayscale elevation map
Free with trial La Vall d'Albaida. Administrative area of Spain isolated on white on a grayscale elevation map. Grayscale visualization illustrations La Vall d'Albaida, Spain, isolated on white. Grayscale. la Vall d'Albaida. Administrative area of Spain isolated on white on a grayscale elevation map
Free with trial Big data visualization. Futuristic infographic. Information aesthetic design. Visual data complexity. Complex data threads graphic visualization. Social network representation. Abstract data graph. Grayscale visualization vectors Big data visualization. Futuristic infographic. Information aesthetic design. Visual data complexity.
Free with trial Vector 3d echo audio wavefrom spectrum. Music waves oscillation graph futuristic visualization. Grayscale faded impulse pattern. Or Abstract relief map. Landscape elevation concept. Grayscale visualization vectors Vector 3d echo audio wavefrom spectrum. Music waves oscillation graph futuristic visualization. Grayscale faded impulse
Free with trial Vector grayscale abstract brain tomography analysis illustration. Digital brain x-ray scan. Medical data MRI visualization concept. Futuristic healthcare software HUD UI. Data driven image. Human head. Grayscale visualization vectors Vector grayscale abstract brain tomography analysis illustration. Digital brain x-ray scan.
Free with trial Vector cyber sphere. Grayscale big data sphere with binary numbers strings. Information code structure representation. Cryptographic analysis. Bitcoin blockchain transfer. Grayscale visualization vectors Vector cyber sphere. Grayscale big data sphere with binary numbers strings. Information code structure representation
Free with trial Vector grayscale abstract brain tomography analysis illustration. Digital brain x-ray scan. Medical data MRI visualization concept. Futuristic healthcare software HUD UI. Data driven image. Human head. Grayscale visualization vectors Vector grayscale abstract brain tomography analysis illustration. Digital brain x-ray scan.
Free with trial Vector abstract big data visualization. Futuristic infographics aesthetic design. Visual information complexity. Intricate data threads graphic. Social network or business analytics representation. Grayscale visualization vectors Vector abstract big data visualization. Futuristic infographics aesthetic design. Visual information complexity.
Free with trial A set of four optical illusion designs featuring impossible geometry like the Penrose triangle and Penrose stairs, alongside a wireframe cube representation. This visualization of paradoxical 3D shapes and concepts was Rendered by Ai. Grayscale visualization vectors Impossible figures collection and geometric shapes. A set of four optical illusion designs featuring impossible geometry like the Penrose triangle and Penrose stairs, alongside a wireframe cube representation. This visualization of paradoxical 3D shapes and concepts was Rendered by Ai
Free with trial Three Infographic Elements Ribbons Arrows on Grayscale Background. Grayscale visualization vectors Three Infographic Elements Ribbons Arrows on Grayscale
Free with trial Modern infographic brochure template. Pages with diagram, graph, chart and workflow elements. Business data visualization concept. Vector illustration for presentation, statistics report, website. Grayscale visualization vectors Modern infographic brochure template
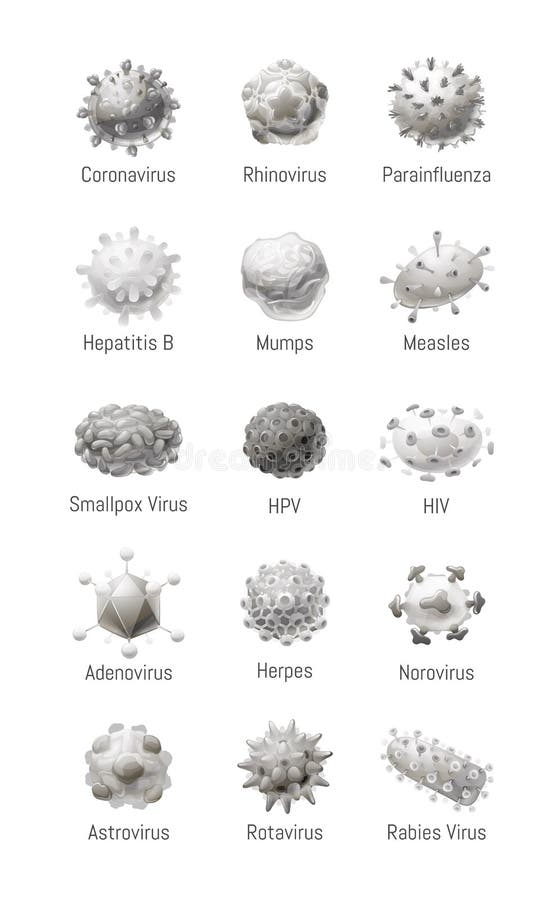
Free with trial Vector set of common viruses. Microbiology, models of pathogens. Vector illustration in cartoon style, isolated objects, grayscale. Grayscale visualization vectors Vector set of common viruses. Models of pathogens. Vector set of common viruses. Microbiology, models of pathogens. Vector illustration in cartoon style, isolated objects, grayscale.
Free with trial An architectural drawing of a modern beach cottage, showcasing opulent architecture and dreamlike design. the black and white grayscale adds a rich and immersive feel to the image, reminiscent of phoenician art. this hdr-rendered drawing captures the essence of tropical landscapes, creating a visually stunning representation of a luxurious coastal retreat. Grayscale visualization illustrations Modern Detailed Drawing Of Garden Luxury Villa With Palm Trees And Fountain. an architectural drawing of a modern beach cottage, showcasing opulent architecture and dreamlike design. the black and white grayscale adds a rich and immersive feel to the image, reminiscent of phoenician art. this hdr-rendered drawing captures the essence of tropical landscapes, creating a visually stunning representation of a luxurious coastal retreat.
Free with trial Vector grayscale Bitcoin word constructed with numbers. Bitcoin, blockchain transfer. Computer code representation. Cryptographic analysis, hacking. Pattern of program code. Grayscale visualization vectors Vector grayscale Bitcoin word constructed with numbers. Bitcoin, blockchain transfer. Computer code representation.
Free with trial A striking, AI-generated 3D illustration of human lungs constructed from a delicate wireframe lattice structure. This grayscale model symbolizes advanced respiratory health, biomedical innovation, and cutting-edge biotechnology for medical professionals and researchers. Grayscale visualization illustrations Abstract Digital Model of Human Lungs Representing Respiratory Health and Technology. A striking, AI-generated 3D illustration of human lungs constructed from a delicate wireframe lattice structure. This grayscale model symbolizes advanced respiratory health, biomedical innovation, and cutting-edge biotechnology for medical professionals and researchers.
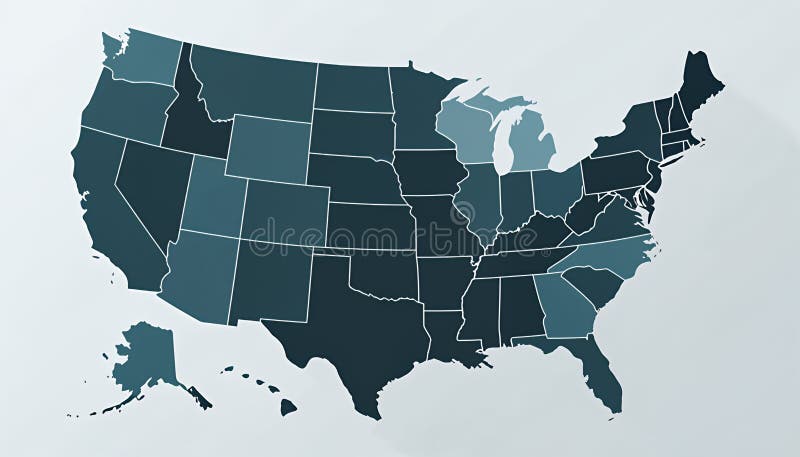
Free with trial A detailed map of the United States, highlighting each state with different shades of dark teal blue. Grayscale visualization illustrations US States Map with Tonal Shading for Data Visualization. A detailed map of the United States, highlighting each state with different shades of dark teal blue.
Free with trial Template of futuristic infographic icons with glowing elements on grayscale background. Grayscale visualization vectors Template of futuristic infographic icons with glowing elements o
Free with trial Halftone gradient hexagon fades texture background for banner, web site, poster, bussines card, visualization big data. Futuristic honeycomb abstract backdrop vector 10 eps. Grayscale visualization vectors Halftone gradient hexagon fades texture background for banner, web site, poster
Free with trial Edgy monochrome circular element. Black and white angular motif, shape - Royalty free vector illustration. Grayscale visualization vectors Edgy monochrome circular element. Black and white angular motif, shape
Free with trial Vibrant audio spectrogram with red green blue purple vertical sound waves. Fading to grayscale on dark background. Ideal for music production, podcast art, and audio engineering. Sound frequency analysis visualization for technology and media projects. Grayscale visualization illustrations Audio spectrogram visualization. Colorful vertical sound wave pattern. Red green blue purple gradient fading to grayscale on dark. Vibrant audio spectrogram with red green blue purple vertical sound waves. Fading to grayscale on dark background. Ideal for music production, podcast art, and audio engineering. Sound frequency analysis visualization for technology and media projects
Free with trial A sleek and modern abstract visualization of a sound wave depicted in grayscale tones. This graphic represents audio frequency patterns with smooth flowing lines and dynamic waveform shapes, ideal for music production, audio technology, sound engineering presentations, or digital media projects. The minimalist black-and-white palette emphasizes clarity and precision, making it versatile for professional and creative uses. Grayscale visualization illustrations Abstract Grayscale Waveform Sound Wave Frequency Visualization. A sleek and modern abstract visualization of a sound wave depicted in grayscale tones. This graphic represents audio frequency patterns with smooth flowing lines and dynamic waveform shapes, ideal for music production, audio technology, sound engineering presentations, or digital media projects. The minimalist black-and-white palette emphasizes clarity and precision, making it versatile for professional and creative uses.
Free with trial This abstract network visualization features grayscale nodes and lines, representing data connections and relationships. Ideal for technology and design projects. Grayscale visualization illustrations Abstract Network Visualization with Nodes and Connections in Grayscale. This abstract network visualization features grayscale nodes and lines, representing data connections and relationships. Ideal for technology and design projects
Free with trial The image displays a detailed grayscale visualization resembling noise or static, characterized by varying pixel intensities. The patterns create a complex, chaotic texture with vertical streaks and irregular clusters, forming an abstract and visually dense composition. The monochromatic scheme accentuates the depth and randomness of the distribution. Grayscale visualization illustrations Intricate patterns of a high-resolution grayscale noise visualization. The image displays a detailed grayscale visualization resembling noise or static. The image displays a detailed grayscale visualization resembling noise or static, characterized by varying pixel intensities. The patterns create a complex, chaotic texture with vertical streaks and irregular clusters, forming an abstract and visually dense composition. The monochromatic scheme accentuates the depth and randomness of the distribution
Free with trial This grayscale architectural visualization depicts a futuristic cityscape with towering skyscrapers and a lower urban base. The design features geometric shapes, layers of buildings, and repetitive structural elements, creating a sense of modern urban density and architectural complexity. The use of shading and perspective emphasizes depth and scale, while the monochromatic palette adds a. Grayscale visualization illustrations Abstract architectural visualization of a modern cityscape in grayscale. This grayscale architectural visualization depicts a futuristic cityscape with towering skyscrapers and a lower urban base. The design features geometric shapes, layers of buildings, and repetitive structural elements, creating a sense of modern urban density and architectural complexity. The use of shading and perspective emphasizes depth and scale, while the monochromatic palette adds a
Free with trial The image displays a three-dimensional grayscale visualization of a complex, branching network structure resembling a biological system, such as a neuron or vascular system. The network consists of numerous interconnected branches that spread outward from a central node, creating a dense and intricate pattern. The varying shades of gray suggest depth and density differences, with lighter areas. Grayscale visualization illustrations A 3d visualization of a complex, branching network structure in grayscale. The image displays a three-dimensional grayscale visualization of a complex, branching network structure resembling a biological system, such as a neuron or vascular system. The network consists of numerous interconnected branches that spread outward from a central node, creating a dense and intricate pattern. The varying shades of gray suggest depth and density differences, with lighter areas
Free with trial This image depicts a grayscale pixel art representation of a data visualization pattern. It features a dense grid of black, white, and varying shades of gray pixels arranged in a wave-like or flowing pattern, suggesting movement or a flow of data. The pattern is abstract and lacks any specific context, focusing purely on the visual interplay of light and shadow. Grayscale visualization illustrations An abstract representation of data visualization using grayscale pixel art. This image depicts a grayscale pixel art representation of a data visualization pattern. It features a dense grid of black, white, and varying shades of gray pixels arranged in a wave-like or flowing pattern, suggesting movement or a flow of data. The pattern is abstract and lacks any specific context, focusing purely on the visual interplay of light and shadow
Free with trial Abstract grayscale vertical stripes background. Perfect for modern design, tech themes, data visualization, or as a stylish texture overlay. Grayscale visualization vectors Abstract grayscale vertical stripes background. Perfect for modern design, tech themes, data visualization, or as a stylish
Free with trial A grayscale audio waveform visualization centered horizontally. The waveform varying peaks and troughs representing sound amplitude and frequency. The is rendered in shades of black and gray, creating a stark contrast. It is isolated on a transparent background, making it layering over other visual The pattern is symmetrical along the central horizontal axis, mimicking a standard digital sound. Grayscale visualization illustrations Grayscale audio waveform visualization isolated on a transparent background, for sound analysis. a grayscale audio waveform visualization centered horizontally. The waveform varying peaks and troughs representing sound amplitude and frequency. The is rendered in shades of black and gray, creating a stark contrast. It is isolated on a transparent background, making it layering over other visual The pattern is symmetrical along the central horizontal axis, mimicking a standard digital sound
Free with trial Abstract pixel noise pattern, grayscale AI neural network visualization. Data activation map or digital signal distortion texture. Tech research background. Vector illustration. Grayscale visualization vectors Abstract pixel noise pattern, grayscale AI neural network visualization. Data activation map or digital signal
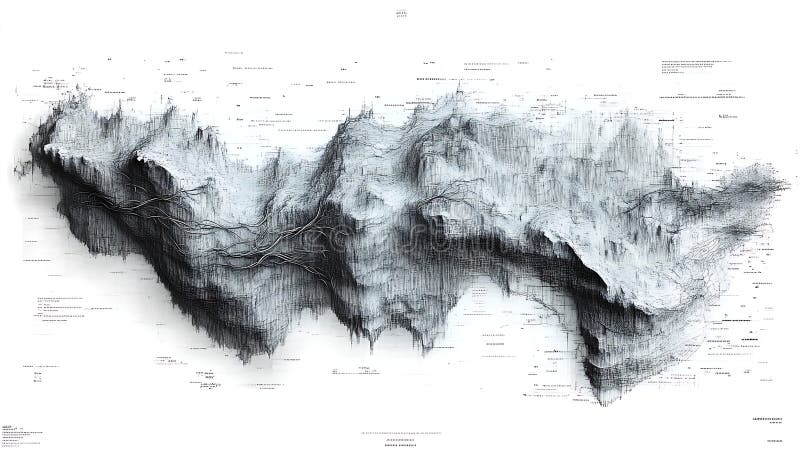
Free with trial The image presents an abstract, grayscale visualization of a mountain range. the peaks and valleys are rendered with a textured, almost granular effect, creating a sense of depth and dimension. the lighting is soft and diffused, highlighting the intricate details of the terrain. the overall impression is one of a minimalist, yet complex landscape, rendered in a monochromatic palette. the foreground is more in focus than the background. Grayscale visualization illustrations Abstract grayscale mountain range visualization. the image presents an abstract, grayscale visualization of a mountain range. the peaks and valleys are rendered with a textured, almost granular effect, creating a sense of depth and dimension. the lighting is soft and diffused, highlighting the intricate details of the terrain. the overall impression is one of a minimalist, yet complex landscape, rendered in a monochromatic palette. the foreground is more in focus than the background.
Free with trial Abstract grayscale cubes, digital art, white background, data visualization, lavish wallpaper background Generative AI. Grayscale visualization illustrations Abstract grayscale cubes, digital art, white background, data visualization
Free with trial Abstract grayscale cubes, digital art, white background, data visualization, rich texture background Generative AI. Grayscale visualization illustrations Abstract grayscale cubes, digital art, white background, data visualization
Free with trial Flowing grayscale 3D ribbons weaving across monospaced data sheet, showing cyan bars. Abstract, grid, overlay, tubular, monochrome, visualization, geometry. Grayscale visualization illustrations Flowing grayscale 3D ribbons weaving across monospaced data sheet, showing cyan bars
Free with trial Displaying grayscale pie chart offset right on dashboard, showing red blue lines and dotted bars. Circular, segments, monochrome, infographic, visualization, interface, gridlines. Grayscale visualization illustrations Displaying grayscale pie chart offset right on dashboard, showing red blue lines and dotted bars
Free with trial Displaying grayscale 3D bar chart showing layered line plots on printed page, numeric annotations. Data, visualization, monochrome, grid, triangles, metrics, analytics. Grayscale visualization illustrations Displaying grayscale 3D bar chart showing layered line plots on printed page, numeric annotations
Free with trial A clean and minimalist abstract grayscale waveform displayed over technical grid paper. The monochrome color palette enhances the modern, scientific, and analytical feel of the image, making it ideal for illustrating audio signals, frequency analysis, digital sound waves, or data visualization. Perfect for use in technology-related projects, music production content, educational materials, UI UX mockups, backgrounds for presentations, or scientific publications. The combination of precise lines and abstract form gives this artwork a unique blend of creativity and technical clarity. Grayscale visualization illustrations . A clean and minimalist abstract grayscale waveform displayed over technical grid paper. The monochrome color palette enhances the modern, scientific, and analytical feel of the image, making it ideal for illustrating audio signals, frequency analysis, digital sound waves, or data visualization. Perfect for use in technology-related projects, music production content, educational materials, UI UX mockups, backgrounds for presentations, or scientific publications. The combination of precise lines and abstract form gives this artwork a unique blend of creativity and technical clarity.
Free with trial The image is an abstract grayscale artwork depicting a mountainous landscape created through data visualization techniques, showcasing intricate lines and textures. Grayscale visualization illustrations Abstract Data Visualization Mountainous Terrain. The image is an abstract grayscale artwork depicting a mountainous landscape created through data visualization techniques, showcasing intricate lines and textures
Free with trial A sophisticated 3D abstract visualization showcases a dynamic sound waveform or audio spectrum against a grayscale grid background. This monochrome graphic represents complex data and scientific concepts with its layered, wave-like structures. Grayscale visualization illustrations Abstract 3D Sound Waveform Visualization, Dynamic Audio Spectrum, Monochrome Data Graph. A sophisticated 3D abstract visualization showcases a dynamic sound waveform or audio spectrum against a grayscale grid background. This monochrome graphic represents complex data and scientific concepts with its layered, wave-like structures.
Free with trial This image depicts a series of pixelated concentric circles, radiating outward from a central point. The design creates an intricate ripple effect, reminiscent of a pebble dropped into water or a sound wave visualization. The grayscale color scheme enhances the geometric and symmetrical qualities, giving it a digital, almost retro aesthetic. The pixelation adds texture and a nostalgic feel,. Grayscale visualization illustrations Concentric ripple patterns in pixelated grayscale art. This image depicts a series of pixelated concentric circles, radiating outward from a central point. The design creates an intricate ripple effect, reminiscent of a pebble dropped into water or a sound wave visualization. The grayscale color scheme enhances the geometric and symmetrical qualities, giving it a digital, almost retro aesthetic. The pixelation adds texture and a nostalgic feel,
Free with trial A set of grayscale 3D icons including a volcano, lightning bolt, cloud, globe, robot, bar graph, feather, and other shapes, arranged on a black background. The icons appear to be pixelated and have a futuristic feel. This image could be used for various purposes such as illustrating a technological concept, representing data visualization, or as a design element for a website or presentation. Grayscale visualization illustrations Collection of grayscale 3D icons on black background. A set of grayscale 3D icons including a volcano, lightning bolt, cloud, globe, robot, bar graph, feather, and other shapes, arranged on a black background. The icons appear to be pixelated and have a futuristic feel. This image could be used for various purposes such as illustrating a technological concept, representing data visualization, or as a design element for a website or presentation.
Free with trial This image displays an abstract, symmetrical pattern resembling radiating light or energy beams emanating from a central point. The soft grayscale tones create a blurred, ethereal effect, giving it a dreamy and almost cosmic appearance. The design could be interpreted as an artistic representation of light diffusion, a scientific visualization, or an abstract digital creation. Grayscale visualization illustrations Abstract radiating light pattern in soft grayscale blur. This image displays an abstract, symmetrical pattern resembling radiating light or energy beams emanating from a central point. The soft grayscale tones create a blurred, ethereal effect, giving it a dreamy and almost cosmic appearance. The design could be interpreted as an artistic representation of light diffusion, a scientific visualization, or an abstract digital creation
Free with trial A sleek abstract grayscale composition featuring interconnected dots and lines forming a complex network or constellation-like pattern. This minimalist design conveys themes of connectivity, technology, data visualization, and communication. Ideal for use in tech presentations, scientific projects, digital backgrounds, and futuristic design concepts. Grayscale visualization illustrations Abstract Grayscale Image of Interconnected Dots and Lines Resembling Network or Constellation. A sleek abstract grayscale composition featuring interconnected dots and lines forming a complex network or constellation-like pattern. This minimalist design conveys themes of connectivity, technology, data visualization, and communication. Ideal for use in tech presentations, scientific projects, digital backgrounds, and futuristic design concepts.
Free with trial The image displays a vertical arrangement of numerous thin, rectangular bars varying in shades of gray, creating a dense and intricate pattern. The bars appear to represent some form of data or signal visualization, with alternating light and dark segments forming a symmetrical, wave-like structure. This abstract design might be used in fields such as digital signal processing, data analysis, or. Grayscale visualization illustrations Abstract visualization of layered data patterns in grayscale. The image displays a vertical arrangement of numerous thin, rectangular bars varying in shades of gray, creating a dense and intricate pattern. The bars appear to represent some form of data or signal visualization, with alternating light and dark segments forming a symmetrical, wave-like structure. This abstract design might be used in fields such as digital signal processing, data analysis, or
Free with trial A digital image depicting a curved stream of binary code (zeros and ones) in grayscale on a black background. The code appears as light streaks against the dark backdrop, creating a sense of depth and movement. Grayscale visualization illustrations Grayscale Binary Code Stream Visualization. A digital image depicting a curved stream of binary code (zeros and ones) in grayscale on a black background. The code appears as light streaks against the dark backdrop, creating a sense of depth and movement
Free with trial The image shows two vertical columns of abstract, grayscale patterns composed of varying shades of gray and white blocks. The patterns appear to represent data or information in a visual format, with dense clusters of darker shades on the left and more dispersed, lighter shades on the right. The arrangement suggests a comparison or contrast between two sets of data distributions. Grayscale visualization illustrations Abstract visualization of vertical data patterns in grayscale. The image shows two vertical columns of abstract, grayscale patterns composed of varying shades of gray and white blocks. The patterns appear to represent data or information in a visual format, with dense clusters of darker shades on the left and more dispersed, lighter shades on the right. The arrangement suggests a comparison or contrast between two sets of data distributions
Free with trial This image depicts a grayscale 3D depth map representing various urban architectural structures. The visualization appears pixelated, highlighting the relative distances and elevations of buildings and other cityscape elements. The varying shades of gray indicate different depths, creating a layered effect that emphasizes the spatial arrangement and complexity of an urban environment. Grayscale visualization illustrations A 3d depth map visualization of urban architectural structures. This image depicts a grayscale 3D depth map representing various urban architectural structures. The visualization appears pixelated, highlighting the relative distances and elevations of buildings and other cityscape elements. The varying shades of gray indicate different depths, creating a layered effect that emphasizes the spatial arrangement and complexity of an urban environment
Free with trial This image displays a heatmap visualization where data density is represented using a grayscale gradient, with darker areas indicating higher density. On the right side, two regions are highlighted in green, suggesting areas of interest or significance. The left side shows a gradient bar indicating the intensity scale from low to high density. Grayscale visualization illustrations Heatmap visualization of data density with highlighted regions. This image displays a heatmap visualization where data density is represented using a grayscale gradient, with darker areas indicating higher density. On the right side, two regions are highlighted in green, suggesting areas of interest or significance. The left side shows a gradient bar indicating the intensity scale from low to high density
Free with trial A grayscale abstract architectural visualization of a modern skyscraper, featuring a symmetrical design with a central tower and horizontal structural layers. The image is rendered in a minimalist, monochromatic style, highlighting geometric shapes and clean lines, with a mirrored effect created by the reflection on a flat surface beneath it. Grayscale visualization illustrations Abstract geometric architectural visualization of a modern skyscraper. A grayscale abstract architectural visualization of a modern skyscraper, featuring a symmetrical design with a central tower and horizontal structural layers. The image is rendered in a minimalist, monochromatic style, highlighting geometric shapes and clean lines, with a mirrored effect created by the reflection on a flat surface beneath it
Free with trial The image displays four variations of a tree illustration, transitioning from a grayscale outline to a fully colored tree with detailed green foliage and textured bark. Each stage adds more depth and color, showcasing a progression from a basic structure to a realistic depiction. Grayscale visualization illustrations Four stages of tree visualization from grayscale to full color foliage. The image displays four variations of a tree illustration, transitioning from a grayscale outline to a fully colored tree with detailed green foliage and textured bark. Each stage adds more depth and color, showcasing a progression from a basic structure to a realistic depiction
Free with trial The image displays a grayscale heatmap representing the non-zero elements of a sparse matrix, commonly used in computational mathematics and scientific computing. The matrix appears to have a concentration of values along the diagonal and specific off-diagonal regions, indicating structured sparsity patterns. This type of visualization is often employed to analyze data distribution, optimize. Grayscale visualization illustrations Visualization of sparse matrix data structure in computational science. The image displays a grayscale heatmap representing the non-zero elements of a sparse matrix, commonly used in computational mathematics and scientific computing. The matrix appears to have a concentration of values along the diagonal and specific off-diagonal regions, indicating structured sparsity patterns. This type of visualization is often employed to analyze data distribution, optimize
Free with trial A grayscale cityscape grid overlaid with vertical colored bands in shades of green, yellow, and orange, indicating varying data density or intensity levels across different sectors. The central vertical bands are the most prominent, suggesting higher data concentration, while peripheral areas fade into lighter shades, representing lower activity. The visualization uses a gradient color scale to. Grayscale visualization illustrations Heatmap visualization showing data distribution across a cityscape grid. A grayscale cityscape grid overlaid with vertical colored bands in shades of green, yellow, and orange, indicating varying data density or intensity levels across different sectors. The central vertical bands are the most prominent, suggesting higher data concentration, while peripheral areas fade into lighter shades, representing lower activity. The visualization uses a gradient color scale to
Free with trial The image depicts a three-dimensional bar chart or histogram rendered in varying shades of gray. The structure appears to represent intricate data distributions or frequency patterns, with numerous vertical bars of differing heights and densities. The visualization likely illustrates multidimensional data relationships, possibly for analytical or computational purposes. Grayscale visualization illustrations Three-dimensional visualization of complex data structures in grayscale. The image depicts a three-dimensional bar chart or histogram rendered in varying shades of gray. The structure appears to represent intricate data distributions or frequency patterns, with numerous vertical bars of differing heights and densities. The visualization likely illustrates multidimensional data relationships, possibly for analytical or computational purposes
Free with trial A grayscale architectural rendering of a multi-story building with multiple floors, balconies, and large windows. The structure has a contemporary design with clean lines and geometric shapes, featuring a central section that rises higher than the adjacent wings. The perspective is from an angle, showcasing the building's depth and symmetry. The image is in black and white, highlighting the. Grayscale visualization illustrations Modern architectural visualization of a multi-story building in grayscale. A grayscale architectural rendering of a multi-story building with multiple floors, balconies, and large windows. The structure has a contemporary design with clean lines and geometric shapes, featuring a central section that rises higher than the adjacent wings. The perspective is from an angle, showcasing the building's depth and symmetry. The image is in black and white, highlighting the