Free with trial Businessman falling from the red graph chart arrow, bankruptcy concept. vector illustration. Hand drawing decrease graph vectors Businessman falling from the red graph chart arrow, bankruptcy concept. vector illustration.
Free with trial Hand drawing businessman wear masks stress from decrease market during virus outbreak. businessman wear mask protection effect of corona virus. Covid-19. Vector illustration eps 10. Hand drawing decrease graph illustrations Hand drawing businessman wear masks stress from decrease market during virus outbreak
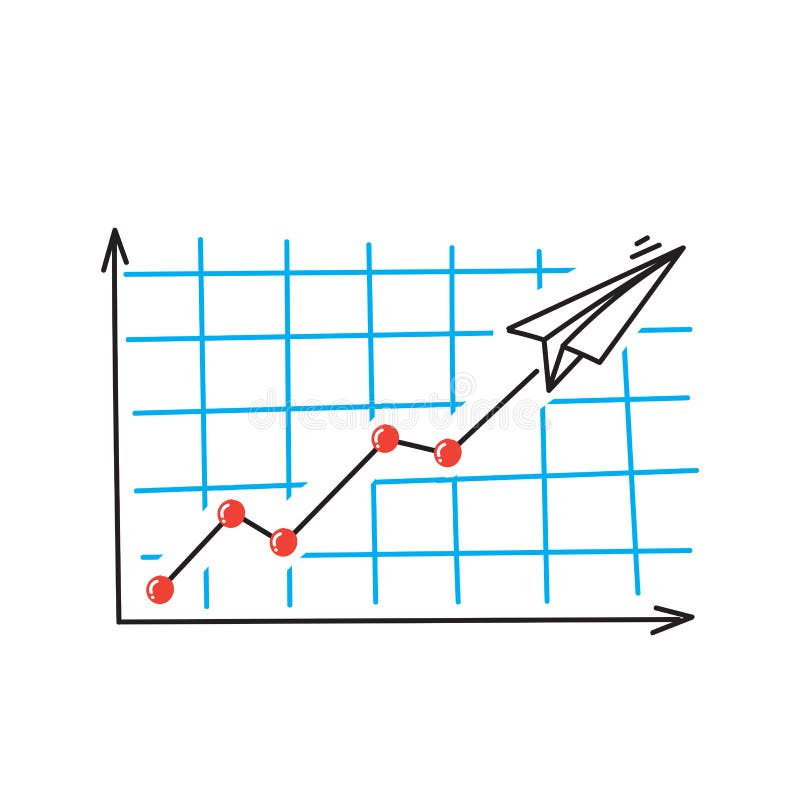
Free with trial Hand drawn doodle growth and drop graph like paper plane illustration vector icon. Hand drawing decrease graph vectors Hand drawn doodle growth and drop graph like paper plane illustration vector
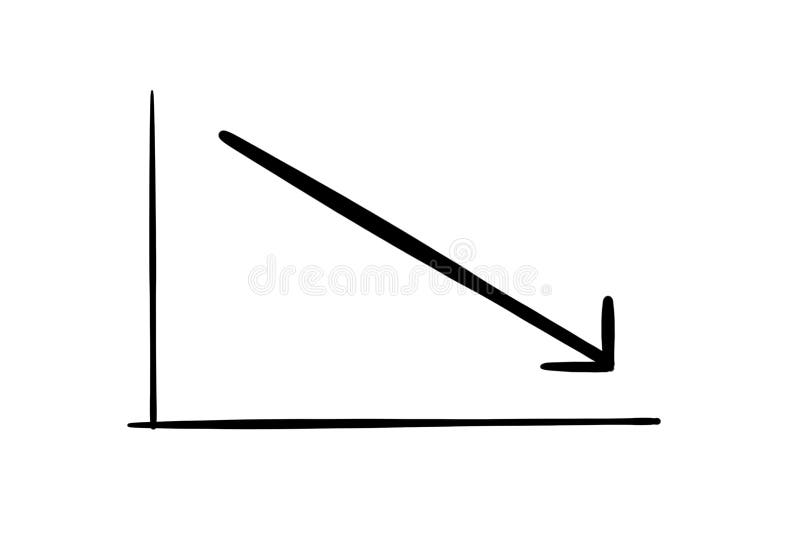
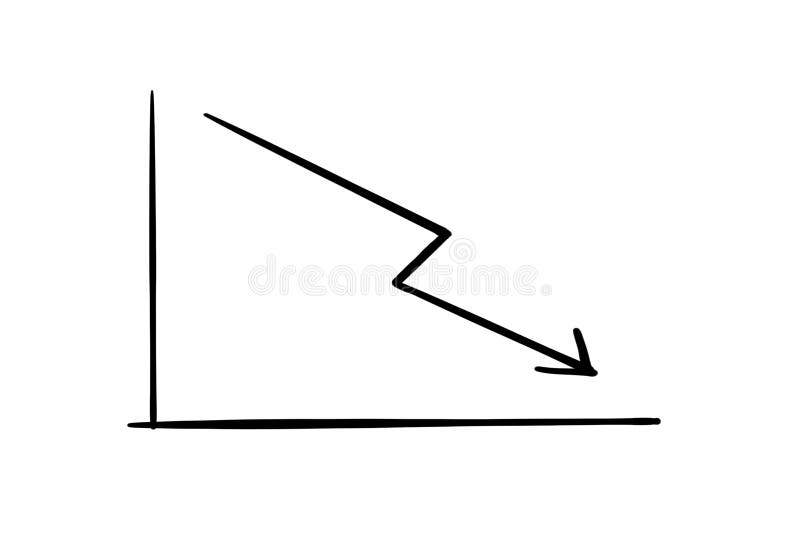
Free with trial Doodle Graph going down illustration. Hand drawing decrease graph illustrations Doodle Graph going down
Free with trial Doodle Graph going down illustration. Hand drawing decrease graph illustrations Doodle Graph going down
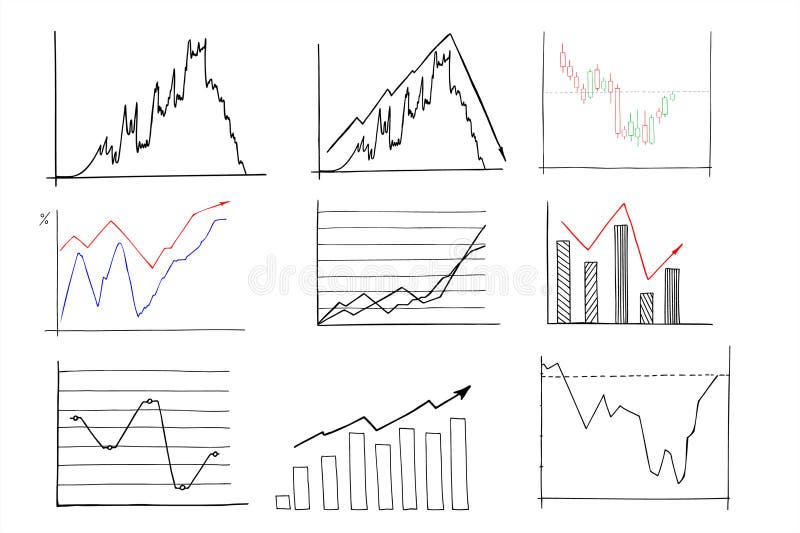
Free with trial A collection of hand-drawn, black and white icons representing growth, decline, and financial concepts. The set includes upward and downward arrows, percentage symbols, and a bar graph illustrating trends. The simple line art style makes these icons versatile for various applications, including presentations, infographics, and website design. They convey concepts of progress, success, loss, and market fluctuations. Hand drawing decrease graph illustrations Growth and Decline Icons Set. A collection of hand-drawn, black and white icons representing growth, decline, and financial concepts. The set includes upward and downward arrows, percentage symbols, and a bar graph illustrating trends. The simple line art style makes these icons versatile for various applications, including presentations, infographics, and website design. They convey concepts of progress, success, loss, and market fluctuations.
Free with trial Downward Trend Bar Chart with an Arrow in a Hand-Drawn Style. Hand drawing decrease graph vectors Downward Trend Bar Chart with an Arrow in a Hand-Drawn Style
Free with trial A whiteboard displays a hand-drawn graph depicting a sharp downward trend in a market or economic indicator. Red markers highlight significant drops, illustrating a period of substantial decline. The graph suggests a potential crisis or recession. Hand drawing decrease graph illustrations Declining Market Trend. A whiteboard displays a hand-drawn graph depicting a sharp downward trend in a market or economic indicator. Red markers highlight significant drops, illustrating a period of substantial decline. The graph suggests a potential crisis or recession.
Free with trial A hand draws a downward trending graph on a whiteboard, illustrating a market decline. This image, generated by AI, is perfect for illustrating concepts like economic downturn, market analysis, or financial forecasting. The simple yet effective visual communicates the message instantly. Hand drawing decrease graph illustrations AI-Generated Market Trend. A hand draws a downward trending graph on a whiteboard, illustrating a market decline. This image, generated by AI, is perfect for illustrating concepts like economic downturn, market analysis, or financial forecasting. The simple yet effective visual communicates the message instantly.
Free with trial This image showcases a collection of twenty distinct vector icons, each illustrating various representations of increase and decrease graphs. Hand drawing decrease graph vectors Collection of Twenty Vector Icons Depicting Increase and Decrease Graphs. This image showcases a collection of twenty distinct vector icons, each illustrating various representations of increase and decrease graphs.
Free with trial A hand-drawn style graph illustrates a concept with fluctuating bars and a descending arrow, indicating decline and progress, perfect for business presentations. Hand drawing decrease graph illustrations Hand-drawn sketch illustrates decline and progress with chart and arrow. A hand-drawn style graph illustrates a concept with fluctuating bars and a descending arrow, indicating decline and progress, perfect for business presentations
Free with trial A hand-drawn chart illustrates a market decline, demonstrating decreasing financial figures. The graph shows a clear downward trend, indicating potential losses or an economic downturn. Hand drawing decrease graph illustrations Hand drawn chart displaying market decline and decreasing financial figures. A hand-drawn chart illustrates a market decline, demonstrating decreasing financial figures. The graph shows a clear downward trend, indicating potential losses or an economic downturn
Free with trial Chart line set. Graph, finance report, income growth, economy statistic, diagram, infographic, mind map, data visualization vector illustration. Outline signs of analytic. Editable Stroke. Hand drawing decrease graph vectors Analytical graphic chart with trend lines, columns set hand drawn ink sketch. Change in time of election results or income, plans. Chart line set. Graph, finance report, income growth, economy statistic, diagram, infographic, mind map, data visualization vector illustration. Outline signs of analytic. Editable Stroke
Free with trial Unexpected financial loss doodle line illustration concept. Sales decrease. Market downturn. Crying businessman beside declining bar graph 2D outline character isolated. Hand drawn metaphor monochrome. Hand drawing decrease graph vectors Unexpected financial loss doodle line illustration concept
Free with trial Hand drawn 3d isometric illustration showing a blue Indian rupee currency coin next to a yellow decreasing bar chart and a downward pointing arrow on an alpha transparent background, depicting financial decline and economic recession. Hand drawing decrease graph vectors 3D isometric doodle of Indian rupee coin with negative growth bar chart alpha transparent. Hand drawn 3d isometric illustration showing a blue Indian rupee currency coin next to a yellow decreasing bar chart and a downward pointing arrow on an alpha transparent background, depicting financial decline and economic recession.
Free with trial An empty corporate conference room featuring a large wooden table, office chairs, and a whiteboard displaying a hand-drawn graph indicating a downward trend in performance. Hand drawing decrease graph illustrations Modern Office Conference Room Showing Financial Loss Chart. An empty corporate conference room featuring a large wooden table, office chairs, and a whiteboard displaying a hand-drawn graph indicating a downward trend in performance
Free with trial A vibrant, hand-drawn doodle illustration centered around a large percentage sign. This creative sketch features various financial and business icons, including bar graphs, pie charts, stacks of coins, dollar signs, and arrows indicating growth and decline. The colorful, cartoonish style makes it perfect for illustrating concepts like interest rates, economic trends, business analytics, and financial reports. Ideal for use in presentations, infographics, websites, and educational materials, this vector art is isolated on a white background for versatile application. Hand drawing decrease graph illustrations Finance and Economy Doodle Illustration. A vibrant, hand-drawn doodle illustration centered around a large percentage sign. This creative sketch features various financial and business icons, including bar graphs, pie charts, stacks of coins, dollar signs, and arrows indicating growth and decline. The colorful, cartoonish style makes it perfect for illustrating concepts like interest rates, economic trends, business analytics, and financial reports. Ideal for use in presentations, infographics, websites, and educational materials, this vector art is isolated on a white background for versatile application.
Free with trial Line art depicting a magnifying glass focused on a declining sales graph and a thumbs-down gesture. Hand drawing decrease graph illustrations Declining Sales Analysis Magnifying Glass, Downward Trend, Thumbs Down. Line art depicting a magnifying glass focused on a declining sales graph and a thumbs-down gesture.
Free with trial This whiteboard displays hand-drawn charts illustrating a sharp market decline. The red lines, representing a dramatic downturn, are prominently featured, alongside other less defined financial graphs. This image was generated by AI for illustrative purposes. Hand drawing decrease graph illustrations Red Ink Market Crash Whiteboard. This whiteboard displays hand-drawn charts illustrating a sharp market decline. The red lines, representing a dramatic downturn, are prominently featured, alongside other less defined financial graphs. This image was generated by AI for illustrative purposes.
Free with trial Illustration of a hand holding a magnifying glass over a financial chart showing business growth and success. The image represents data analysis, investment strategy, and market trends in a visually appealing way. Hand drawing decrease graph illustrations Business Growth Analysis Magnifying Glass on Financial Chart. Illustration of a hand holding a magnifying glass over a financial chart showing business growth and success. The image represents data analysis, investment strategy, and market trends in a visually appealing way.
Free with trial Hand drawn line art percentage arrow icon set featuring downward and upward trending arrows with percentage signs for financial data representation. Hand drawing decrease graph vectors Hand drawn line art percentage arrow icon set featuring downward and upward trending arrows with percentage signs for
Free with trial Hand Drawn Pink Bar Chart Illustration Showing Rise and Fall of Data Trends with Arrows Symbolizing Up and Down Fluctuations. Hand drawing decrease graph vectors Hand Drawn Pink Bar Chart Illustration Showing Rise and Fall of Data Trends with Arrows Symbolizing Up and Down Fluctuations
Free with trial Unexpected financial loss doodle illustration concept. Sales decrease. Market downturn. Crying businessman beside declining bar graph cartoon 2D character isolated on white. Hand drawn vector metaphor. Hand drawing decrease graph vectors Unexpected financial loss doodle illustration concept
Free with trial Hand drawn arrow design, pointing down, business and graphic concept. Hand drawing decrease graph vectors Hand drawn arrow design, pointing down, business and graphic concept
Free with trial Hand drawn bar chart illustration showing downward trend with arrow. Hand drawing decrease graph vectors Hand drawn bar chart illustration showing downward trend with arrow
Free with trial Hand Drawn Graphic Showing Decline Bar Chart with Arrow Pointing Downward. Hand drawing decrease graph vectors Hand Drawn Graphic Showing Decline Bar Chart with Arrow Pointing Downward
Free with trial Hand drawn bar chart illustration showing data statistics and business growth. Hand drawing decrease graph vectors Hand drawn bar chart illustration showing data statistics and business growth
Free with trial Hand drawn bar chart with declining arrow showing economic recession and financial loss. Hand drawing decrease graph vectors Hand drawn bar chart with declining arrow showing economic recession and financial loss
Free with trial Hand-drawn line chart doodle is showing grid backdrop and axis over gradient background, copy space. Data visualization, infographics, analytics, diagram, business, educational, minimalistic. Hand drawing decrease graph illustrations Hand-drawn line chart doodle is showing grid backdrop and axis over gradient background, copy space
Free with trial Hand drawn bar chart with a downward red arrow and sale tag illustrating a business recession or price drop. Hand drawing decrease graph vectors Hand drawn bar chart with a downward red arrow and sale tag illustrating a business recession or price drop
Free with trial Hand drawn style illustration of a falling down chart on a calendar with a blue arrow, representing economic decline. Hand drawing decrease graph vectors Hand drawn style illustration of a falling down chart on a calendar with a blue arrow, representing economic decline
Free with trial A sad bald man. Red chart symbols pointing down. Fear of business. Comic cartoon pop art retro illustration hand drawing. On a white background. Hand drawing decrease graph illustrations A sad bald man. Red chart symbols pointing down. Fear of business.
Free with trial A sad bald man. Red chart symbols pointing down. Fear of business. Comic cartoon pop art retro vector illustration hand drawing. Hand drawing decrease graph vectors A sad bald man. Red chart symbols pointing down. Fear of business.
Free with trial A tiny figure stands on the second hand of a clock as a pencil draws a downward arrow, symbolizing the pressure of deadlines and business downturns. Hand drawing decrease graph illustrations Business Deadline and Time Pressure Concept. A tiny figure stands on the second hand of a clock as a pencil draws a downward arrow, symbolizing the pressure of deadlines and business downturns
Free with trial Set of sketched icons showing mutual fund nav increases and decreases with indian rupee signs on an alpha transparent base. Hand drawing decrease graph vectors Mutual fund nav trend sketch icons with rupee symbol alpha transparent. Set of sketched icons showing mutual fund nav increases and decreases with indian rupee. Set of sketched icons showing mutual fund nav increases and decreases with indian rupee signs on an alpha transparent base.
Free with trial A hand-drawn illustration featuring a large percentage symbol at the center, surrounded by various financial and business-related doodles. Icons include bar charts, pie charts, stacks of coins, a calculator, dollar signs, and numerous arrows indicating direction, flow, or change. The style is simple, black and white line art, suitable for representing concepts like finance, economics, growth, discounts, and business analysis. Hand drawing decrease graph illustrations Doodle Financial Icons and Percentage Symbol. A hand-drawn illustration featuring a large percentage symbol at the center, surrounded by various financial and business-related doodles. Icons include bar charts, pie charts, stacks of coins, a calculator, dollar signs, and numerous arrows indicating direction, flow, or change. The style is simple, black and white line art, suitable for representing concepts like finance, economics, growth, discounts, and business analysis.
Free with trial Illustration featuring financial turmoil with dramatic downward arrows and distressed figures. Symbols like dollar ($), euro (�), and pound (�) are scattered, along with words like "SELL! ", "PANIC", "CRASH! ", and "BEAR MARKET". A piggy bank breaking symbolizes losses. Bar charts and various percentages emphasize financial decline. The style is cartoonish, using black and white sketches to depict the chaotic atmosphere often associated with stock market crashes or economic downturns. Elements convey urgency and distress in an economic context. Hand drawing decrease graph vectors Stock Market Crash and Global Financial Crisis Hand Drawn Doodle Concept. Illustration featuring financial turmoil with dramatic downward arrows and distressed figures. Symbols like dollar ($), euro (�), and pound (�) are scattered, along with words like "SELL!", "PANIC", "CRASH!", and "BEAR MARKET". A piggy bank breaking symbolizes losses. Bar charts and various percentages emphasize financial decline. The style is cartoonish, using black and white sketches to depict the chaotic atmosphere often associated with stock market crashes or economic downturns. Elements convey urgency and distress in an economic context.
Free with trial Businessman has been crushed by a huge coin with the Dollar symbol. Hand drawing decrease graph vectors Businessman has been crushed by a huge coin with the Dollar symbol
Free with trial Silhouette icon featuring a downward zigzag arrow symbolizing decline or loss. Above the arrow is a human figure with raised arms, possibly indicating surprise or concern. The design uses simple black shapes on a white background, typical for conveying concepts like financial decrease or graph trends in business contexts. Hand drawing decrease graph vectors Silhouette icon featuring a downward zigzag arrow symbolizing decline or loss.
Free with trial Downward zigzag arrow line icon vector on black circle. Hand drawing decrease graph vectors Downward zigzag arrow line icon on black circle
Free with trial Zigzag down arrow line icon. Market crash sign symbol vector. Hand drawing decrease graph vectors Zigzag down arrow line icon. Market crash sign symbol
Free with trial Chart icons for data analysis vector art design, Minimalist business charts icons bar graphs, line graphs, and pie charts vector illustration on white background the image is generated using AI. Hand drawing decrease graph vectors Chart icons for data analysis vector art design, Minimalist business charts icons bar graphs, line graphs, and pie charts vector
Free with trial Businessmans hand drawing decrease graph. Profit decline and downward sales business vector concept. Business graph and chart, finance decrease diagram, financial bankruptcy illustration. Hand drawing decrease graph vectors Businessmans hand drawing decrease graph. Profit decline and downward sales business vector concept
Free with trial Benefits and Costs Graph on blackboard. Benefit Increase and Cost decrease. drawing In chalk beard illustrated by businessman Hand. Hand drawing decrease graph illustrations Benefits and Costs Graph on blackboard. Benefit Increase and Cost decrease. drawing In chalk beard illustrated by businessman Hand
Free with trial Covid-19 and tourism graph on blackboard. Tourists decrease during pandemic flu concept. Hand drawing in Chalkboard. Hand drawing decrease graph illustrations Covid-19 and tourism graph on blackboard. Tourists decrease during pandemic flu concept. Hand drawing in Chalkboard
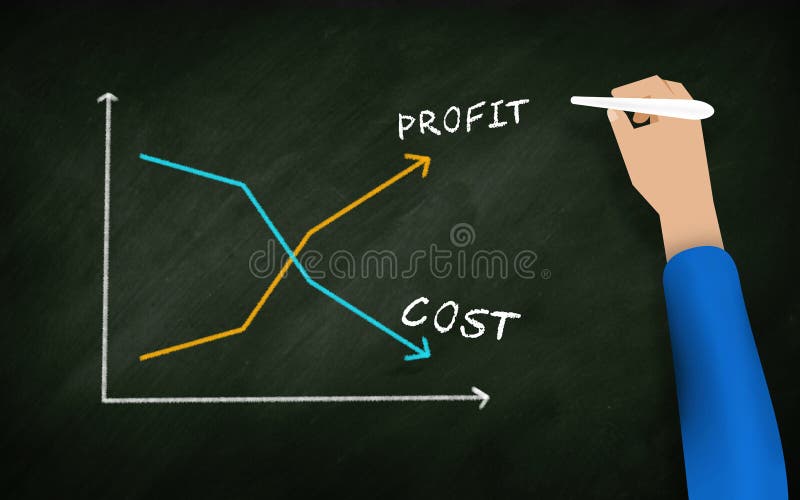
Free with trial Profit and Cost Graph on blackboard. Revenue and Costs. Profits Increase and Cost decrease. drawing In chalk board by businessman Hand. Hand drawing decrease graph illustrations Profit and Cost Graph on blackboard. Revenue and Costs. Profits Increase and Cost decrease. drawing In chalk board by businessman
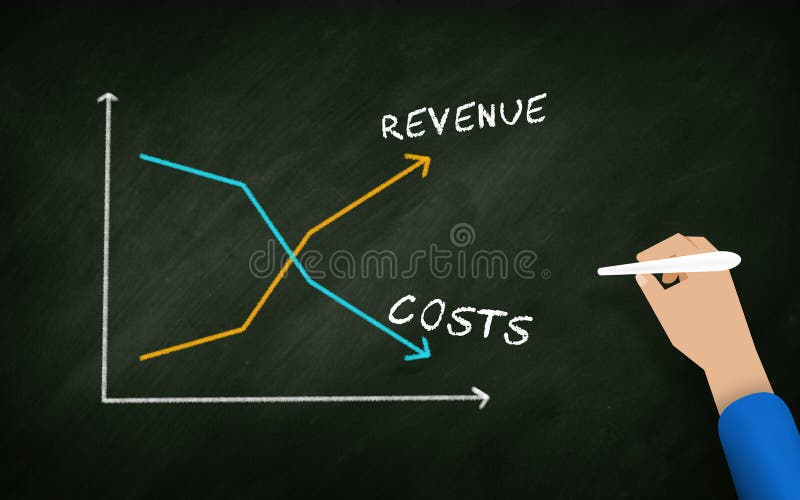
Free with trial Revenue Costs Graph on blackboard. Revenue Increase and Cost decrease. drawing In chalk board by businessman Hand. Hand drawing decrease graph illustrations Revenue Costs Graph on blackboard. Revenue Increase and Cost decrease. drawing In chalk board by businessman Hand
Free with trial Thin line black hand draws decrease linear graph. concept of future management or price and cost downgrade. flat lineart trend modern graphic stroke art design element isolated on white background. Hand drawing decrease graph vectors Thin line black hand draws decrease linear graph
Free with trial Businessman hand drawing graph cost reduction vector illustration, eps10. Hand drawing decrease graph vectors Businessman hand drawing graph cost reduction vector illustration
Free with trial Document arrow graph down color vector icon. Drawing sketch illustration hand drawn line eps10. Hand drawing decrease graph vectors Document arrow graph down color vector icon. Drawing sketch illustration hand drawn line eps10
Free with trial Document arrow graph down color vector icon. Drawing sketch illustration hand drawn line eps10. Hand drawing decrease graph vectors Document arrow graph down color vector icon. Drawing sketch illustration hand drawn line eps10
Free with trial Document arrow graph down vector icon. Drawing sketch illustration hand drawn line eps10. Hand drawing decrease graph vectors Document arrow graph down vector icon. Drawing sketch illustration hand drawn line eps10
Free with trial Document arrow graph down vector icon. Drawing sketch illustration hand drawn line eps10. Hand drawing decrease graph vectors Document arrow graph down vector icon. Drawing sketch illustration hand drawn line eps10
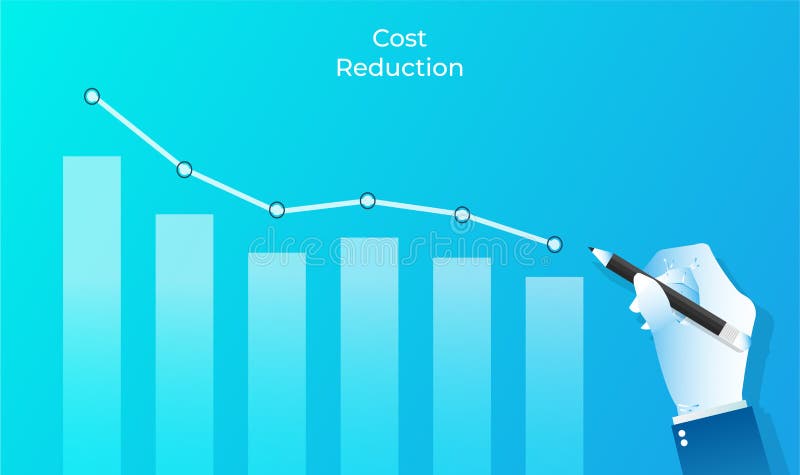
Free with trial Cost reduction design concept. Businessman drawing graph of bar chart with pencil vector illustration. Reduction or decrease extra cost and efficiencies. Hand drawing decrease graph vectors Cost reduction design concept. Businessman drawing graph of bar chart with pencil vector illustration. Reduction or decrease extra
Free with trial Hand drawing a graph about real estate market trends - concept image. Hand drawing decrease graph illustrations Hand drawing a graph about real estate market trends - concept image
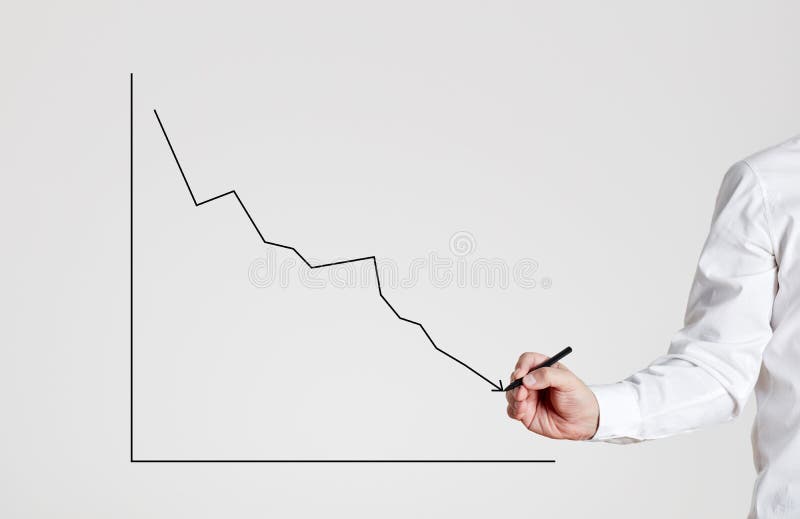
Free with trial Businessman hand draws a declining line graph on gray background with copy space. Hand drawing decrease graph illustrations Businessman hand draws a declining line graph
Free with trial White color hand drawing chalk in arrow down shape on black board background Concept of stock decline, down trend of business, economy. Hand drawing decrease graph illustrations White color hand drawing chalk in arrow down shape
Free with trial Hand drawn doodle growth and drop graph like paper plane illustration vector icon. Hand drawing decrease graph vectors Hand drawn doodle growth and drop graph like paper plane illustration vector
Free with trial Hand drawn doodle growth and drop graph like paper plane illustration vector sketch. Hand drawing decrease graph vectors Hand drawn doodle growth and drop graph like paper plane illustration vector
Free with trial White chalk hand drawing in arrow down shape on black board background Concept of stock decline, down trend of business, economy. Hand drawing decrease graph illustrations White chalk hand drawing in arrow down shape on black board background
Free with trial White color chalk hand drawing in arrow down shape on black board background Concept of stock decline, down trend of business, economy. Hand drawing decrease graph illustrations White chalk hand drawing in arrow down shape on black board background Concept of stock decline, down trend of business, economy
Free with trial Vector cartoon stick figure drawing conceptual illustration of unhappy man or businessman holding falling financial chart or graph. Hand drawing decrease graph vectors Vector Cartoon Illustration of Unhappy Man or Businessman Holding Falling Financial Graph or Chart. Vector cartoon stick figure drawing conceptual illustration of unhappy man or businessman holding falling financial chart or graph.
Free with trial Vector cartoon stick figure drawing conceptual illustration of happy smiling man or businessman holding falling financial chart or graph. Hand drawing decrease graph vectors Vector Cartoon Illustration of Smiling Happy Man or Businessman Holding Falling Financial Graph or Chart. Vector cartoon stick figure drawing conceptual illustration of happy smiling man or businessman holding falling financial chart or graph.
Free with trial Vector sketchy cartoon drawing conceptual illustration of graph arrow representing global economic growth falling down. Financial decline, crisis, recession or depression. Hand drawing decrease graph vectors Vector Sketchy Cartoon Illustration of Graph Arrow of Global Economic Growth Falling Down. Financial Decline. Vector sketchy cartoon drawing conceptual illustration of graph arrow representing global economic growth falling down. Financial decline, crisis, recession or depression.
Free with trial Illustration of red pen in hand drawing a declining negative growth on the white background. Hand drawing decrease graph vectors Hand wirh red pen drawing a negative growth. Illustration of red pen in hand drawing a declining negative growth on the white background.
Free with trial Vector cartoon stick figure drawing conceptual illustration of man or businessman falling down along the graph arrow. Business metaphor of crisis. Hand drawing decrease graph vectors Vector Cartoon of Man or Businessman Falling Down Along the Graph Arrow. Vector cartoon stick figure drawing conceptual illustration of man or businessman falling down along the graph arrow. Business metaphor of crisis.
Free with trial Vector cartoon stick figure drawing conceptual illustration of man, businessman or stock investor walking and falling on the financial graph. Market cycle concept. Hand drawing decrease graph vectors Vector Cartoon Illustration of Man or Businessman or Stock Investor Walking and Falling on Financial Graph. Market Cycle. Vector cartoon stick figure drawing conceptual illustration of man, businessman or stock investor walking and falling on the financial graph. Market cycle concept.
Free with trial Vector cartoon stick figure drawing conceptual illustration of man, businessman or stock investor walking and falling on the financial graph. Market cycle concept. Hand drawing decrease graph vectors Vector Cartoon Illustration of Man or Businessman or Stock Investor Walking and Falling on Financial Graph. Market Cycle. Vector cartoon stick figure drawing conceptual illustration of man, businessman or stock investor walking and falling on the financial graph. Market cycle concept.
Free with trial Vector cartoon stick figure drawing conceptual illustration of two men or businessmen running away in panic from the falling financial graph arrow. Crisis or recession concept. Hand drawing decrease graph vectors Vector Cartoon Illustration of Two Men or Businessmen Running Away in Panic From the Falling Financial Graph Arrow. Vector cartoon stick figure drawing conceptual illustration of two men or businessmen running away in panic from the falling financial graph arrow. Crisis or recession concept.
Free with trial Hand drawn doodle falling down graph chart illustration vector isolated sketch. Hand drawing decrease graph vectors Hand drawn doodle falling down graph chart illustration vector isolated
Free with trial Hand drawn doodle falling down graph chart illustration vector isolated sketch. Hand drawing decrease graph vectors Hand drawn doodle falling down graph chart illustration vector isolated
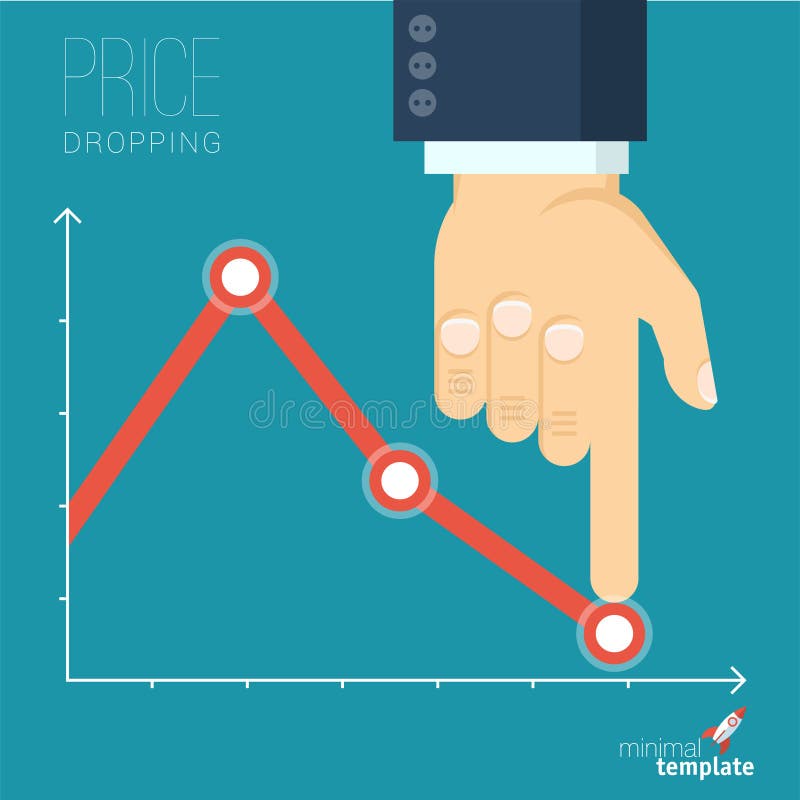
Free with trial Flat design vector illustration of businessman creating decreasing business graph. Vector abstract price drop and sale countdown. Hand drawing decrease graph vectors Decreasing business graph
Free with trial Decline graph vector line icon isolated on white background. Zigzag line going down line icon for infographic, website or app. Hand drawing decrease graph vectors Decline graph vector line icon. Decline graph vector line icon isolated on white background. Zigzag line going down line icon for infographic, website or app.
Free with trial Close up abstract view low curve go point simple account infochart draft project result set. Linear black pen hand drawn decrease info column logo. Outline art doodle note cartoon white paper style. Hand drawing decrease graph vectors Schematic graph. Vector drawing diagram. Close up abstract view low curve go point simple account infochart draft project result set. Linear black pen hand drawn decrease info column logo. Outline art doodle note cartoon white paper style
Free with trial Close up abstract view low curve go point simple account infochart draft project result set. Linear black pen hand drawn decrease info column logo. Outline art doodle note cartoon white paper style. Hand drawing decrease graph vectors Schematic graph. Vector drawing diagram. Close up abstract view low curve go point simple account infochart draft project result set. Linear black pen hand drawn decrease info column logo. Outline art doodle note cartoon white paper style
Free with trial Experiences and Money Graph Showing Money buy Experience. Hand drawing decrease graph illustrations Experiences and Money Graph Showing Money buy Experience
Free with trial Vector hand-drawn illustration of dollar symbol with arrow moving down. Black outlines and white background. Hand drawing decrease graph vectors Vector hand-drawn illustration of dollar with arrow moving down. Vector hand-drawn illustration of dollar symbol with arrow moving down. Black outlines and white background
Free with trial Business graphics set hand drawn in doodle style. arrows, graphs. Hand drawing decrease graph illustrations Business graphics set hand drawn in doodle style. arrows
Free with trial Business graphics set hand drawn in doodle style. arrows, graphs. Hand drawing decrease graph vectors Business graphics set hand drawn in doodle style. arrows
Free with trial Vector hand-drawn illustration of dollar symbol with arrow moving down. Colored outlines and colored. Hand drawing decrease graph vectors Vector hand-drawn illustration of dollar symbol with arrow moving down