Free with trial A vector icon of a descending line graph on a green base, illustrating a downward trend, decrease, or decline in data. Represents financial loss, reduced performance, or negative growth. Suitable for business reports, statistical analysis, and economic presentations, vector design Generative AI. Icon illustrating decrease vectors Descending Line Graph Decline Trend Chart Icon, vector design Generative AI. A vector icon of a descending line graph on a green base, illustrating a downward trend, decrease, or decline in data. Represents financial loss, reduced performance, or negative growth. Suitable for business reports, statistical analysis, and economic presentations, vector design Generative AI
Free with trial A minimalist black vector icon illustrating a significant decline or negative trend. The image features three bar chart elements, progressively decreasing in height from left to right, symbolizing a fall in data or performance. A prominent, thick downward-pointing arrow diagonally overlays the bars, reinforcing the concept of reduction, loss, or economic downturn. Isolated on a clean white background, this graphic is ideal for financial reports, business presentations, economic analysis, or any visual communication requiring a clear representation of falling statistics or poor results. Icon illustrating decrease vectors Business Decline Bar Chart with Down Arrow Icon. A minimalist black vector icon illustrating a significant decline or negative trend. The image features three bar chart elements, progressively decreasing in height from left to right, symbolizing a fall in data or performance. A prominent, thick downward-pointing arrow diagonally overlays the bars, reinforcing the concept of reduction, loss, or economic downturn. Isolated on a clean white background, this graphic is ideal for financial reports, business presentations, economic analysis, or any visual communication requiring a clear representation of falling statistics or poor results.
Free with trial A glossy glowing yellow light bulb paired with a bold blue downward-pointing arrow creates a striking 3D rendered icon set against a soft mint green background, blending the concept of ideas with a sense of reduction, downloading, or declining energy. This versatile image works effectively for business presentations, infographics, technology UI design, and content illustrating cost reduction,. Icon illustrating decrease illustrations Glowing yellow light bulb with blue downward arrow 3D icon on mint background idea decline concept. A glossy glowing yellow light bulb paired with a bold blue downward-pointing arrow creates a striking 3D rendered icon set against a soft mint green background, blending the concept of ideas with a sense of reduction, downloading, or declining energy. This versatile image works effectively for business presentations, infographics, technology UI design, and content illustrating cost reduction,
Free with trial A vector graphic of a line graph showing a downward trend. Represents decrease, decline, loss, or negative performance. In automotive context, could symbolize falling sales, decreasing fuel efficiency, or a system performance drop. A clear visual for illustrating negative trends, vector design Generative AI. Icon illustrating decrease vectors Downtrend graph icon, decrease decline loss symbol, vector design Generative AI. A vector graphic of a line graph showing a downward trend. Represents decrease, decline, loss, or negative performance. In automotive context, could symbolize falling sales, decreasing fuel efficiency, or a system performance drop. A clear visual for illustrating negative trends, vector design Generative AI
Free with trial A flat vector icon of a line graph showing a downward trend. Represents financial loss, market decline, negative statistics, or decreasing performance. Suitable for business reports, financial news, or graphics illustrating economic downturns, vector design Generative AI. Icon illustrating decrease vectors Downward trending line graph icon financial market decrease, vector design Generative AI. A flat vector icon of a line graph showing a downward trend. Represents financial loss, market decline, negative statistics, or decreasing performance. Suitable for business reports, financial news, or graphics illustrating economic downturns, vector design Generative AI
Free with trial A flat vector icon showing a line graph with a distinct downward trend. Represents decline, decrease, negative growth, or falling performance. Suitable for business analysis, financial reports, or graphics illustrating negative progress or statistics, vector design Generative AI. Icon illustrating decrease vectors Downward line graph icon representing negative trend decline, vector design Generative AI. A flat vector icon showing a line graph with a distinct downward trend. Represents decline, decrease, negative growth, or falling performance. Suitable for business analysis, financial reports, or graphics illustrating negative progress or statistics, vector design Generative AI
Free with trial Outline vector icon of a line graph showing a downward trend. Represents decline, loss, decrease, failure, or negative performance in line art. Suitable for financial reports, data analysis, business presentations, and illustrating negative change, vector design Generative AI. Icon illustrating decrease vectors Downward Trend Graph Icon Outline, Decline Loss Failure Symbol, vector design Generative AI. Outline vector icon of a line graph showing a downward trend. Represents decline, loss, decrease, failure, or negative performance in line art. Suitable for financial reports, data analysis, business presentations, and illustrating negative change, vector design Generative AI
Free with trial A minimalist icon illustrating the concept of a housing market downturn. Icon illustrating decrease vectors Property Value Decrease Graphic Icon. A minimalist icon illustrating the concept of a housing market downturn
Free with trial Black bar graph and downward arrow icon illustrating a financial decline or negative trend. Icon illustrating decrease illustrations Black Bar Graph and Downward Arrow Icon Showing Decline fall decrease. Black bar graph and downward arrow icon illustrating a financial decline or negative trend
Free with trial A vector icon of a line graph showing a downward trend with a red arrow. Represents decline, loss, negative performance, or decreasing statistics. Useful for financial reports, business analytics, or illustrating unfavorable trends. Clear visual for decrease, vector design Generative AI. Icon illustrating decrease vectors Downward Trend Line Graph Vector Icon for Decline Loss, vector design Generative AI. A vector icon of a line graph showing a downward trend with a red arrow. Represents decline, loss, negative performance, or decreasing statistics. Useful for financial reports, business analytics, or illustrating unfavorable trends. Clear visual for decrease, vector design Generative AI
Free with trial A vector icon illustrating a downward trending line graph, symbolizing a decline, decrease, or negative performance. Ideal for financial reports, data analysis dashboards, or warning indicators. This clear and concise graphic is scalable, perfect for conveying trend information in various digital interfaces, vector design Generative AI. Icon illustrating decrease vectors Declining Trend Graph Icon - Downturn Analysis Symbol, vector design Generative AI. A vector icon illustrating a downward trending line graph, symbolizing a decline, decrease, or negative performance. Ideal for financial reports, data analysis dashboards, or warning indicators. This clear and concise graphic is scalable, perfect for conveying trend information in various digital interfaces, vector design Generative AI
Free with trial Monochrome Graphic Illustrating a Financial Decline or Discount. Icon illustrating decrease vectors Percentage Rate Decrease Symbolized by a Downward Arrow Icon. Monochrome Graphic Illustrating a Financial Decline or Discount.
Free with trial Digital Transformation in Real Estate Market with Laptop and House Icon Illustrating Decrease in Property Value Represented by Percent Symbol Sigmoid. Icon illustrating decrease illustrations A modern workspace with a laptop and digital house icon, showcasing the decline in property value with a percent symbol. Digital Transformation in Real Estate Market with Laptop and House Icon Illustrating Decrease in Property Value Represented by Percent Symbol Sigmoid
Free with trial Black icon illustrating a downward sloping graph with an arrow indicating decline on a white background. Icon illustrating decrease illustrations Black icon showing a downward sloping graph with an arrow chart decline. Black icon illustrating a downward sloping graph with an arrow indicating decline on a white background
Free with trial This vector illustration features a set of two minimalist graphs depicting a significant decline. Each graph includes a downward-sloping line chart with an accompanying filled area, clearly indicating a negative trend. One version is presented in black on a white background, while the other is white on a black background, offering versatile usage. This icon is ideal for illustrating concepts of business loss, economic recession, market downturns, financial crisis, poor performance, or any data showing a decrease. Perfect for presentations, reports, infographics, and web design. Icon illustrating decrease vectors Declining Business Graph Icon Set - Negative Trend Chart. This vector illustration features a set of two minimalist graphs depicting a significant decline. Each graph includes a downward-sloping line chart with an accompanying filled area, clearly indicating a negative trend. One version is presented in black on a white background, while the other is white on a black background, offering versatile usage. This icon is ideal for illustrating concepts of business loss, economic recession, market downturns, financial crisis, poor performance, or any data showing a decrease. Perfect for presentations, reports, infographics, and web design.
Free with trial A 3D bar graph illustrating a downward trend with a green arrow, featuring a heart icon with a minus sign, on a white background. Icon illustrating decrease illustrations 3D bar graph with a downward trending green arrow and a heart icon with a minus sign chart. A 3D bar graph illustrating a downward trend with a green arrow, featuring a heart icon with a minus sign, on a white background
Free with trial Black and white icon showing particles falling down a slope with arrows indicating decline. Icon illustrating decrease illustrations Black and white icon illustrating deleveraging with falling particles and arrows debt reduction. Black and white icon showing particles falling down a slope with arrows indicating decline
Free with trial A vector graphic of a line graph showing a downward trend with an arrow. Represents decline, loss, decrease, negative progress, or recession. Useful graphic for financial reports, statistics, or negative outcomes. Illustrating a drop in value, vector design Generative AI. Icon illustrating decrease vectors Downward Trend Arrow Vector Graphic, Decline and Loss Icon, vector design Generative AI. A vector graphic of a line graph showing a downward trend with an arrow. Represents decline, loss, decrease, negative progress, or recession. Useful graphic for financial reports, statistics, or negative outcomes. Illustrating a drop in value, vector design Generative AI
Free with trial A minimalist black icon depicting an arrow that features a distinct wavy, oscillating curve before straightening and pointing downwards. This graphic symbolizes a fluctuating decline, an unstable downward trend, or a challenging path with variations. Ideal for illustrating concepts such as market volatility, data fluctuations, difficult progress, or any process involving an unstable decrease. Isolated on a white background for versatile use in web, print, and presentations. Generated by AI. Icon illustrating decrease vectors Black Wavy Down Arrow Icon. A minimalist black icon depicting an arrow that features a distinct wavy, oscillating curve before straightening and pointing downwards. This graphic symbolizes a fluctuating decline, an unstable downward trend, or a challenging path with variations. Ideal for illustrating concepts such as market volatility, data fluctuations, difficult progress, or any process involving an unstable decrease. Isolated on a white background for versatile use in web, print, and presentations. Generated by AI
Free with trial A minimalist vector icon illustrating a downward trend within a house. Icon illustrating decrease vectors House Price Decline Vector Icon. A minimalist vector icon illustrating a downward trend within a house
Free with trial A minimalist black line graph icon on a clean white background, clearly illustrating a downward trend. The zigzagging line culminates in a sharp arrow pointing downwards, symbolizing decline, decrease, or negative performance. This versatile vector illustration is ideal for representing financial losses, economic downturns, sales drops, market crashes, or any data indicating a negative trajectory. Perfect for business reports, presentations, websites, apps, and infographics requiring a clear visual indicator of reduction or poor results. Icon illustrating decrease vectors Downward Trend Graph with Arrow Icon. A minimalist black line graph icon on a clean white background, clearly illustrating a downward trend. The zigzagging line culminates in a sharp arrow pointing downwards, symbolizing decline, decrease, or negative performance. This versatile vector illustration is ideal for representing financial losses, economic downturns, sales drops, market crashes, or any data indicating a negative trajectory. Perfect for business reports, presentations, websites, apps, and infographics requiring a clear visual indicator of reduction or poor results.
Free with trial A minimalist line icon illustrating the concept of reducing salt intake for a healthier lifestyle. Icon illustrating decrease vectors Low Sodium Diet and Healthy Eating Vector Icon. A minimalist line icon illustrating the concept of reducing salt intake for a healthier lifestyle
Free with trial A clear and modern icon illustrating the action of removing an item from an online shopping cart. Icon illustrating decrease vectors Ecommerce Icon for Removing an Item from a Cart. A clear and modern icon illustrating the action of removing an item from an online shopping cart
Free with trial Man pictogram morphing into a downward arrow on white background, illustrating decline, decrease, falling trend or negative direction for finance, economy, data, business and social metrics. Icon illustrating decrease illustrations Man icon showing data decrease or downward direction. Man pictogram morphing into a downward arrow on white background, illustrating decline, decrease, falling trend or negative direction for finance, economy, data, business and social metrics
Free with trial A 3D icon illustrating financial loss isolated on a white background, ideal for financial and business themes. Icon illustrating decrease illustrations 3D Financial Loss Icon isolated. A 3D icon illustrating financial loss isolated on a white background, ideal for financial and business themes
Free with trial Bright vector icon illustrating financial decline with a downward arrow and decreasing bar chart representing loss. Icon illustrating decrease illustrations Downward arrow icon showing financial loss with bar chart. Bright vector icon illustrating financial decline with a downward arrow and decreasing bar chart representing loss
Free with trial Outline vector icon of a line graph showing a downward trend in line art. Represents decrease, loss, decline, or negative performance data. Suitable for financial charts, reports, data visualization, and illustrating negative changes over time, vector design Generative AI. Icon illustrating decrease vectors Line Graph Downward Trend Outline, Decline Loss Chart Symbol, vector design Generative AI. Outline vector icon of a line graph showing a downward trend in line art. Represents decrease, loss, decline, or negative performance data. Suitable for financial charts, reports, data visualization, and illustrating negative changes over time, vector design Generative AI
Free with trial A bold, clean red zigzag arrow pointing downward, representing decline, decrease, drop, or negative trend. Perfect for business, finance, or data visualization projects. Icon illustrating decrease illustrations Red downward zigzag arrow icon illustrating decline or decrease. A bold, clean red zigzag arrow pointing downward, representing decline, decrease, drop, or. A bold, clean red zigzag arrow pointing downward, representing decline, decrease, drop, or negative trend. Perfect for business, finance, or data visualization projects
Free with trial A grey downward curving arrow path icon, symbolizing decline, decrease, or a negative trend. Useful for financial charts, statistical graphs, and illustrating downward movements in data, vector design Generative AI. Icon illustrating decrease vectors Downward Curving Arrow Path for Decline, vector design Generative AI. A grey downward curving arrow path icon, symbolizing decline, decrease, or a negative trend. Useful for financial charts, statistical graphs, and illustrating downward movements in data, vector design Generative AI
Free with trial The image depicts a downward red arrow intersecting with a green house icon and a euro symbol, symbolizing a decrease in housing prices or mortgage rates in the European economic context. The percentage sign emphasizes the financial aspect of the decline, suggesting economic trends or market downturns affecting real estate costs. Icon illustrating decrease illustrations Graphic illustrating a decline in housing prices and interest rates in euros. The image depicts a downward red arrow intersecting with a green house icon and a euro symbol, symbolizing a decrease in housing prices or mortgage rates in the European economic context. The percentage sign emphasizes the financial aspect of the decline, suggesting economic trends or market downturns affecting real estate costs
Free with trial A black icon illustrating a falling stock market graph with a prominent downward arrow. Icon illustrating decrease illustrations Black icon of a falling stock market graph with a downward arrow on a white background. A black icon illustrating a falling stock market graph with a prominent downward arrow
Free with trial A black bar graph icon illustrating a downward trend with a down arrow on a white background. Icon illustrating decrease illustrations Black bar graph icon showing a downward trend with an arrow on white background chart. A black bar graph icon illustrating a downward trend with a down arrow on a white background
Free with trial A comprehensive data analysis icon set, ideal for illustrating data processing, teamwork dynamics, chart analysis, and various analytical tools, all on a white backdrop. Icon illustrating decrease vectors Vector art of data analysis icon set, featuring data processing, teamwork, charts, and various analytical tools and. A comprehensive data analysis icon set, ideal for illustrating data processing, teamwork dynamics, chart analysis, and various analytical tools, all on a white backdrop
Free with trial Reduction chart icon Vector symbol or sign set collection in black and white outline. Icon illustrating decrease vectors Decline Chart Icon Illustrating Decrease in Performance, Economic Downturn, and Analytical Data. Reduction chart icon Vector symbol or sign set collection in black and white outline
Free with trial This image features two variations of a graph icon showing a downward trend. One is a simple outline, while the other is a solid black silhouette. Both depict a graph with a sharp decline, represented by a line with a downward-pointing arrow. The icons are suitable for illustrating concepts like financial loss, economic downturn, negative growth, or any situation involving a decrease in value or performance. Icon illustrating decrease illustrations Declining Graph Icon Set. This image features two variations of a graph icon showing a downward trend. One is a simple outline, while the other is a solid black silhouette. Both depict a graph with a sharp decline, represented by a line with a downward-pointing arrow. The icons are suitable for illustrating concepts like financial loss, economic downturn, negative growth, or any situation involving a decrease in value or performance.
Free with trial This image features two variations of a decreasing graph icon. One is an outline version, and the other is a solid black version. Both show a bar graph with descending bars and a curved arrow pointing downwards, symbolizing a decline or decrease. These icons are suitable for illustrating concepts like loss, recession, negative trends, or falling statistics in various contexts. Icon illustrating decrease illustrations Decreasing Graph Icon Set. This image features two variations of a decreasing graph icon. One is an outline version, and the other is a solid black version. Both show a bar graph with descending bars and a curved arrow pointing downwards, symbolizing a decline or decrease. These icons are suitable for illustrating concepts like loss, recession, negative trends, or falling statistics in various contexts.
Free with trial This minimalist vector illustration features two identical line graphs, presented in contrasting black and white themes. The left graph displays a black line on a white background, while the right shows a white line on a black background. Both graphs depict a clear downward trend with jagged fluctuations, symbolizing decline, loss, or negative growth over time. This versatile icon set is ideal for illustrating concepts such as economic downturns, financial losses, market crashes, business failures, or any data showing a significant decrease. Perfect for presentations, reports, infographics, and web design. Icon illustrating decrease vectors Declining Line Graph Icon Set - Black and White. This minimalist vector illustration features two identical line graphs, presented in contrasting black and white themes. The left graph displays a black line on a white background, while the right shows a white line on a black background. Both graphs depict a clear downward trend with jagged fluctuations, symbolizing decline, loss, or negative growth over time. This versatile icon set is ideal for illustrating concepts such as economic downturns, financial losses, market crashes, business failures, or any data showing a significant decrease. Perfect for presentations, reports, infographics, and web design.
Free with trial A 3D icon illustrating financial loss isolated on a white background, ideal for financial and business themes. Icon illustrating decrease illustrations 3D Financial Loss Icon isolated. A 3D icon illustrating financial loss isolated on a white background, ideal for financial and business themes
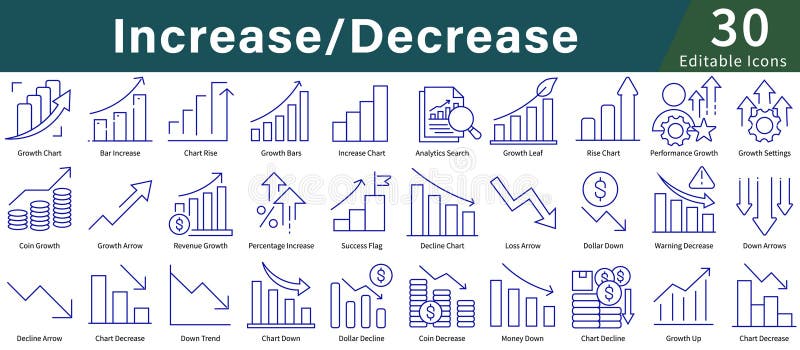
Free with trial Icons illustrating concepts of "Increase Decrease," using simple blue line art. Features include graphs and charts with upward and downward arrows, coins, dollar symbols, and percentage signs. Icons depict growth, decline, analytics, and performance tracking. Suitable for business, finance, or data analysis themes, these icons provide a visual representation of financial trends and statistics, making abstract concepts clear and easily understandable. The design is minimalistic and user-friendly, aimed at enhancing clarity in presentations and reports. Icon illustrating decrease vectors Increase Decrease Icon Set in Line Style with Editable Vector for Growth, Analytics, Charts, and Data Visualization. Icons illustrating concepts of "Increase Decrease," using simple blue line art. Features include graphs and charts with upward and downward arrows, coins, dollar symbols, and percentage signs. Icons depict growth, decline, analytics, and performance tracking. Suitable for business, finance, or data analysis themes, these icons provide a visual representation of financial trends and statistics, making abstract concepts clear and easily understandable. The design is minimalistic and user-friendly, aimed at enhancing clarity in presentations and reports.
Free with trial Reduction chart icon Black line art vector in black and white outline set collection sign. Icon illustrating decrease vectors Decline Chart Icon Illustrating Decrease in Performance, Economic Downturn, and Analytical Data. Reduction chart icon Black line art vector in black and white outline set collection sign
Free with trial A clean, minimalist icon representing an analytics graph. It features a series of vertical bars of varying heights, symbolizing data or trends. A line graph with circular data points connects the tops of some of the bars, illustrating growth, progress, or fluctuations over time. This graphic is ideal for representing business intelligence, financial data, research, or any concept related to data analysis and performance. Icon illustrating decrease vectors Analytics Graph Icon with Data Points. A clean, minimalist icon representing an analytics graph. It features a series of vertical bars of varying heights, symbolizing data or trends. A line graph with circular data points connects the tops of some of the bars, illustrating growth, progress, or fluctuations over time. This graphic is ideal for representing business intelligence, financial data, research, or any concept related to data analysis and performance.
Free with trial A simple outline icon featuring a circular arrow enclosing two triangle symbols, one pointing upwards and one downwards. This graphic effectively represents concepts like data fluctuation, refresh cycles, continuous change, market trends, or system updates involving variations. Ideal for illustrating processes, analytics, financial data, or any dynamic system requiring monitoring of increases and decreases. Its clean, minimalist design ensures versatility for web, app, and print applications. Icon illustrating decrease illustrations Refresh Cycle with Up Down Triangles Outline Icon. A simple outline icon featuring a circular arrow enclosing two triangle symbols, one pointing upwards and one downwards. This graphic effectively represents concepts like data fluctuation, refresh cycles, continuous change, market trends, or system updates involving variations. Ideal for illustrating processes, analytics, financial data, or any dynamic system requiring monitoring of increases and decreases. Its clean, minimalist design ensures versatility for web, app, and print applications.
Free with trial Compression icon illustrating the process of shrinking or collapsing elements between two opposing vertical arrows, an essential symbol for digital file management and application interfaces. Icon illustrating decrease vectors Compressing data creating a shrink file icon. Compression icon illustrating the process of shrinking or collapsing elements between two opposing vertical arrows, an essential symbol for digital file management and application interfaces
Free with trial A simple and clean line graph icon illustration, perfect for illustrating financial data, growth charts, and statistical analysis. Ideal for use in presentations, reports, and websites. Icon illustrating decrease vectors Minimalist Line Graph Icon Design for Financial Data Analysis Presentation. A simple and clean line graph icon illustration, perfect for illustrating financial data, growth charts, and statistical analysis. Ideal for use in presentations, reports, and websites.
Free with trial A minimalist vector icon illustrating market volatility and financial trends. The graphic features two distinct line graphs on a coordinate system: a jagged, highly fluctuating upper line representing high volatility, and a smoother lower line with marked points indicating a general trend. Up-down arrows and separate up down indicators further emphasize market movement and unpredictable changes. Ideal for financial reports, business presentations, data visualization, and economic analysis. Icon illustrating decrease vectors Market Volatility and Financial Trend Graph Icon. A minimalist vector icon illustrating market volatility and financial trends. The graphic features two distinct line graphs on a coordinate system: a jagged, highly fluctuating upper line representing high volatility, and a smoother lower line with marked points indicating a general trend. Up-down arrows and separate up down indicators further emphasize market movement and unpredictable changes. Ideal for financial reports, business presentations, data visualization, and economic analysis.
Free with trial A comprehensive vector icon set depicting various aspects of online video content creation and social media analytics. This collection includes symbols for growth charts, play buttons, speech bubbles representing comments or chat, subscriber counts, watch time indicators, and percentage-based progress arrows. Ideal for illustrating concepts related to video platforms, digital marketing, content creator dashboards, performance reports, and online engagement strategies. The modern flat design makes it suitable for websites, mobile applications, and presentations. Icon illustrating decrease vectors Video Content and Social Media Analytics Icon Set. A comprehensive vector icon set depicting various aspects of online video content creation and social media analytics. This collection includes symbols for growth charts, play buttons, speech bubbles representing comments or chat, subscriber counts, watch time indicators, and percentage-based progress arrows. Ideal for illustrating concepts related to video platforms, digital marketing, content creator dashboards, performance reports, and online engagement strategies. The modern flat design makes it suitable for websites, mobile applications, and presentations.
Free with trial A pair of minimalist line graphs illustrating a downward trend, presented in a high-contrast black on white and white on black design. The arrow at the end clearly indicates a decline, representing concepts like loss, decrease, negative growth, or recession. Ideal for financial reports, business presentations, economic news, data visualization, or any content requiring a clear symbol for falling statistics or poor performance. Icon illustrating decrease vectors Downward Trend Graph Icon Set - Black and White Decline Chart. A pair of minimalist line graphs illustrating a downward trend, presented in a high-contrast black on white and white on black design. The arrow at the end clearly indicates a decline, representing concepts like loss, decrease, negative growth, or recession. Ideal for financial reports, business presentations, economic news, data visualization, or any content requiring a clear symbol for falling statistics or poor performance.
Free with trial A simple graphic illustrating a housing market downturn. Icon illustrating decrease illustrations Real Estate Market Decline Vector Icon. A simple graphic illustrating a housing market downturn
Free with trial A collection of four icons featuring downward pointing arrows with percentage symbols, illustrating concepts of discount and decrease. Icon illustrating decrease illustrations Percentage down arrow icons representing discount and decrease. A collection of four icons featuring downward pointing arrows with percentage symbols, illustrating concepts of discount and decrease
Free with trial A vivid red arrow signifies a downward trend or negative movement. This impactful graphic represents decline loss decrease and is ideal for illustrating financial reports or data trends. Icon illustrating decrease illustrations Bold red arrow points downward showing decline loss decrease trend direction. A vivid red arrow signifies a downward trend or negative movement. This impactful graphic represents decline loss decrease and is ideal for illustrating financial reports or data trends
Free with trial A simple bar chart with a falling line, symbolizing financial decline, economic downturn, decreased profits, market loss, or negative business results. Ideal for illustrating risks, challenges, crisis situations, and economic analysis. Icon illustrating decrease vectors Declining financial chart icon with downward trend showing loss, decrease and negative business performance. A simple bar chart with a falling line, symbolizing financial decline, economic downturn, decreased profits, market loss, or negative business results. Ideal for illustrating risks, challenges, crisis situations, and economic analysis.
Free with trial A versatile collection of flat vector icons illustrating concepts of decline, decrease, and loss. This set features various graphics, including downward-pointing arrows, negative trend line graphs, and falling bar charts in multiple colors. These symbols are perfect for representing financial crisis, economic recession, stock market crash, business failure, or any form of reduction. Ideal for use in infographics, presentations, financial reports, websites, and data visualization projects, these modern icons effectively communicate negative trends and downturns. Isolated on a white background for easy integration into any design. Icon illustrating decrease illustrations Financial Decline and Recession Vector Icon Set. A versatile collection of flat vector icons illustrating concepts of decline, decrease, and loss. This set features various graphics, including downward-pointing arrows, negative trend line graphs, and falling bar charts in multiple colors. These symbols are perfect for representing financial crisis, economic recession, stock market crash, business failure, or any form of reduction. Ideal for use in infographics, presentations, financial reports, websites, and data visualization projects, these modern icons effectively communicate negative trends and downturns. Isolated on a white background for easy integration into any design.
Free with trial A minimalist line icon of a bottle with blue liquid and a green down arrow symbolizing reduction or refilling, ideal for concepts like hydration, conservation, or data input. Icon illustrating decrease illustrations Bottle with Blue Liquid and Green Down Arrow Icon Illustrating Reduction or Hydration Concept on a White Background. A minimalist line icon of a bottle with blue liquid and a green down arrow symbolizing reduction or refilling, ideal for concepts like hydration, conservation, or data input
Free with trial A clean flat design icon showing a zero percent change with a green upward arrow and a red downward arrow, perfect for illustrating neutral or balanced data trends in presentations or reports. Icon illustrating decrease illustrations Flat design percentage change zero with up and down arrows icon. A clean flat design icon showing a zero percent change with a green upward arrow and a red downward arrow, perfect for illustrating neutral or balanced data trends in presentations or reports
Free with trial A set of black line icons illustrating economic recession and market downturn concepts, including declining graphs, money loss, and GDP decrease, useful for business, finance, and marketing materials. Icon illustrating decrease vectors Economic Recession and Market Downturn outline icon set. economic recession market decline outline icons. A set of black line icons illustrating economic recession and market downturn concepts, including declining graphs, money loss, and GDP decrease, useful for business, finance, and marketing materials
Free with trial Red bars drop steadily, showing sharp decrease in values.. Ends with money pouch symbol, hinting at spending cuts or loss.. Clean, bold design emphasizes downward financial trend. Icon illustrating decrease vectors Declining bar chart with money bag icon illustrating financial downturn or budget reduction concept. Red bars drop steadily, showing sharp decrease in values.. Ends with money pouch symbol, hinting at spending cuts or loss.. Clean, bold design emphasizes downward financial trend
Free with trial Clean vector icon illustrating a declining line graph with push pins, symbolizing data analysis. Icon illustrating decrease illustrations Line graph decline chart icon. Clean vector icon illustrating a declining line graph with push pins, symbolizing data analysis
Free with trial Business analytics icon depicting price fluctuations in economic market data, financial growth concept. Icon illustrating decrease vectors Financial candlestick chart illustrating market trend for investment, stock trading data analysis. Isolated digital graphic. Business analytics icon depicting price fluctuations in economic market data, financial growth concept.
Free with trial Interest growth icon logo sign vector outline in black and white color. Icon illustrating decrease vectors Financial Growth Icon Illustrating Investment Gains, Economic Expansion, and Profit Increase. Interest growth icon logo sign vector outline in black and white color
Free with trial Interest growth icon Vector symbol or sign set collection in black and white outline. Icon illustrating decrease vectors Economic Growth Icon Illustrating Financial Prosperity, Investment Returns, and Profit Expansion. Interest growth icon Vector symbol or sign set collection in black and white outline
Free with trial Cost reduction concept icon with downward arrows, money bag, and minimalist design for financial management and budget savings in business investment and economic planning. Icon illustrating decrease vectors Line art icon illustrating cost reduction concept with a money bag and downward arrows. Cost reduction concept icon with downward arrows, money bag, and minimalist design for financial management and budget savings in business investment and economic planning
Free with trial Cost reduction icon web design logo set collection in flat vector. Icon illustrating decrease vectors Cost Reduction Icon Illustrating Business Efficiency Strategies, Budget Management Solutions, and Expense Reduction Programs for. Cost reduction icon web design logo set collection in flat vector
Free with trial A dynamic 3D illustration of a glossy red arrow pointing downwards in a jagged, volatile path. Isolated on a white background, this graphic icon is a powerful symbol for negative concepts. It represents decline, decrease, failure, loss, and crisis. This visual is perfect for illustrating stock market crashes, economic recession, financial downturns, poor business performance, or any downward trend in data and statistics. An ideal element for reports, presentations, and financial news, with ample copy space. Icon illustrating decrease illustrations Red Jagged Arrow of Decline - Financial Crisis Concept. A dynamic 3D illustration of a glossy red arrow pointing downwards in a jagged, volatile path. Isolated on a white background, this graphic icon is a powerful symbol for negative concepts. It represents decline, decrease, failure, loss, and crisis. This visual is perfect for illustrating stock market crashes, economic recession, financial downturns, poor business performance, or any downward trend in data and statistics. An ideal element for reports, presentations, and financial news, with ample copy space.
Free with trial A simple, flat design icon depicting a downward trend. The image features a red graph line descending from the top left to the bottom right, with an arrow indicating the direction. The graph is set against a clean white background, emphasizing the visual impact of the trend. This graphic is suitable for illustrating concepts such as financial decline, decreasing sales, or negative performance in business, economics, or data analysis. Icon illustrating decrease vectors Downward Trend Graph Icon. A simple, flat design icon depicting a downward trend. The image features a red graph line descending from the top left to the bottom right, with an arrow indicating the direction. The graph is set against a clean white background, emphasizing the visual impact of the trend. This graphic is suitable for illustrating concepts such as financial decline, decreasing sales, or negative performance in business, economics, or data analysis.
Free with trial Black and white icon of a dollar coin with three arrows pointing down, illustrating a decrease in value. Icon illustrating decrease vectors Dollar coin with three down arrows representing decreasing value. Black and white icon of a dollar coin with three arrows pointing down, illustrating a decrease in value
Free with trial This image showcases a collection of twenty distinct vector icons, each illustrating various representations of increase and decrease graphs. Icon illustrating decrease vectors Collection of Twenty Vector Icons Depicting Increase and Decrease Graphs. This image showcases a collection of twenty distinct vector icons, each illustrating various representations of increase and decrease graphs.
Free with trial Interest growth icon Black line art vector in black and white outline set collection sign. Icon illustrating decrease vectors Financial Icon Illustrating Growth, Investment Success, and Economic Prosperity. Interest growth icon Black line art vector in black and white outline set collection sign
Free with trial A high-resolution 3D render of a red circular icon featuring a bold white percentage symbol Ideal for illustrating sales discounts financial concepts and marketing materials The clean design is versatile and easily adaptable. Icon illustrating decrease illustrations Red Circle Percentage Icon 3D Render Discount Sale Promotion Offer Marketing Finance Symbol AI generated. A high-resolution 3D render of a red circular icon featuring a bold white percentage symbol Ideal for illustrating sales discounts financial concepts and marketing materials The clean design is versatile and easily adaptable
Free with trial A comprehensive collection of 10 professional icons illustrating global warming, climate change, and environmental crises. This set features high-quality blue and black linear designs for concepts such as the greenhouse effect, drought, flood, earth pollution, and temperature fluctuations. Designed with clean lines and modern aesthetics, these symbols are perfect for environmental infographics, scientific reports, educational presentations, and green energy websites. Each icon clearly represents a specific ecological challenge, making it an essential resource for climate activism and awareness campaigns. Icon illustrating decrease vectors . A comprehensive collection of 10 professional icons illustrating global warming, climate change, and environmental crises. This set features high-quality blue and black linear designs for concepts such as the greenhouse effect, drought, flood, earth pollution, and temperature fluctuations. Designed with clean lines and modern aesthetics, these symbols are perfect for environmental infographics, scientific reports, educational presentations, and green energy websites. Each icon clearly represents a specific ecological challenge, making it an essential resource for climate activism and awareness campaigns.
Free with trial A minimalist, black and white graphic representing a downward trend. A thick, bold arrow points diagonally down and to the right, symbolizing a decline. Below it, a jagged, irregular line graph mirrors this downward trajectory, depicting volatility and a general decrease. This imagery is ideal for illustrating financial losses, market downturns, negative performance, or any concept of falling or decreasing values. Icon illustrating decrease vectors Down Trend Arrow and Jagged Line Graph. A minimalist, black and white graphic representing a downward trend. A thick, bold arrow points diagonally down and to the right, symbolizing a decline. Below it, a jagged, irregular line graph mirrors this downward trajectory, depicting volatility and a general decrease. This imagery is ideal for illustrating financial losses, market downturns, negative performance, or any concept of falling or decreasing values.
Free with trial A vibrant graphic of a bar graph illustrating a downward trend, accented by a gear with a dollar sign, implying financial issues or market decline. Icon illustrating decrease vectors Dollar rate decrease icon. Currency decrease icon. Dollar sign symbol, USD currency. A vibrant graphic of a bar graph illustrating a downward trend, accented by a gear with a dollar sign, implying financial issues or market decline.
Free with trial Percentage symbol inside a circular arrow illustrating financial performance, interest rates, tax calculations, market fluctuations, or economic cycles in a modern sketch style illustration. Icon illustrating decrease illustrations Percentage symbol revolving looping business icon. Percentage symbol inside a circular arrow illustrating financial performance, interest rates, tax calculations, market fluctuations, or economic cycles in a modern sketch style illustration
Free with trial Gear symbol illustrating a mechanical process with an arrow pointing down, representing decreasing output, declining performance, or a reduction in industrial operations. Icon illustrating decrease vectors Gear icon indicating declining production process. Gear symbol illustrating a mechanical process with an arrow pointing down, representing decreasing output, declining performance, or a reduction in industrial operations
Free with trial Gear mechanism with people icons falling beneath a large down arrow, illustrating decrease in metrics, performance decline, workflow reduction and lowered efficiency in business or system settings. Icon illustrating decrease vectors Gear mechanism indicating reducing downward process. Gear mechanism with people icons falling beneath a large down arrow, illustrating decrease in metrics, performance decline, workflow reduction and lowered efficiency in business or system settings
Free with trial Magnifying glass highlighting a minus symbol, illustrating the concept of zooming out, reducing size, or decreasing a value within interfaces and digital applications. Icon illustrating decrease illustrations Magnifying glass showing zoom out or decrease concept. Magnifying glass highlighting a minus symbol, illustrating the concept of zooming out, reducing size, or decreasing a value within interfaces and digital applications
Free with trial Bar chart with descending bars and dashed arrow illustrating decline in value or trend analysis. Ideal for business, finance, economy, performance, forecasting, data, and growth planning. Simple flat. Icon illustrating decrease illustrations Declining Bar Chart with Dashed Arrow Representing Decrease and Trend Analysis. Bar chart with descending bars and dashed arrow illustrating decline in value or trend analysis. Ideal for business, finance, economy, performance, forecasting, data, and growth planning. Simple flat
Free with trial Gear mechanism showing a large downward arrow surrounded by smaller blue figures, illustrating a concept of decline, decrease, or negative trend within a system or process. Icon illustrating decrease vectors Economic downfall concept with downward arrow in gear. Gear mechanism showing a large downward arrow surrounded by smaller blue figures, illustrating a concept of decline, decrease, or negative trend within a system or process
Free with trial Blue downward arrows illustrating a decrease in value beside coin stacks and Bitcoin, symbolizing financial uncertainty. Ideal for finance, cryptocurrency, investment risk, market trends, economy. Icon illustrating decrease vectors Declining Cryptocurrency Value Represented by Falling Arrows and Bitcoin Stacks. Blue downward arrows illustrating a decrease in value beside coin stacks and Bitcoin, symbolizing financial uncertainty. Ideal for finance, cryptocurrency, investment risk, market trends, economy