Free with trial Business strategy conference or meeting office workers graphic or chart vector boss and employee with pointer financial statistics and analytical data coworkers teamwork or cooperation businessman. Illustration business decrease vectors Office workers business graphics meetings and conferences boss and employee. Business strategy conference or meeting office workers graphic or chart vector boss and employee with pointer financial statistics and analytical data coworkers teamwork or cooperation businessman
Free with trial A sad bald man. Red chart symbols pointing down. Fear of business. Comic cartoon pop art retro vector illustration hand drawing. Illustration business decrease vectors A sad bald man. Red chart symbols pointing down. Fear of business.
Free with trial Concept graph stock falls or illustrations for business design and infographic. Illustration business decrease vectors Concept graph stock falls or illustrations for business design
Free with trial Business loss, graph arrow decline, bankruptcy concept sketch. Depressed and frustrated businessman sitting on falling diagram, company, financial market crash metaphor. Hand drawn isolated vector. Illustration business decrease vectors Business loss, graph arrow decline, bankruptcy concept sketch. Hand drawn isolated vector. Business loss, graph arrow decline, bankruptcy concept sketch. Depressed and frustrated businessman sitting on falling diagram, company, financial market crash metaphor. Hand drawn isolated vector
Free with trial Oil stock crisis line icon. linear style sign for mobile concept and web design. Oil price decrease outline vector icon. Symbol, logo illustration. Vector graphics. Illustration business decrease vectors Oil stock crisis line icon
Free with trial Red 3D arrow pointing downward for crisis, business decline, sales decrease, or financial loss concept design. Vector illustration. Illustration business decrease vectors Red 3D arrow pointing downward for crisis
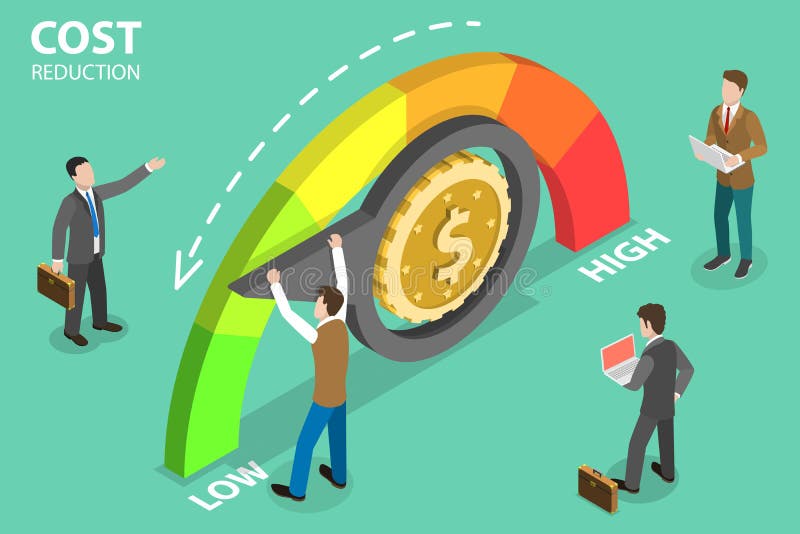
Free with trial 3D Isometric Flat Vector Concept of Cost Reduction, Dollar Rate Decrease, Price Minimising, Falling Rate of Profit. Illustration business decrease vectors 3D Isometric Flat Vector Concept of Cost Reduction, Dollar Rate Decrease. 3D Isometric Flat Vector Concept of Cost Reduction, Dollar Rate Decrease, Price Minimising, Falling Rate of Profit.
Free with trial Declining graph vector icon. Business decline chart filled flat sign for mobile concept and web design. Negative graph statistics glyph icon. Symbol, logo illustration. Vector graphics. Illustration business decrease vectors Declining graph vector icon
Free with trial Modern reduction line icon. Premium pictogram isolated on a white background. Vector illustration. Stroke high quality symbol. Decrease icon in modern line style. Illustration business decrease vectors Modern reduction line icon.
Free with trial 3D Red down arrow showing declining trend. Business stock market decrease symbol. Economic crisis concept. Vector illustration. Illustration business decrease vectors 3D Red down arrow showing declining trend
Free with trial Co2 icon in flat style. Emission vector illustration on white isolated background. Gas reduction business concept. Illustration business decrease vectors Co2 icon in flat style. Emission vector illustration on white isolated background. Gas reduction business concept
Free with trial Vector illustration. Investment management, the company is engaged in joint problem solving, sales decline, downward decline. Illustration business decrease vectors Vector illustration. Investment management
Free with trial Hand cutting Profits balloon and costs weight with scissors. Business concept vector illustration. Illustration business decrease vectors Hand cutting Profits balloon and costs weight with scissors
Free with trial Business person examines financial data on a laptop, focusing on a declining graph and calculation symbols. The vector illustration highlights financial challenges and downturns faced by investments. Illustration business decrease vectors Business Crisis Analysis with Falling. Business person examines financial data on a laptop, focusing on a declining graph and calculation symbols. The vector illustration highlights financial challenges and downturns faced by investments.
Free with trial Online financial analysis line icon. linear style sign for mobile concept and web design. Laptop with decrease dollar rate outline vector icon. Symbol, logo illustration. Vector graphics. Illustration business decrease vectors Online financial analysis line icon
Free with trial Business of the analyst with shooters and infographics. Illustration business decrease vectors Business analytics. Business of the analyst with shooters and infographics
Free with trial Cost icon vector design symbol illustration isolated on white background. Illustration business decrease vectors Cost icon vector design symbol illustration
Free with trial Oil price decrease pictogram icon silhouette vector illustration. Illustration business decrease vectors Oil price decrease pictogram icon silhouette vector illustration
Free with trial Interest rate reduction or dollar depreciation conceptual financial illustration, rollercoaster cart with a dollar sign on a roller coaster in the form of a financial report graph. Illustration business decrease vectors Interest rate reduction or dollar depreciation conceptual financial illustration, rollercoaster cart with a dollar sign on a
Free with trial Pandemic and flu outbreak coronavirus or covid-19 effect to US dollar currency trade and economy and stock market business and financial recession concept. Vector illustration design. Giant virus crash to container. Illustration business decrease vectors Pandemic and flu outbreak coronavirus or covid-19 effect to US dollar currency trade and economy and stock market business and
Free with trial Finance and business clear line, illustrations, icons, backgrounds and graphics. The icons pack is black and white, flat, , pixel perfect, minimal, suitable for web and print. Linear pictograms. Illustration business decrease illustrations Finance and business clear line icons. Finance and business clear line, illustrations, icons, backgrounds and graphics. The icons pack is black and white, flat, , pixel perfect, minimal, suitable for web and print. Linear pictograms.
Free with trial Oil price decrease pictogram icon silhouette vector illustration. Illustration business decrease vectors Oil price decrease pictogram icon silhouette vector illustration
Free with trial Tax word and scissors tax cut concept isolated on white background 3D illustration. Illustration business decrease illustrations Tax word and scissors tax cut concept isolated on white background 3D illustration.
Free with trial Digital composite of Business woman climbing stairs against grey background with white arrow. Illustration business decrease illustrations Business woman climbing stairs against grey background with white arrow
Free with trial Co2 icon in flat style. Emission vector illustration on white isolated background. Gas reduction business concept. Illustration business decrease vectors Co2 icon in flat style. Emission vector illustration on white isolated background. Gas reduction business concept
Free with trial Business falling icon isolated on background vector illustration. Non AI Generate. Illustration business decrease vectors Business falling icon isolated on background vector illustration.
Free with trial Growth graph, business decline graph or diagram with arrow up, down icon design black symbol isolated on white background. Vector EPS 10. Illustration business decrease vectors Growth graph, business decline graph or diagram with arrow up, down icon design black symbol isolated on white background. Vector
Free with trial Small business crashed by blue coronavirus sketch over concrete wall background. Concept of financial crisis due to covid 19 coronavirus pandemic. 3d rendering. Illustration business decrease illustrations Coronavirus covid small business financial crash. Small business crashed by blue coronavirus sketch over concrete wall background. Concept of financial crisis due to covid 19 coronavirus pandemic. 3d rendering
Free with trial Costs optimization and production efficiency, cost management icon. Reduce, decrease price. Inflation sign. Vector on isolated white background. EPS 10. Illustration business decrease vectors Costs optimization and production efficiency, cost management icon. Reduce, decrease price. Inflation sign. Vector on isolated
Free with trial A simple illustration of a bar chart with a downward arrow showing decline, loss, negative growth, or decreasing business and financial performance. Illustration business decrease vectors Business Decline Chart Illustration. A simple illustration of a bar chart with a downward arrow showing decline, loss, negative growth, or decreasing business. A simple illustration of a bar chart with a downward arrow showing decline, loss, negative growth, or decreasing business and financial performance
Free with trial Trend down isolated icon. Business graph line vector icon for websites and mobile 3d design. Illustration business decrease vectors Trend down isolated icon. Business graph line vector icon for websites and mobile 3d design.
Free with trial Businessman trying to push cost to minimum position illustration. Cost reduction strategy concept, eps10. Illustration business decrease vectors Businessman trying to push cost to minimum position illustration. Cost reduction strategy concept
Free with trial Bars descending graph vector line icon, sign, illustration on white background, editable strokes. Illustration business decrease vectors Bars descending graph vector line icon, sign, illustration on background, editable strokes
Free with trial Illustration of a business activities. Illustration business decrease vectors Illustration of a business activities
Free with trial Reputation Decrease Graphic icon. Monochrome style design from diagram collection. UI. Pixel perfect simple pictogram reputation decrease graphic icon. Web design, apps, software, print usage. Illustration business decrease illustrations Reputation Decrease Graphic icon. Monochrome style design from diagram icon collection. UI. Pixel perfect simple pictogram reputat. Reputation Decrease Graphic icon. Monochrome style design from diagram collection. UI. Pixel perfect simple pictogram reputation decrease graphic icon. Web design, apps, software, print usage.
Free with trial 3D Illustration of Stock market down trend. Candle stick chart in red color background. Extreme bearish panic sell stage. Illustration business decrease illustrations 3D Illustration of Stock market down trend. Candle stick chart in red color background. Extreme bearish panic sell stage
Free with trial Cost icon vector from finance concept. Thin line illustration of cost editable stroke. cost linear sign for use on web and mobile apps, logo, print media. Illustration business decrease vectors Cost icon vector from finance concept. Thin line illustration of cost editable stroke. cost linear sign for use on web and mobile
Free with trial Illustration of a business activities. Illustration business decrease vectors Illustration of a business activities
Free with trial Down chart icon on background for graphic and web design. Simple illustration. Internet concept symbol for website button or mobile app. Illustration business decrease vectors Down chart icon on background for graphic and web design. Simple illustration. Internet concept symbol for website
Free with trial Business growth in year 2011. Illustration business decrease illustrations Business growth in 2011. Business growth in year 2011
Free with trial Business growth of year in white background. Illustration business decrease illustrations Business growth of year
Free with trial Illustration of a business activities. Illustration business decrease vectors Illustration of a business activities
Free with trial Small business crashed by red coronavirus sketch over dark blue background. Concept of financial crisis due to 2019 ncov coronavirus pandemic. 3d rendering. Illustration business decrease illustrations Coronavirus small business financial crash. Small business crashed by red coronavirus sketch over dark blue background. Concept of financial crisis due to 2019 ncov coronavirus pandemic. 3d rendering
Free with trial Set of nine business charts isolated on white background. EPS file available. Illustration business decrease vectors Set of charts. Set of nine business charts isolated on white background.EPS file available
Free with trial An illustration showing financial fluctuation. Illustration business decrease vectors Vector financial. An illustration showing financial fluctuation
Free with trial Illustration of a business activities. Illustration business decrease vectors Illustration of a business activities
Free with trial An illustration showing financial fluctuation. Illustration business decrease vectors Vector financial. An illustration showing financial fluctuation
Free with trial 3D red arrow vector crash illustration background. Illustration business decrease vectors 3D red arrow crash. 3D red arrow vector crash illustration background
Free with trial Business diagram of decrease on the background of a worker. Illustration business decrease vectors Vector Worker. Business diagram of decrease on the background of a worker.
Free with trial Vibrant vector illustration featuring business data charts and graphs, including bar graphs, line graphs, pie charts, and a roller coaster metaphor for market trends. This eye-catching design is perfect for presentations, infographics, and financial reports. Illustration business decrease illustrations Business Data Charts Graphs Vector Illustration, Statistics. Vibrant vector illustration featuring business data charts and graphs, including bar graphs, line graphs, pie charts, and a roller coaster metaphor for market trends. This eye-catching design is perfect for presentations, infographics, and financial reports.
Free with trial Hammer smashing down sales price-illustration,vector. Illustration business decrease vectors Dollar down. Hammer smashing down sales price-illustration,vector
Free with trial Men falling down, holding umbrella and suitcase. Concept of safety, insurance or golden parachute. Illustration business decrease illustrations Safe business. Men falling down, holding umbrella and suitcase. Concept of safety, insurance or golden parachute.
Free with trial Group of businessmen falling down, holding umbrella and suitcase. Concept of safe system, insurance or golden parachute. Illustration business decrease illustrations Safe business. Group of businessmen falling down, holding umbrella and suitcase. Concept of safe system, insurance or golden parachute.
Free with trial Circular percentage icon indicating a decrease or reduction, useful for financial concepts like interest rate changes, sales, discounts, and data analysis in business and economics. Illustration business decrease vectors Decreasing percentage rate circular icon illustration. Circular percentage icon indicating a decrease or reduction, useful for financial concepts like interest rate changes, sales, discounts, and data analysis in business and economics
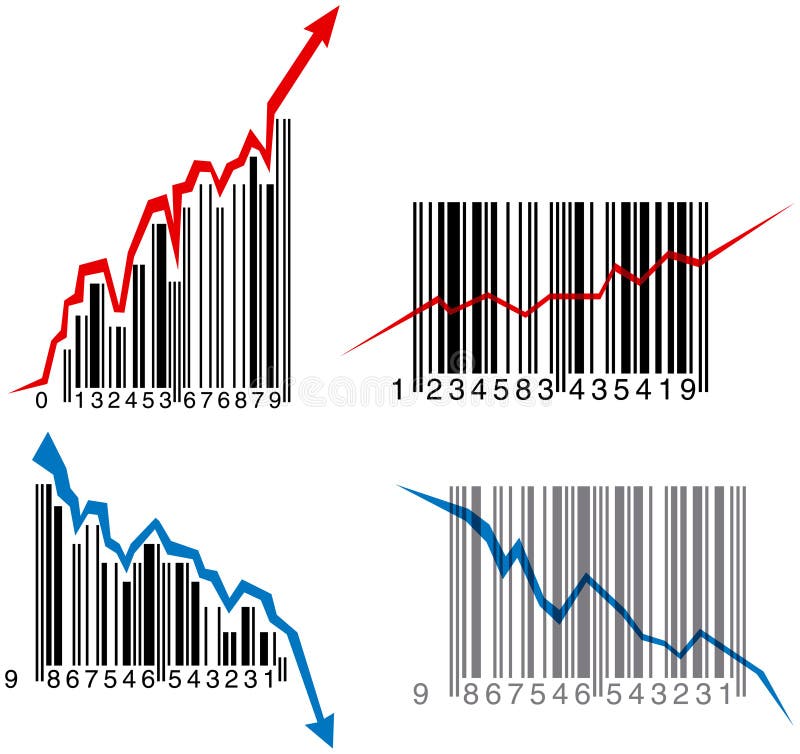
Free with trial Business growth, success and failure depression graph made from barcode (vector). Illustration business decrease vectors Barcode graphs. Business growth, success and failure depression graph made from barcode (vector)
Free with trial Two hand drawn charts designs. Sketchy illustration. Illustration business decrease vectors Hand drawn charts
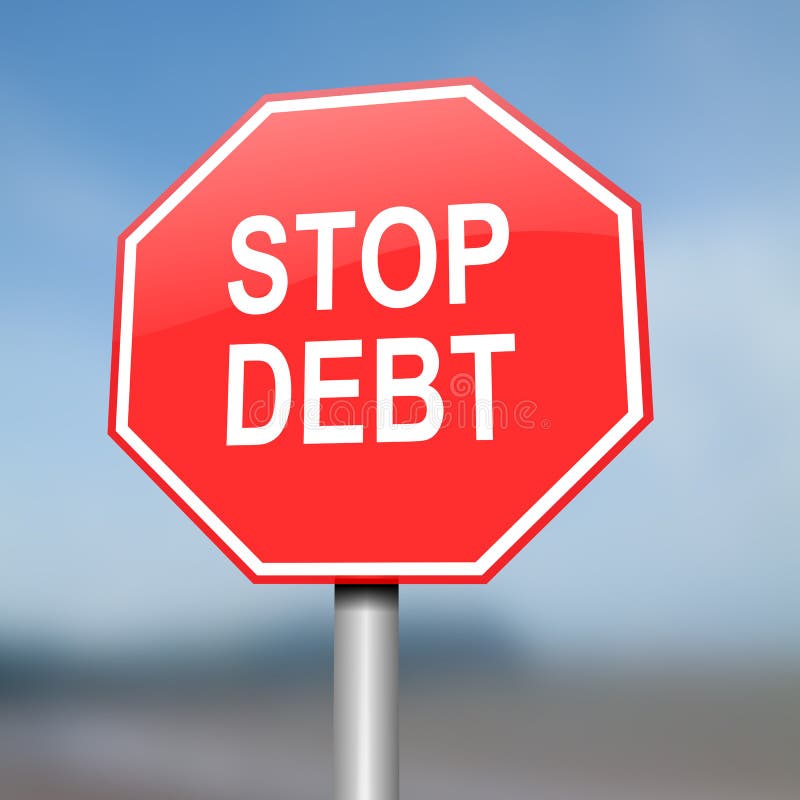
Free with trial Illustration depicting red and white warning road sign with a debt concept. Blurred background. Illustration business decrease illustrations Stop debt concept. Illustration depicting red and white warning road sign with a debt concept. Blurred background.
Free with trial A flat illustration of business graphs and charts showing analysis results. Featuring clean design and vibrant color scheme. Illustration business decrease vectors Colorful business graph and chart flat style design. A flat illustration of business graphs and charts showing analysis results. Featuring clean design and vibrant color scheme.
Free with trial Illustration depicting a sign post with directional arrow containing a debt relief concept. Blurred background. Illustration business decrease illustrations Debt relief concept.
Free with trial Red percent sign with downward arrow. Illustration business decrease illustrations Rapid Percent decrease. Red percent sign with downward arrow
Free with trial Graphic illustration of sale discounts. Illustration business decrease illustrations Discount traffic signs. Graphic illustration of sale discounts
Free with trial Abstract Decrease Volume Badge And Label Collection, vector editable design, can be used for business or presentation design. Illustration business decrease vectors Abstract Decrease Volume Badge And Label Collection
Free with trial Graphic illustration of sale discounts. Illustration business decrease illustrations Discount traffic signs. Graphic illustration of sale discounts
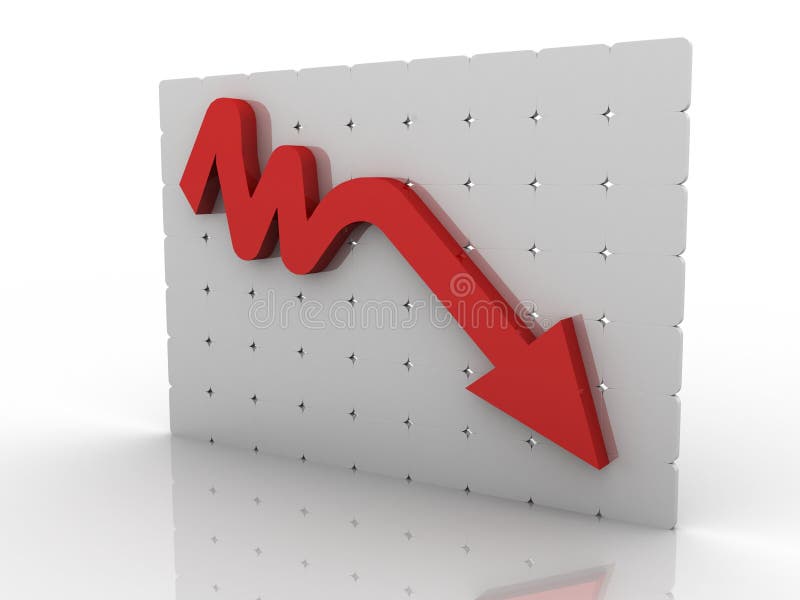
Free with trial Graph showing decrease in profits or earnings in 3D on white background. Illustration business decrease illustrations Decrease
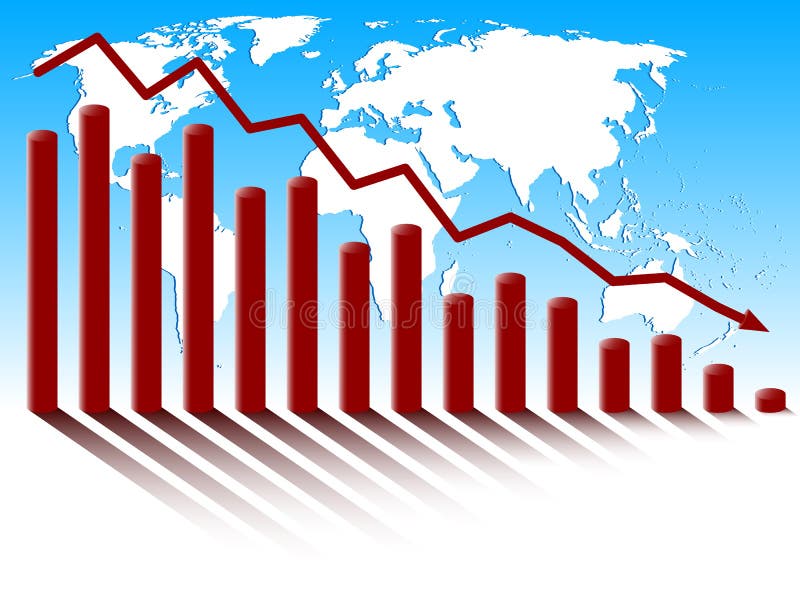
Free with trial Business diagram of decrease on the background of world map. Illustration business decrease vectors World global economic crisis. Business diagram of decrease on the background of world map.
Free with trial Business people interacting with large yellow percentage sign and downward arrow, symbolizing economic inflation decrease, tax reduction, and financial improvement, isolated vector illustration. Illustration business decrease vectors People Lowering Percentage Symbol for Tax Relief. Business people interacting with large yellow percentage sign and downward arrow, symbolizing economic inflation decrease, tax reduction, and financial improvement, isolated vector illustration
Free with trial Person and user icon set,vector and illustration. Illustration business decrease vectors Person and user icon set
Free with trial Business diagram glas bars in motion building a stair and showing success. Illustration business decrease illustrations Bar Chart In Motion. Business diagram glas bars in motion building a stair and showing success
Free with trial Abstract vector illustration of a downward graph with text Crisis. Illustration business decrease vectors Crisis Graph. Abstract vector illustration of a downward graph with text Crisis
Free with trial A simple illustration of a declining blue bar graph against a black background. Represents loss or decrease. Illustration business decrease vectors Declining bar graph demonstrating financial loss and recession illustration. A simple illustration of a declining blue bar graph against a black background. Represents loss or decrease.
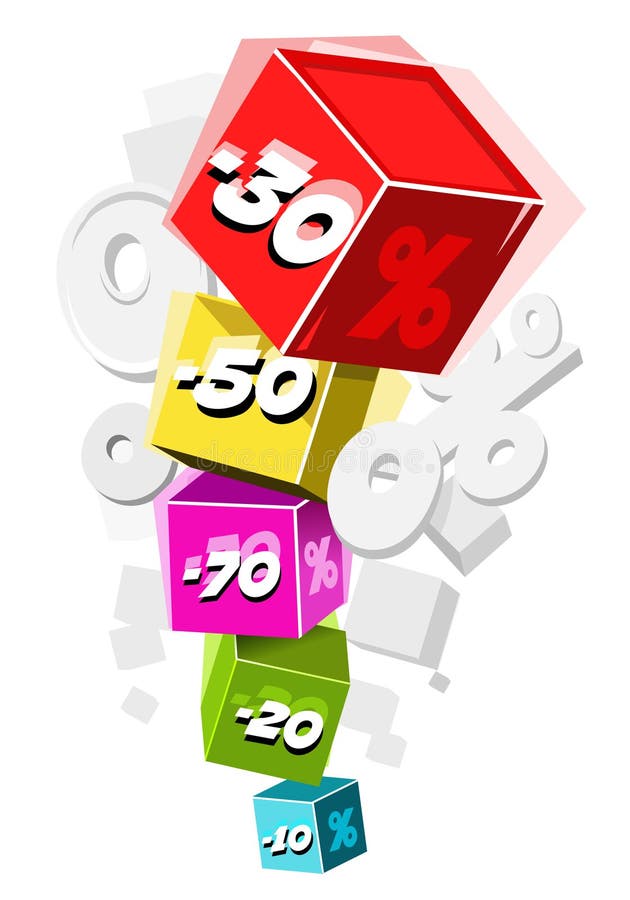
Free with trial Vector cubes with sales prices decrease. Illustration business decrease vectors Prices decrease
Free with trial Abstract statistics frame border illustration. Illustration business decrease illustrations Abstract statistics frame border
Free with trial A colorful bar chart showing a decrease or reduction by a red line and arrow above the bars. Illustration business decrease illustrations Colorful bar chart
Free with trial Minimalist style percentage illustration continuous line drawing business graph vector art. Illustration business decrease vectors Minimalist style percentage illustration continuous line drawing business graph
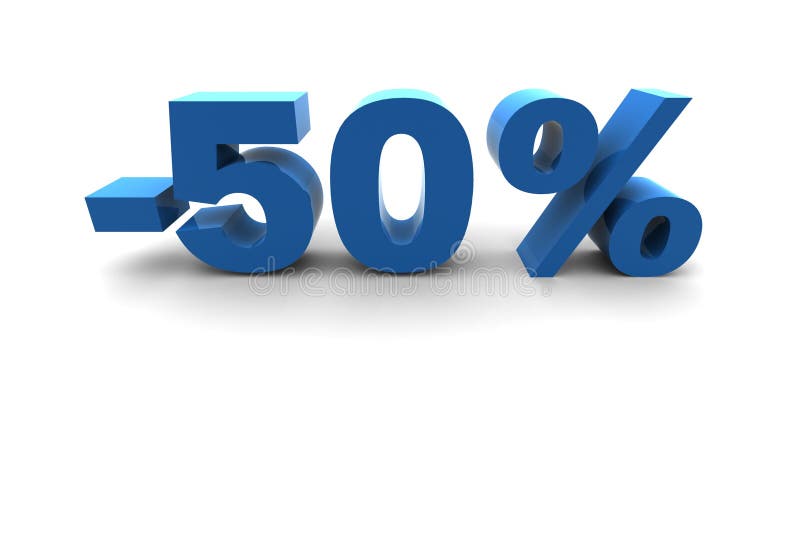
Free with trial Isolated 50% - 3d illustration on white background. Illustration business decrease illustrations Isolated 50%
Free with trial An image of a graphical pie chart, it could be useful for business concepts. Illustration business decrease illustrations Pie Chart 133. An image of a graphical pie chart, it could be useful for business concepts.
Free with trial Vector illustration of a man balancing the Dollar currency on a scale. Illustration business decrease vectors Balance Value. Vector illustration of a man balancing the Dollar currency on a scale
Free with trial An illustration featuring two contrasting arrows against a plain white background. The red arrow shows a wavy upward trend, symbolizing growth, increase, or positive performance with fluctuation. The black arrow shows a wavy downward trend, symbolizing decline, decrease, or negative performance with fluctuation. This visual concept is often used to represent financial market volatility, business. Illustration business decrease vectors Dynamic business trends illustrated by contrasting red upward and black downward arrows Vector. An illustration featuring two contrasting arrows against a plain white background. The red arrow shows a wavy upward trend, symbolizing growth, increase, or positive performance with fluctuation. The black arrow shows a wavy downward trend, symbolizing decline, decrease, or negative performance with fluctuation. This visual concept is often used to represent financial market volatility, business
Free with trial Abstract 3d illustration with house and growing diagram. Illustration business decrease illustrations Real estate diagram. Abstract 3d illustration with house and growing diagram
Free with trial Easy to edit vector illustration of loss arrow hitting businessman showing financial crisis. Illustration business decrease vectors Loss arrow hitting Businessman