Free with trial Business growth and loss icon. Bar chart with rising and falling arrow symbol illustration. Illustration business decrease vectors Business growth and loss icon. Bar chart with rising and falling arrow symbol
Free with trial Set line Financial growth decrease Sales funnel with chart Pie infographic and Binary code with long shadow. Red square button. Vector. Illustration business decrease illustrations Set line Financial growth decrease, Sales funnel with chart, Pie infographic and Binary code with long shadow. Red. Set line Financial growth decrease Sales funnel with chart Pie infographic and Binary code with long shadow. Red square button. Vector.
Free with trial The image depicts a dollar sign in the center with a red downward arrow on the left and a green upward arrow on the right. This visual metaphor represents financial trends, specifically a decrease and an increase in monetary value or economic indicators. Illustration business decrease illustrations Financial trend illustration showing increase and decrease with dollar sign. The image depicts a dollar sign in the center with a red downward arrow on the left and a green upward arrow on the right. This visual metaphor represents financial trends, specifically a decrease and an increase in monetary value or economic indicators
Free with trial A business professional conducts a thorough analysis of financial data using a magnifying glass, illustrating market trends with graphs and charts on a digital interface. Scalp. Illustration business decrease illustrations Business Professional Analyzing Financial Data with a Magnifying Glass, Graphs, and Visual Representation of Market. A business professional conducts a thorough analysis of financial data using a magnifying glass, illustrating market trends with graphs and charts on a digital interface. Scalp
Free with trial A conceptual vector illustration depicting the duality of business performance. On a modern teal background, two reports are shown side-by-side. One features a rising red graph symbolizing growth, profit, and success, while the other displays a descending graph representing decline, loss, and failure. This flat design graphic is ideal for financial analysis, market trend comparisons, business presentations, and infographics illustrating opposite outcomes or strategic choices. The long shadow effect adds a contemporary feel to the design. Illustration business decrease vectors Growth and Decline Business Charts Comparison. A conceptual vector illustration depicting the duality of business performance. On a modern teal background, two reports are shown side-by-side. One features a rising red graph symbolizing growth, profit, and success, while the other displays a descending graph representing decline, loss, and failure. This flat design graphic is ideal for financial analysis, market trend comparisons, business presentations, and infographics illustrating opposite outcomes or strategic choices. The long shadow effect adds a contemporary feel to the design.
Free with trial Set line Financial growth decrease, Light bulb, Factory and Delivery tracking icon. Vector. Illustration business decrease illustrations Set line Financial growth decrease, Light bulb, Factory and Delivery tracking icon. Vector
Free with trial An eye-catching 3D bar graph illustration with yellow, blue, and red elements. It is designed to represent data or growth concepts. Illustration business decrease vectors Colorful 3D bar graph illustration showing descending values on transparent background. An eye-catching 3D bar graph illustration with yellow, blue, and red elements. It is designed to represent data or growth concepts.
Free with trial Hand drawn style bar graph displaying a continuous downward trend and data decrease arrow. Illustration business decrease vectors Hand drawn style bar graph displaying a continuous downward trend and data decrease arrow
Free with trial Modern, minimalistic chart icon for business and finance. Illustration business decrease illustrations Modern, minimalistic chart icon for business and finance
Free with trial The concept of a business financial crash depicted by a vibrant 3D rendering of a declining chart. Illustration business decrease illustrations The concept of a business financial crash depicted by a vibrant 3D rendering of a declining chart.
Free with trial A clean, minimalist icon representing a decrease of ten percent, symbolized by a down arrow and the -10% sign. Perfect for financial reports, data analysis, or any context requiring a visual representation of decline. Illustration business decrease vectors Simple Outline Decrease Percentage Ten Percent Drop Down Arrow Icon. A clean, minimalist icon representing a decrease of ten percent, symbolized by a down arrow and the -10% sign. Perfect for financial reports, data analysis, or any context requiring a visual representation of decline.
Free with trial Set line Dollar rate decrease, Global economic crisis, news and icon. Vector. Illustration business decrease vectors Set line Dollar rate decrease, Global economic crisis, news and icon. Vector
Free with trial Downward arrow with Tax vector icon. filled flat sign for mobile concept and web design. Tax Decrease glyph icon. Symbol, logo illustration. Vector graphics. Illustration business decrease illustrations Downward arrow with Tax vector icon
Free with trial Up and down curved arrow chart icon illustration. Business trend bar symbol in black circle. Illustration business decrease vectors Up and down curved arrow chart icon. Business trend bar symbol in black circle
Free with trial Man business mediator works in conflict management and sits between two boxing gloves. Experienced boss mediator stops dispute corporate employees to avoid decrease in work productivity. Illustration business decrease vectors Man business mediator works in conflict management and sits between two boxing gloves
Free with trial Stylized illustration depicts a black, downward-trending arrow within a graph framework, set against a solid pastel yellow background. The image is suitable for conveying concepts related to market decline, financial downturns, or negative trends in various business or editorial contexts, lending itself well to presentations or reports. Illustration business decrease illustrations Downward trend arrow graph illustrates market decline and business loss. Stylized illustration depicts a black, downward-trending arrow within a graph framework, set against a solid pastel yellow background. The image is suitable for conveying concepts related to market decline, financial downturns, or negative trends in various business or editorial contexts, lending itself well to presentations or reports
Free with trial Workers Productivity Decrease 3D Icon, symbolizing challenges in workplace efficiency, motivation, and overall performance. Illustration business decrease illustrations Workers Productivity Decrease 3D Icon
Free with trial This impactful illustration depicts the challenging realities of business downsizing. A digital tablet screen showcases a downward trending graph and decreasing staff icons, visually representing staff reduction and layoffs. The image poignantly conveys concepts of unemployment, financial decline, and economic loss. Ideal for presentations on finance, economy, or discussions surrounding job cuts,. Illustration business decrease illustrations Business downsizing phase depicted on a digital tablet screen with decreasing staff and arrow. This impactful illustration depicts the challenging realities of business downsizing. A digital tablet screen showcases a downward trending graph and decreasing staff icons, visually representing staff reduction and layoffs. The image poignantly conveys concepts of unemployment, financial decline, and economic loss. Ideal for presentations on finance, economy, or discussions surrounding job cuts,
Free with trial Set Online poker table game Casino chips exchange American football betting money and Financial growth decrease icon with long shadow. Vector. Illustration business decrease illustrations Set Online poker table game, Casino chips exchange, American football betting money and Financial growth decrease icon. Set Online poker table game Casino chips exchange American football betting money and Financial growth decrease icon with long shadow. Vector.
Free with trial Business and financial crisis vector concept with businessman falling down the hole. Symbol of market crash, recession, risk, bankruptcy and loss. Eps10 illustration. Illustration business decrease vectors Business and financial crisis vector concept with businessman falling down the hole. Symbol of market crash, recession, risk
Free with trial A modern illustration on a white background featuring a young manager in a continuous line drawing, giving a. Illustration business decrease illustrations A modern illustration on a white background featuring a young manager in a continuous line drawing, giving a
Free with trial An illustration of a green arrow pointing upwards and a red arrow pointing downwards on a graph background. The green arrow represents growth or increase, while the red arrow represents decline or decrease. The image can be used to symbolize contrasting trends or outcomes in various contexts such as business, finance, or economics. Illustration business decrease illustrations Green and Red Arrows on a Graph. An illustration of a green arrow pointing upwards and a red arrow pointing downwards on a graph background. The green arrow represents growth or increase, while the red arrow represents decline or decrease. The image can be used to symbolize contrasting trends or outcomes in various contexts such as business, finance, or economics.
Free with trial A simple yet effective graphic representing a negative trend or declining business chart, perfect for illustrating downward data or economic downturn. Illustration business decrease vectors Negative Trend Graph, Decreasing Business Chart, Downward Data Illustration. A simple yet effective graphic representing a negative trend or declining business chart, perfect for illustrating downward data or economic downturn.
Free with trial Graph growth with arrow up and reduction with arrow down, line chart icon. Financial invest, fall, increase and decrease. Statistics and analytics. Vector flat illustration. Illustration business decrease vectors Graph growth with arrow up and reduction with arrow down, line chart icon. Financial invest, fall, increase and decrease
Free with trial A creative business and marketing illustration perfect for branding, presentations, and digital projects. Available in AI, EPS, PNG, SVG, and Figma. Illustration business decrease vectors A sketchy style illustration showing a market failure. A creative business and marketing illustration perfect for branding, presentations, and digital projects. Available in AI, EPS, PNG, SVG, and Figma.
Free with trial A simple flat icon vector illustration of two hands adjusting a simple chart with a downturn arrow, symbolizing risk mitigation in a business setting. The simple chart with a downturn arrow is orange with dark gray elements, indicating loss control. White background. Minimalist style with sharp edges and no shadows. Orange and Gray color palette. Vector graphics with rounded corners. High. Illustration business decrease illustrations Business Downturn Graph Two Hands Hold Downward Trend Chart. A simple flat icon vector illustration of two hands adjusting a simple chart with a downturn arrow, symbolizing risk mitigation in a business setting. The simple chart with a downturn arrow is orange with dark gray elements, indicating loss control. White background. Minimalist style with sharp edges and no shadows. Orange and Gray color palette. Vector graphics with rounded corners. High
Free with trial This illustration shows boxes on a pallet with a red downward arrow, symbolizing decline, loss, or reduction in business, shipping, or inventory levels. Illustration business decrease vectors Illustration of boxes on a pallet with a downward arrow indicating decline isolated on white background. This illustration shows boxes on a pallet with a red downward arrow, symbolizing decline, loss, or reduction in business, shipping, or inventory levels
Free with trial Hand-drawn illustration of a bar graph with bars and a prominent arrow showcasing a downward trend. Concepts of decline, loss, or negative growth in various business and educational settings. Illustration business decrease vectors Hand-Drawn Decreasing Bar Graph Illustration. hand-drawn illustration of a bar graph with bars and a prominent arrow showcasing a downward trend. Concepts of decline, loss, or negative growth in various business and educational settings
Free with trial Simple line art business icons set featuring a magnifying glass, minus symbol, pie chart, and rising bar graph for financial data analysis. Illustration business decrease vectors Simple line art business icons set featuring a magnifying glass, minus symbol, pie chart, and rising bar graph for
Free with trial Business and finance isometric illustrations set. Vector made with AI. Illustration business decrease vectors Business and finance isometric illustrations set
Free with trial A minimalist black line graph icon on a clean white background, clearly illustrating a downward trend. The zigzagging line culminates in a sharp arrow pointing downwards, symbolizing decline, decrease, or negative performance. This versatile vector illustration is ideal for representing financial losses, economic downturns, sales drops, market crashes, or any data indicating a negative trajectory. Perfect for business reports, presentations, websites, apps, and infographics requiring a clear visual indicator of reduction or poor results. Illustration business decrease vectors Downward Trend Graph with Arrow Icon. A minimalist black line graph icon on a clean white background, clearly illustrating a downward trend. The zigzagging line culminates in a sharp arrow pointing downwards, symbolizing decline, decrease, or negative performance. This versatile vector illustration is ideal for representing financial losses, economic downturns, sales drops, market crashes, or any data indicating a negative trajectory. Perfect for business reports, presentations, websites, apps, and infographics requiring a clear visual indicator of reduction or poor results.
Free with trial A vibrant 3D bar chart, featuring glossy blue and orange rectangular segments, illustrates data progression or comparison. The varying bar heights convey growth or statistical analysis. This modern graphic is ideal for business, finance, and analytical concepts, presented cleanly isolated on a transparent background. Illustration business decrease vectors Glossy 3D bar chart showing data growth and statistics with blue and orange segments, perfect for business and finance presentatio. A vibrant 3D bar chart, featuring glossy blue and orange rectangular segments, illustrates data progression or comparison. The varying bar heights convey growth or statistical analysis. This modern graphic is ideal for business, finance, and analytical concepts, presented cleanly isolated on a transparent background.
Free with trial This minimalist vector illustration depicts a retail store icon integrated into a shopping cart, positioned against a declining line graph. The visual metaphor highlights a negative economic trend or a decrease in consumer activity. The color palette uses muted tones with a bold red accent to emphasize the downward trajectory of the market performance. Illustration business decrease vectors A line graph showing a downward trend for a retail business concept. This minimalist vector illustration depicts a retail store icon integrated into a shopping. This minimalist vector illustration depicts a retail store icon integrated into a shopping cart, positioned against a declining line graph. The visual metaphor highlights a negative economic trend or a decrease in consumer activity. The color palette uses muted tones with a bold red accent to emphasize the downward trajectory of the market performance
Free with trial Bankruptcy of business woman falling apart into banknotes is caused by high credit obligations. Upset woman became victim of bankruptcy due to financial crisis and decrease in personal income. Illustration business decrease vectors Bankruptcy of business woman falling apart into banknotes is caused by high credit obligations
Free with trial A creative business and marketing illustration perfect for branding, presentations, and digital projects. Available in AI, EPS, PNG, SVG, and Figma. Illustration business decrease vectors A sketchy style illustration showing a market failure. A creative business and marketing illustration perfect for branding, presentations, and digital projects. Available in AI, EPS, PNG, SVG, and Figma.
Free with trial Money arrow up and down icon set. Price change symbol. Increase and decrease arrow with dollar sign. Cash currency rate. Stock graph. Income and loss vector illustration. Red and green money arrow set. Illustration business decrease vectors Money arrow up and down icon set. Price change symbol. Increase and decrease arrow with dollar sign. Cash currency rate. Stock
Free with trial A vibrant red arrow curves and points downwards against a clean white background. This 3D rendered illustration conveys the concept of decline, decrease, or downward trend. Its clean design makes it suitable for a variety of applications, including business presentations, financial reports, and data visualizations. The image is versatile and can be used to represent negative growth, falling prices, or other downward movements. Illustration business decrease illustrations Red Arrow Pointing Down - Decline Concept. A vibrant red arrow curves and points downwards against a clean white background. This 3D rendered illustration conveys the concept of decline, decrease, or downward trend. Its clean design makes it suitable for a variety of applications, including business presentations, financial reports, and data visualizations. The image is versatile and can be used to represent negative growth, falling prices, or other downward movements.
Free with trial Orange bars on white platform show sharp downward trend with arrow pointing down. Represents economic decline, business failure, financial crisis. Conceptual graphic for market. Illustration business decrease illustrations Orange bars on white platform show sharp downward trend with arrow pointing down. Represents economic decline, business failure
Free with trial Set line Falling property prices, Dollar rate decrease, Global economic crisis and Safe icon. Vector. Illustration business decrease vectors Set line Falling property prices, Dollar rate decrease, Global economic crisis and Safe icon. Vector
Free with trial Decrease and increase temperature of air on thermometer thin black and red symbols vector illustration. Four seasons, hot and cold weather of winter, summer and spring, autumn time line icon set. Illustration business decrease vectors Four seasons, hot and cold weather of winter, summer and spring, autumn line icon set. Decrease and increase temperature of air on thermometer thin black and red symbols vector illustration. Four seasons, hot and cold weather of winter, summer and spring, autumn time line icon set
Free with trial Positive business graph arrow. Wide red arrow icon financial graph. Illustration business decrease illustrations Positive business graph arrow. Wide red arrow icon financial graph
Free with trial A striking 3D illustration depicting the word 'LOSS' in bold white letters, encapsulated within a transparent, glowing sphere. Inside the sphere, red triangular shapes point downwards, symbolizing a negative trend, decline, or financial downturn. Concentric orange-red rings orbit the sphere, adding a dynamic and impactful visual effect against a dark background. This powerful image conveys concepts of business failure, economic crisis, market crash, risk, and warning, making it ideal for financial reports, news articles, and presentations on challenging economic situations. Illustration business decrease illustrations Financial Loss and Business Decline Concept. A striking 3D illustration depicting the word 'LOSS' in bold white letters, encapsulated within a transparent, glowing sphere. Inside the sphere, red triangular shapes point downwards, symbolizing a negative trend, decline, or financial downturn. Concentric orange-red rings orbit the sphere, adding a dynamic and impactful visual effect against a dark background. This powerful image conveys concepts of business failure, economic crisis, market crash, risk, and warning, making it ideal for financial reports, news articles, and presentations on challenging economic situations.
Free with trial Recession concept. Falling market. The trading broker is horrified at the falling market. Financial graph down. Vector illustration isometric design. Illustration business decrease vectors Recession concept. Falling market. Financial graph down. Vector illustration isometric design. Recession concept. Falling market. The trading broker is horrified at the falling market. Financial graph down. Vector illustration isometric design.
Free with trial Declining Graph With Cursor Line And Solid Icon Set. Economic Downturn, Market Analysis, And Financial Decline Symbol Collection. Business Performance Tracking. Isolated Vector Illustration. Illustration business decrease vectors Declining Graph With Cursor Line And Solid Icon Set. Economic Downturn, Market Analysis, And Financial Decline Symbol
Free with trial This vibrant vector illustration showcases a collection of red and orange gradient arrows, all pointing downwards. The set includes both straight and dynamically curved arrows, effectively symbolizing various forms of decline, decrease, or negative trends. Perfect for use in business presentations, financial reports, infographics, or any design requiring a clear visual representation of falling statistics, market drops, recession, loss, or a general downward movement. The clean, modern flat design ensures versatility and impact. Illustration business decrease vectors Downward Trend Red Gradient Arrows Vector Set. This vibrant vector illustration showcases a collection of red and orange gradient arrows, all pointing downwards. The set includes both straight and dynamically curved arrows, effectively symbolizing various forms of decline, decrease, or negative trends. Perfect for use in business presentations, financial reports, infographics, or any design requiring a clear visual representation of falling statistics, market drops, recession, loss, or a general downward movement. The clean, modern flat design ensures versatility and impact.
Free with trial Decrease and increase chart icon illustration with arrow. Negative and positive trend symbol in black circle. Illustration business decrease vectors Decrease and increase chart icon with arrow. Negative and positive trend symbol in black circle
Free with trial A minimalist black icon depicting a business data chart. It features a bar graph with multiple vertical bars, overlaid by two distinct line graphs. One line graph shows an upward trend with data points, symbolizing growth and success, while the other illustrates a downward trend, representing decline or loss. This versatile vector illustration is ideal for conveying concepts related to financial analysis, market trends, business performance, statistics, and economic fluctuations. Perfect for web interfaces, presentations, reports, and infographics. Illustration business decrease vectors Business Data Analysis Chart Icon with Trends. A minimalist black icon depicting a business data chart. It features a bar graph with multiple vertical bars, overlaid by two distinct line graphs. One line graph shows an upward trend with data points, symbolizing growth and success, while the other illustrates a downward trend, representing decline or loss. This versatile vector illustration is ideal for conveying concepts related to financial analysis, market trends, business performance, statistics, and economic fluctuations. Perfect for web interfaces, presentations, reports, and infographics.
Free with trial A simple flat icon vector illustration of two hands adjusting a simple chart with a downturn arrow, symbolizing risk mitigation in a business setting. The simple chart with a downturn arrow is orange with dark gray elements, indicating loss control. White background. Minimalist style with sharp edges and no shadows. Orange and Gray color palette. Vector graphics with rounded corners. High. Illustration business decrease illustrations Hands Protect Financial Growth Chart Decline, Business Crisis Management. A simple flat icon vector illustration of two hands adjusting a simple chart with a downturn arrow, symbolizing risk mitigation in a business setting. The simple chart with a downturn arrow is orange with dark gray elements, indicating loss control. White background. Minimalist style with sharp edges and no shadows. Orange and Gray color palette. Vector graphics with rounded corners. High
Free with trial A bold red downward arrow symbolizes a decline in price or value, positioned between two black oil barrels, representing the oil industry and market trends. Perfect for financial, energy, or business graphics. Illustration business decrease illustrations Oil barrel price drop or decrease illustration. A bold red downward arrow symbolizes a decline in price or value, positioned between two black oil barrels, representing the oil industry and market trends. Perfect for financial, energy, or business graphics
Free with trial Shiny blue bar graph depicts growth then decline, presented on a financial document Useful for showcasing data analysis and reporting. Illustration business decrease illustrations Analyzing Business Graph Illustration Showing Decrease and Growth Statistics Report. Shiny blue bar graph depicts growth then decline, presented on a financial document Useful for showcasing data analysis and reporting
Free with trial Flat vector illustration depicting a person adjusting a down-trending graph, representing economic decline or market downturn in a stylized way. Illustration business decrease illustrations Declining Market Flat Illustration with Person and Arrow Indicating Downturn Economy. Flat vector illustration depicting a person adjusting a down-trending graph, representing economic decline or market downturn in a stylized way.
Free with trial Carbon neutral, net zero, sustainable eco energy production, reduction of consumption line icon set. CO2 pollution decrease, circular economy thin black and red outline symbols vector illustration. Illustration business decrease vectors Carbon neutral, net zero, sustainable eco energy production, economy line icon set. Carbon neutral, net zero, sustainable eco energy production, reduction of consumption line icon set. CO2 pollution decrease, circular economy thin black and red outline symbols vector illustration
Free with trial Illustration of a business deal cycle with a handshake, declining graph, and circular arrows, symbolizing downturns and continuous processes. Illustration business decrease illustrations Business Deal Decline Handshake Downward Graph. Illustration of a business deal cycle with a handshake, declining graph, and circular arrows, symbolizing downturns and continuous processes
Free with trial Downward trend financial graph sketch illustration. Illustration business decrease vectors Downward trend financial graph sketch illustration
Free with trial An illustration of a business funnel with a crossing out symbol on top, indicating rejection or elimination. The funnel features three layers in green, blue, and white, representing different stages of a sales or marketing process. The image can be used to convey concepts such as lead generation, conversion rates, or customer journey. Illustration business decrease illustrations Business Funnel Concept with Crossing Out Symbol. An illustration of a business funnel with a crossing out symbol on top, indicating rejection or elimination. The funnel features three layers in green, blue, and white, representing different stages of a sales or marketing process. The image can be used to convey concepts such as lead generation, conversion rates, or customer journey.
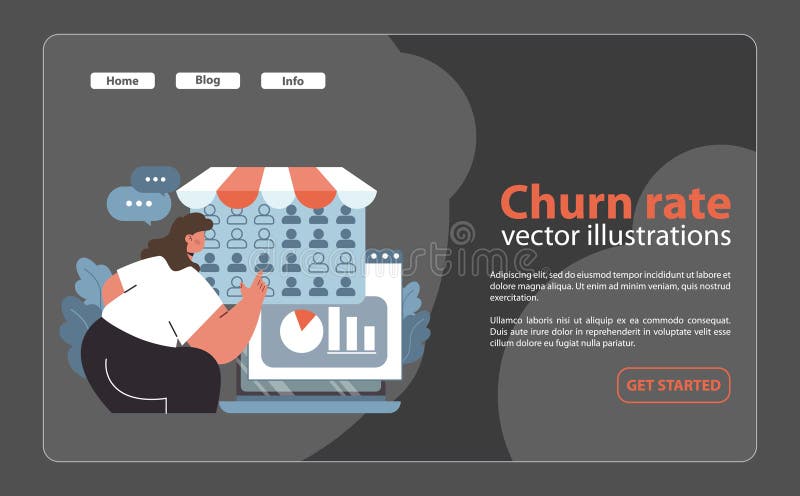
Free with trial Churn rate analytics concept. Woman studying customer retention metrics on a computer screen. Business analysis, graph visualization, and feedback tracking. Flat vector illustration. Illustration business decrease vectors Churn rate analytics concept. Flat. Churn rate analytics concept. Woman studying customer retention metrics on a computer screen. Business analysis, graph visualization, and feedback tracking. Flat vector illustration
Free with trial CO2 pollution decrease, circular economy thin black outline symbols vector illustration. Carbon neutral, net zero, sustainable eco energy production, reduction of consumption line icon set. Illustration business decrease vectors Carbon neutral, net zero, sustainable eco energy production, economy line icon set. CO2 pollution decrease, circular economy thin black outline symbols vector illustration. Carbon neutral, net zero, sustainable eco energy production, reduction of consumption line icon set
Free with trial A modern minimalist digital illustration depicts an oval-shaped light bulb with a curved top and pointed bottom containing a three-dimensional bar graph showing a clear downward trend with bars of varying heights representing different business metrics decreasing in value against a clean background symbolizing negative performance, decline, or economic downturn in corporate or financial contexts. Illustration business decrease illustrations Modern light bulb icon with declining bar graph inside representing business concept and negative trend. A modern minimalist digital illustration depicts an oval-shaped light bulb with a curved top and pointed bottom containing a three-dimensional bar graph showing a clear downward trend with bars of varying heights representing different business metrics decreasing in value against a clean background symbolizing negative performance, decline, or economic downturn in corporate or financial contexts
Free with trial Visual representation of a hand reaching out over a laptop displaying quality and cost indicators, symbolizing business analysis and performance metrics in a modern setting. Qubit. Illustration business decrease illustrations Hand Reaching Out Over Laptop Displaying Quality and Cost Percentage Indicators in a Dark Background for Business. Visual representation of a hand reaching out over a laptop displaying quality and cost indicators, symbolizing business analysis and performance metrics in a modern setting. Qubit
Free with trial This image features a line art vector illustration that represents the concept of tax reduction. It showcases a man talking within a speech bubble, highlighting the ideas of financial advice, savings, and budget planning. The minimalist design effectively communicates a discussion about decreasing costs and government strategy in the economy. Created with AI, this informative graphic portrays a simplistic yet engaging approach to fiscal themes. Illustration business decrease vectors Tax Reduction Concept with Speech Bubble Line Art Vector Illustration. This image features a line art vector illustration that represents the concept of tax reduction. It showcases a man talking within a speech bubble, highlighting the ideas of financial advice, savings, and budget planning. The minimalist design effectively communicates a discussion about decreasing costs and government strategy in the economy. Created with AI, this informative graphic portrays a simplistic yet engaging approach to fiscal themes.
Free with trial A simple graphic representing a downward trend in business or finance. Shows a bar chart with decreasing heights and a clear arrow indicating a fall. Perfect for representing loss or decline. Illustration business decrease vectors Down trend bar chart arrow icon business finance drop. A simple graphic representing a downward trend in business or finance. Shows a bar chart with decreasing heights and a clear arrow indicating a fall. Perfect for representing loss or decline.
Free with trial A flat style pie chart displays market shares in teal, green, and yellow, with a dollar coin icon representing financial data. Illustration business decrease vectors Flat design pie chart illustration representing business finance and market share analysis. A flat style pie chart displays market shares in teal, green, and yellow, with a dollar coin icon representing financial data.
Free with trial This image represents a stock market crash with falling red arrows, symbolizing financial crisis, recession, investment loss, and business decline. It conveys a sense of economic downturn. Illustration business decrease illustrations Stock market crash falling red arrow financial crisis recession investment loss business decline economy down. This image represents a stock market crash with falling red arrows, symbolizing financial crisis, recession, investment loss, and business decline. It conveys a sense of economic downturn.
Free with trial A colorful, hand-drawn illustration depicting a large percentage symbol surrounded by various financial and statistical icons. This doodle-style artwork includes bar graphs, pie charts, stacks of coins, dollar signs, and arrows indicating growth and decline. The sketch effectively visualizes concepts like interest rates, economic trends, business analytics, investment returns, and market data. Isolated on a white background, this versatile image is perfect for presentations, infographics, financial reports, and educational materials related to business, finance, and statistics. Illustration business decrease illustrations Hand Drawn Finance and Percentage Concept Illustration. A colorful, hand-drawn illustration depicting a large percentage symbol surrounded by various financial and statistical icons. This doodle-style artwork includes bar graphs, pie charts, stacks of coins, dollar signs, and arrows indicating growth and decline. The sketch effectively visualizes concepts like interest rates, economic trends, business analytics, investment returns, and market data. Isolated on a white background, this versatile image is perfect for presentations, infographics, financial reports, and educational materials related to business, finance, and statistics.
Free with trial This vector illustration features a comprehensive set of modern infographic and decision-making elements, isolated on a clean white background with subtle reflections. The collection includes stylized casino chips marked "YES" and "NO" for choices, various bar charts depicting growth and data, and segmented donut pie charts representing proportions. An abstract 3D shape adds a contemporary touch. Ideal for presentations, business reports, websites, and applications requiring visual representation of data, statistics, polls, and strategic decisions in a clean, professional design. Illustration business decrease vectors Business Infographics and Decision Making Elements Set. This vector illustration features a comprehensive set of modern infographic and decision-making elements, isolated on a clean white background with subtle reflections. The collection includes stylized casino chips marked "YES" and "NO" for choices, various bar charts depicting growth and data, and segmented donut pie charts representing proportions. An abstract 3D shape adds a contemporary touch. Ideal for presentations, business reports, websites, and applications requiring visual representation of data, statistics, polls, and strategic decisions in a clean, professional design.
Free with trial Simple Bar Chart Showing Business Growth and Data Trends. Illustration business decrease vectors Simple Bar Chart Showing Business Growth and Data Trends
Free with trial Turquoise diamond with descending red arrow illustration. Illustration business decrease vectors Turquoise diamond with descending red arrow illustration
Free with trial Declining Bar Chart with Downward Trend Arrow Illustration. Illustration business decrease vectors Declining Bar Chart with Downward Trend Arrow Illustration
Free with trial Simple line art business icons set featuring a magnifying glass, minus symbol, pie chart, and rising bar graph for financial data analysis. Illustration business decrease illustrations Simple line art business icons set featuring a magnifying glass, minus symbol, pie chart, and rising bar graph for
Free with trial A businessman showcases a glowing graphic signifying the relationship between rising quality and decreasing cost, emphasizing the importance of strategic management in business. Qubit. Illustration business decrease illustrations Businessman presenting a graphic illustration of quality rising and cost decreasing, symbolizing effective management. A businessman showcases a glowing graphic signifying the relationship between rising quality and decreasing cost, emphasizing the importance of strategic management in business. Qubit
Free with trial Modern, minimalistic chart icon for business and finance. Illustration business decrease vectors Modern, minimalistic chart icon for business and finance
Free with trial Visualizing india's economic downturn with a stock market crash chart. the red arrow indicates a financial crisis, recession, and potential business losses, highlighting investment risks. Illustration business decrease illustrations India economic crisis stock market crash recession financial downfall business loss investment risk chart graph. visualizing india's economic downturn with a stock market crash chart. the red arrow indicates a financial crisis, recession, and potential business losses, highlighting investment risks.
Free with trial Trend icon. Zigzag arrow in circle vector illustration. Market chart symbol with upward or downward direction sign. Finance data UI sign. Business growth pictogram. Illustration business decrease vectors Trend icon. Zigzag arrow in circle vector illustration. Market chart symbol with upward or downward direction sign. Finance data
Free with trial Illustration of an angry boy holding a graph showing declining performance, representing business failure and loss. The image conveys frustration and disappointment with negative financial results and market downturns. Illustration business decrease vectors Angry Boy with Falling Graph Business Failure, Loss Concept. Illustration of an angry boy holding a graph showing declining performance, representing business failure and loss. The image conveys frustration and disappointment with negative financial results and market downturns.
Free with trial Steeply falling graph dark background dramatic drop illustration trend drop Vector illustration for high-quality printing. Illustration business decrease illustrations Steeply falling graph, dark background, dramatic drop, illustration, trend, drop. Steeply falling graph dark background dramatic drop illustration trend drop Vector illustration for high-quality printing
Free with trial A vector illustration depicting a red downward trending line graph with a coin falling below it. The word FAILURE is prominently displayed alongside the graph. The color palette is primarily red and maroon against a light gray background. The style is simple and minimalist, suitable for presentations or reports related to financial loss or business failure. The image conveys a sense of decline and. Illustration business decrease illustrations Red Downward Trend Graph Coin Failure Vector Illustration. A vector illustration depicting a red downward trending line graph with a coin falling below it. The word FAILURE is prominently displayed alongside the graph. The color palette is primarily red and maroon against a light gray background. The style is simple and minimalist, suitable for presentations or reports related to financial loss or business failure. The image conveys a sense of decline and
Free with trial Business and financial crisis vector concept with businessman floating on water. Symbol of market crash, recession, risk, bankruptcy and loss. Eps10 illustration. Illustration business decrease vectors Business and financial crisis vector concept with businessman floating on water. Symbol of market crash, recession, risk
Free with trial Statistical bar chart icon with upward and downward curved arrows. Business trend performance symbol illustration. Illustration business decrease vectors Statistical bar chart icon with upward and downward curved arrows. Business trend performance symbol