Free with trial A businessman presents a tablet with glowing arrows symbolizing the interplay of quality improvement and cost reduction, showcasing concepts of business optimization and success. Qubit. Illustration business decrease illustrations Businessman Holding Tablet with Neon Arrows Indicating Quality Increase and Cost Decrease, Concept of Optimizing. A businessman presents a tablet with glowing arrows symbolizing the interplay of quality improvement and cost reduction, showcasing concepts of business optimization and success. Qubit
Free with trial Downward arrow, segmented pie chart, and analog clock suggest concepts of time management, data analysis, and decline. Ideal for productivity, efficiency, business, strategy evaluation finance. Illustration business decrease vectors Downward Arrow, Pie Chart, and Clock Representing Time, Decline, and Data Analysis Concept. Downward arrow, segmented pie chart, and analog clock suggest concepts of time management, data analysis, and decline. Ideal for productivity, efficiency, business, strategy evaluation finance
Free with trial Falling arrow on Euro textured sales graphic. 3D illustration. Illustration business decrease illustrations Falling arrow on Euro textured sales graphic. 3D illustration
Free with trial Pink Searching for food in trash can on streets outdoors icon isolated on pink background. Homelessness and poverty concept. Minimalism concept. 3D render illustration. Illustration business decrease illustrations Pink Searching for food in trash can on streets outdoors icon isolated on pink background. Homelessness and poverty
Free with trial This image features three bold, three-dimensional arrows pointing sharply downward, each rendered in distinct vibrant colors�'blue, yellow, and red�'symbolizing a significant market downturn, financial loss, or economic decline, set against a clean, minimalist white background that enhances their striking visual impact and conveys urgency and negative momentum in business, trading, or investment. Illustration business decrease illustrations Colorful downward trending financial arrows in blue yellow and red illustrating market decline and economic downturn concepts. This image features three bold, three-dimensional arrows pointing sharply downward, each rendered in distinct vibrant colors�'blue, yellow, and red�'symbolizing a significant market downturn, financial loss, or economic decline, set against a clean, minimalist white background that enhances their striking visual impact and conveys urgency and negative momentum in business, trading, or investment
Free with trial 3d illustration of red decreasing graph on stand, financial presentation representing negative results or economic downturn. Illustration business decrease vectors 3d illustration of red decreasing graph on stand, financial presentation representing negative results
Free with trial Set Pie chart infographic, Dollar rate decrease, Shutdown of factory and Glass money jar with coin icon. Vector. Illustration business decrease illustrations Set Pie chart infographic, Dollar rate decrease, Shutdown of factory and Glass money jar with coin icon. Vector
Free with trial This vector illustration set features six distinct icons representing key financial and economic concepts. It includes bar charts depicting growth with a green arrow and decline with a red arrow, alongside currency exchange rate indicators for USD, INR, and EUR. Two donut charts visualize data distribution, while a world map colored green and red signifies global market trends or segmentation. Ideal for business presentations, financial reports, economic analysis, and investment-related content, these versatile graphics convey complex data clearly and concisely. Illustration business decrease vectors Financial Growth, Decline, and Global Market Data Visualization Icons Set. This vector illustration set features six distinct icons representing key financial and economic concepts. It includes bar charts depicting growth with a green arrow and decline with a red arrow, alongside currency exchange rate indicators for USD, INR, and EUR. Two donut charts visualize data distribution, while a world map colored green and red signifies global market trends or segmentation. Ideal for business presentations, financial reports, economic analysis, and investment-related content, these versatile graphics convey complex data clearly and concisely.
Free with trial Cost optimization concept. Man with huge pencil near calculator and graphs, diagrams and charts. Financial literacy and management of expenses. Price reduction. Flat vector illustration. Illustration business decrease vectors Cost optimization concept. Man with huge pencil near calculator and graphs, diagrams and charts. Financial literacy and management
Free with trial Basic charts line icon set. Bar diagram, pie and histogram graph. Data visualization, growth and distribution analysis for business and finance. Vector illustration Editable Stroke. Illustration business decrease illustrations Basic charts line icon set. Bar diagram, pie and histogram graph. Data visualization, growth and distribution analysis
Free with trial Neutral face symbol with downward arrow signifying decrease or decline, positioned above a cloud icon. Ideal for concepts thumbs up emotion, productivity, transition, feedback, mental state, change. Illustration business decrease vectors Neutral expression face with downward arrow and cloud representing mood or emotional shift. Neutral face symbol with downward arrow signifying decrease or decline, positioned above a cloud icon. Ideal for concepts thumbs up emotion, productivity, transition, feedback, mental state, change
Free with trial A modern vector illustration of a line graph showing a clear decline, emphasized by a red downtrend arrow. Ideal for financial reports, business presentations, or data visualization projects illustrating negative trends or decreases. This graphic effectively communicates a downward movement in statistics, vector design Generative AI. Illustration business decrease vectors Declining Line Graph with Red Downtrend Arrow, vector design Generative AI. A modern vector illustration of a line graph showing a clear decline, emphasized by a red downtrend arrow. Ideal for financial reports, business presentations, or data visualization projects illustrating negative trends or decreases. This graphic effectively communicates a downward movement in statistics, vector design Generative AI
Free with trial Blue bar chart with decreasing values beside a soft cloud shape and horizontal lines. Ideal for data analytics, cloud computing, business growth, technology, forecasts, trends, and innovation. Simple. Illustration business decrease illustrations Minimalist Bar Chart with Cloud Element Representing Data Analysis and Cloud Computing Concepts. Blue bar chart with decreasing values beside a soft cloud shape and horizontal lines. Ideal for data analytics, cloud computing, business growth, technology, forecasts, trends, and innovation. Simple
Free with trial Set line Casino chip with dollar Coin money win Automated teller machine and chips slot clover Financial growth decrease and Stacks paper cash icon. Vector. Illustration business decrease illustrations Set line Casino chip with dollar, Coin money, win, Automated teller machine and, chips, slot clover, Financial growth. Set line Casino chip with dollar Coin money win Automated teller machine and chips slot clover Financial growth decrease and Stacks paper cash icon. Vector.
Free with trial This image is a solid style icon representing a price reduction. It features a dollar sign inside of a downward pointing arrow, symbolizing a decrease in price. Illustration business decrease vectors Simple Solid Style Price Reduction Icon with Dollar Sign and Downward Arrow. This image is a solid style icon representing a price reduction. It features a dollar sign inside of a downward pointing arrow, symbolizing a decrease in price.
Free with trial Downward blue arrow pointing to dollar coin descending beside soft cloud shape. Ideal for finance, economic loss, market decline, decrease, failure, risk, digital economy. Clean flat simple metaphor. Illustration business decrease vectors Downward Trend in Financial Value with Dollar Symbol and Cloud Motif. Downward blue arrow pointing to dollar coin descending beside soft cloud shape. Ideal for finance, economic loss, market decline, decrease, failure, risk, digital economy. Clean flat simple metaphor
Free with trial Female figure holding a clipboard next to a bold downward arrow and Euro coin representation. Ideal for business, economy, finance, monetary policy, market trends, economic decline, simple flat. Illustration business decrease vectors Female professional with clipboard standing beside downward arrow and Euro currency circle. Female figure holding a clipboard next to a bold downward arrow and Euro coin representation. Ideal for business, economy, finance, monetary policy, market trends, economic decline, simple flat
Free with trial Blue sad face next to a declining line graph in a calendar frame under a cloud. Ideal for business loss, economic crisis, emotional impact, failure, disappointment, analytics, trends. Simple flat. Illustration business decrease vectors Sad face and declining data chart representing failure, downturn, or negative outcome concept. Blue sad face next to a declining line graph in a calendar frame under a cloud. Ideal for business loss, economic crisis, emotional impact, failure, disappointment, analytics, trends. Simple flat
Free with trial Set Server Magnifying glass with check mark Digital speed meter Online play video Browser setting window Financial growth decrease and incognito icon. Vector. Illustration business decrease vectors Set Server, Magnifying glass with check mark, Digital speed meter, Online play video, Browser setting, window, Financial. Set Server Magnifying glass with check mark Digital speed meter Online play video Browser setting window Financial growth decrease and incognito icon. Vector.
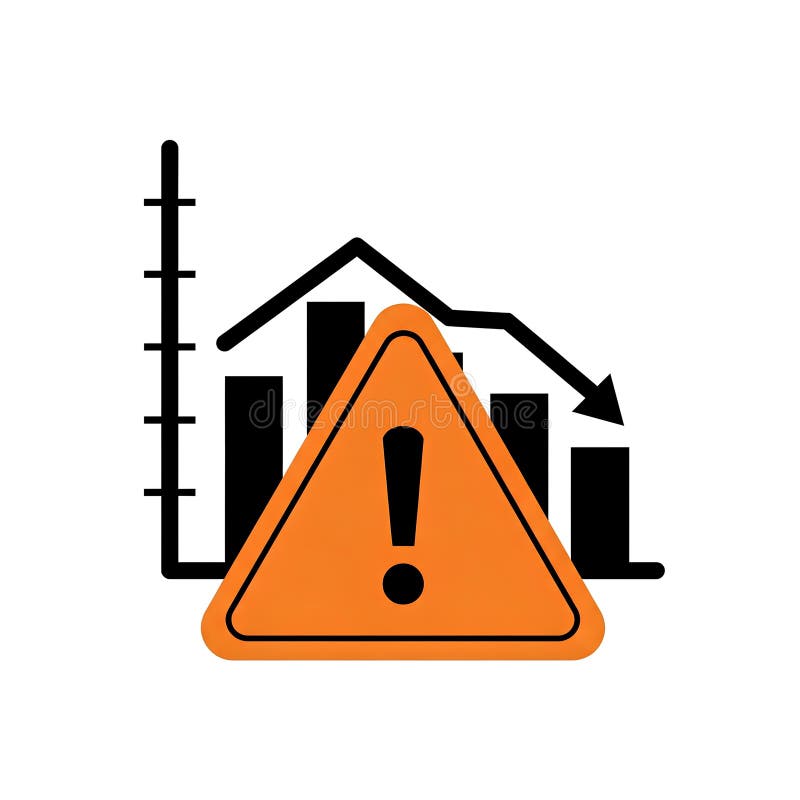
Free with trial Illustration of a downward trending graph with an orange warning sign in the foreground. The graph depicts a decline in performance or value. The warning sign highlights potential risks or negative outcomes. This image can be used to represent financial loss, economic downturn, business failure, or any situation where caution is advised. Illustration business decrease illustrations Warning Sign with Declining Graph. Illustration of a downward trending graph with an orange warning sign in the foreground. The graph depicts a decline in performance or value. The warning sign highlights potential risks or negative outcomes. This image can be used to represent financial loss, economic downturn, business failure, or any situation where caution is advised.
Free with trial Downward arrow, financial document, and money bag with dollar sign highlighting economic loss, cost reduction. Ideal for finance, budgeting, online payment, bankruptcy, savings accounting crisis. Illustration business decrease vectors Declining Revenue Illustration with Financial Document and Money Bag. Downward arrow, financial document, and money bag with dollar sign highlighting economic loss, cost reduction. Ideal for finance, budgeting, online payment, bankruptcy, savings accounting crisis
Free with trial Flat vector illustration of a dollar sign in a blue circle between orange and blue arrows pointing up and down. Conceptual icon for currency exchange, stock market volatility, and financial profit. Illustration business decrease vectors Flat vector illustration of a dollar sign in a blue circle between orange and blue arrows pointing up and down. Conceptual icon
Free with trial Up and down sign with green and black arrows in flat style showing movement direction and sales change. Vector illustration of a sales bar chart icon used as an elevator symbol or universal pictogram. Illustration business decrease vectors Up and down sign with green and black arrows in flat style showing movement direction
Free with trial Abstract blue up and down arrow icons illustration set minimalist molecular grid design isolated on white background for technology business growth data analysis and finance ui ux. Illustration business decrease vectors Abstract blue up and down arrow icons illustration set minimalist molecular grid design isolated on white background for. Technology business growth data. Abstract blue up and down arrow icons illustration set minimalist molecular grid design isolated on white background for technology business growth data analysis and finance ui ux
Free with trial A conceptual illustration of market analysis featuring a bar chart, magnifying glass, upward and downward arrows, and business icons on white. Illustration business decrease illustrations Market Analysis Concept with Bar Chart Magnifying Glass and Upward Arrow graph. A conceptual illustration of market analysis featuring a bar chart, magnifying glass, upward and downward arrows, and business icons on white
Free with trial Hand drawn arrow black mark set. Isolated Hand-drawn arrows icons on white background. Different pointer collection. Simple drawing arrow pen. Vector illustration. Illustration business decrease vectors Colection of black hand drawn arrow signs. Vector illustration. Hand drawn arrow black mark set. Isolated Hand-drawn arrows icons on white background. Different pointer collection. Simple drawing arrow pen. Vector illustration.
Free with trial Man examines with magnifying glass, coins signifying finance, gear and downward arrow symbolizing process decline. Ideal for business, analysis, economy, process, research, strategy simple flat. Illustration business decrease vectors Businessman Holding Magnifying Glass, Coins, and Gear with Downward Arrow. Man examines with magnifying glass, coins signifying finance, gear and downward arrow symbolizing process decline. Ideal for business, analysis, economy, process, research, strategy simple flat
Free with trial Downward arrow next to a dollar coin and landscape image highlights financial decline, cost reduction, pricing strategy, budget management. Ideal for economics, business, finance, investment. Illustration business decrease vectors Downward arrow with dollar coin and landscape image indicating cost reduction and investment strategy. Downward arrow next to a dollar coin and landscape image highlights financial decline, cost reduction, pricing strategy, budget management. Ideal for economics, business, finance, investment
Free with trial This vector illustration shows a set of black graph icons with rising and falling charts indicated by arrows showing trends in data with clear simple design and sharp edges calm. Generative AI. Illustration business decrease vectors Black graph icons set rising and falling charts with arrows vector illustration simple design. This vector illustration shows a set of black graph icons with rising and falling charts indicated by arrows showing trends in data with clear simple design and sharp edges calm. Generative AI
Free with trial Magnifying glass highlights poor analytics on chart, signed document, and sad emotion. Ideal for business, analytics, decline, review, research productivity failure. Simple flat metaphor. Illustration business decrease illustrations Analysis of Declining Trends with Signed Document and Performance Chart. Magnifying glass highlights poor analytics on chart, signed document, and sad emotion. Ideal for business, analytics, decline, review, research productivity failure. Simple flat metaphor
Free with trial Stacked brown boxes beside upward and downward arrows with a bar chart. Ideal for logistics, supply chain, e-commerce, shipping, inventory, warehouse, and business growth. Simple flat metaphor. Illustration business decrease vectors Shipment Tracking and Inventory Management with Stacked Boxes and Growth Chart. Stacked brown boxes beside upward and downward arrows with a bar chart. Ideal for logistics, supply chain, e-commerce, shipping, inventory, warehouse, and business growth. Simple flat metaphor
Free with trial Blue footprint with CO2, downward arrow indicating reduction, black cloud outline. Ideal for climate change, sustainability, eco-business, environment awareness, carbon emissions, green energy. Illustration business decrease illustrations Reducing Carbon Footprint with Lower Emissions and Cleaner Clouds for Sustainable Climate Action. Blue footprint with CO2, downward arrow indicating reduction, black cloud outline. Ideal for climate change, sustainability, eco-business, environment awareness, carbon emissions, green energy
Free with trial Money Transfer Icons Set, Currency Exchange Logo, Crypto Financial Services. Vector illustration. Illustration business decrease vectors Money Transfer Icons Set, Currency Exchange Logo, Crypto Financial Services. Vector
Free with trial Declining arrow and money bag visualizing economic loss, business downturn, or budget deficit. Ideal for financial issues, stock market analysis, recession trends, wealth management, business risks. Illustration business decrease vectors Downward Trend Arrow and Money Bag with Dollar Sign Representing Financial Loss or Economic Decline. Declining arrow and money bag visualizing economic loss, business downturn, or budget deficit. Ideal for financial issues, stock market analysis, recession trends, wealth management, business risks
Free with trial Gear beside a chart showing a declining line and sad face emphasizes failure, setback, frustration. Ideal for business analytics, challenges, productivity, negativity, technology, performance drop. Illustration business decrease illustrations Declining Performance Representation with Sad Face and Falling Graph Line. Gear beside a chart showing a declining line and sad face emphasizes failure, setback, frustration. Ideal for business analytics, challenges, productivity, negativity, technology, performance drop
Free with trial Illustration showing financial data analysis with charts, idea lightbulb, and location pins, perfect for finance and business concepts. Illustration business decrease illustrations Analyzing Financial Data and Performance Charts Illustration. Illustration showing financial data analysis with charts, idea lightbulb, and location pins, perfect for finance and business concepts
Free with trial Declining graph indicating financial loss, sad face representing disappointment, coin symbolizing money, and cloud metaphor for challenges. Ideal for finance, business troubles, economic downturn. Illustration business decrease vectors Financial Loss Concept with Declining Graph, Sad Face, Coin and Cloud Symbol. Declining graph indicating financial loss, sad face representing disappointment, coin symbolizing money, and cloud metaphor for challenges. Ideal for finance, business troubles, economic downturn
Free with trial Line graph with plotted data points, bar chart, and triangular warning alert. Ideal for analytics, business, risk management, financial trends, forecasting, reporting performance tracking simple. Illustration business decrease vectors Data Analysis with Line Graph, Bar Chart, and Warning Sign for Risk Monitoring. Line graph with plotted data points, bar chart, and triangular warning alert. Ideal for analytics, business, risk management, financial trends, forecasting, reporting performance tracking simple
Free with trial Illustration shows a stressed businessman with falling arrows and a sad face beside coins and a happy businessman with rising arrows and graphs. Positive financial mood. Generative AI. Illustration business decrease vectors Businessman stressed and happy financial growth comparison vector illustration with coins and charts. Illustration shows a stressed businessman with falling arrows and a sad face beside coins and a happy businessman with rising arrows and graphs. Positive financial mood. Generative AI
Free with trial A surreal conceptual illustration depicting a house with a red roof floating amidst soft pink clouds. Numerous pink arrows rain down from the sky, pointing downwards to symbolize a decline. This powerful visual metaphor represents the real estate market crash, falling property prices, the bursting of the housing bubble, and economic recession. The dreamlike, unstable setting is ideal for topics on financial risk, mortgage crisis, investment depreciation, and the volatility of the property market. A creative 3D render for business and finance concepts. Illustration business decrease illustrations Real Estate Market Crash and Falling Property Prices Concept. A surreal conceptual illustration depicting a house with a red roof floating amidst soft pink clouds. Numerous pink arrows rain down from the sky, pointing downwards to symbolize a decline. This powerful visual metaphor represents the real estate market crash, falling property prices, the bursting of the housing bubble, and economic recession. The dreamlike, unstable setting is ideal for topics on financial risk, mortgage crisis, investment depreciation, and the volatility of the property market. A creative 3D render for business and finance concepts.
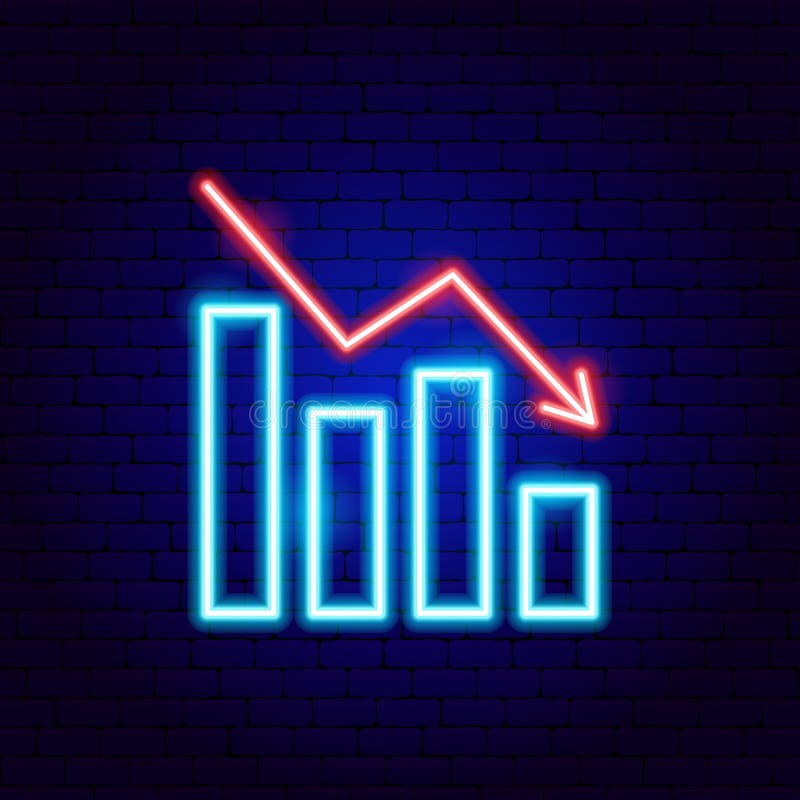
Free with trial A neon sign shaped like a downward trending graph is mounted on a tile wall in a dark tunnel, symbolizing financial loss or market crash for business illustration. Illustration business decrease illustrations Downward Trend Neon Sign in Dark Tunnel. A neon sign shaped like a downward trending graph is mounted on a tile wall in a dark tunnel, symbolizing financial loss or market crash for business illustration
Free with trial Up and Down sign with golden arrows isolated on a black, vector illustration. Concept of sales bar chart symbol icon with arrow moving down and sales bar chart with gold arrows moving up and down. Illustration business decrease vectors Up and Down sign with golden arrows isolated on a black, vector illustration. Concept of sales bar chart symbol
Free with trial A flat design illustration of two bar charts, one green and one red, both showing a downward trend with arrows, representing financial or business decline. Illustration business decrease illustrations Bar chart showing declining trend isolated on white background. A flat design illustration of two bar charts, one green and one red, both showing a downward trend with arrows, representing financial or business decline
Free with trial Financial crisis concept, losses, falling stock prices. Red Japanese candlestick chart and down arrow, and piggy bank losing money due to falling quotes. Flat vector cartoon illustration. Illustration business decrease vectors Financial crisis concept, losses, falling stock prices. Red Japanese candlestick chart and down arrow, and piggy bank
Free with trial A clean and modern digital illustration of a financial candlestick chart, displaying market trends and stock performance. The graph features blue candlesticks indicating price movements over time, accompanied by a solid blue line graph and subtle dashed trend lines. Set against a crisp white background with a clear grid, this visualization is ideal for illustrating concepts related to finance, investment, business analytics, economic forecasts, and data reporting. It conveys growth, volatility, and strategic decision-making in the stock market. Illustration business decrease illustrations Financial Candlestick Chart with Trend Line on White Background. A clean and modern digital illustration of a financial candlestick chart, displaying market trends and stock performance. The graph features blue candlesticks indicating price movements over time, accompanied by a solid blue line graph and subtle dashed trend lines. Set against a crisp white background with a clear grid, this visualization is ideal for illustrating concepts related to finance, investment, business analytics, economic forecasts, and data reporting. It conveys growth, volatility, and strategic decision-making in the stock market.
Free with trial Hand pouring water from blue watering can as drops fall towards coin and downward arrow labeled SALE. Ideal for investment, finance tips, sales strategies, growth, marketing, business decline, simple. Illustration business decrease vectors Hand pouring water from watering can onto coin with downward arrow labeled SALE. Hand pouring water from blue watering can as drops fall towards coin and downward arrow labeled SALE. Ideal for investment, finance tips, sales strategies, growth, marketing, business decline, simple
Free with trial Financial crisis concept. Decreasing graph with falling columns. Vector illustration showing recession, bankruptcy, and economic decline. Illustration business decrease vectors Financial crisis concept. Decreasing graph with falling columns. Vector illustration showing recession, bankruptcy
Free with trial Downward arrow pointing alongside a falling dollar coin with a cloud above. Ideal for finance, economics, loss, investment, risk, business, savings, simple flat metaphor. Illustration business decrease vectors Downward Arrow and Dollar Coin Representing Financial Decline or Economic Loss. Downward arrow pointing alongside a falling dollar coin with a cloud above. Ideal for finance, economics, loss, investment, risk, business, savings, simple flat metaphor
Free with trial Planner studying graphs of development planning vector illustration. Company business and management strategy colourful picture in cartoon style, isolated. Illustration business decrease illustrations Manager studying graphs of development plan. Planner studying graphs of development planning vector illustration. Company business and management strategy colourful picture in cartoon style, isolated
Free with trial Economic crisis banner website icon vector illustration concept with icons of market crash, economic bubble, bank run, inflation, pandemic, currency fall, unemployment, recession. Illustration business decrease vectors Economic crisis banner website icon vector illustration concept with icons of market crash
Free with trial The image shows a line graph illustrating the decline of carbon emissions. there are two lines on the graph, a green line and a grey line, both trending downwards. the green line, representing "carbon inteetiual emissions," shows a steeper decline compared to the grey line. the graph is set against a grid background, providing a visual reference for the rate of decrease in emissions over time. the downward trend suggests a positive change in reducing carbon output. Illustration business decrease illustrations Carbon emissions decline graph illustration. the image shows a line graph illustrating the decline of carbon emissions. there are two lines on the graph, a green line and a grey line, both trending downwards. the green line, representing "carbon inteetiual emissions," shows a steeper decline compared to the grey line. the graph is set against a grid background, providing a visual reference for the rate of decrease in emissions over time. the downward trend suggests a positive change in reducing carbon output.
Free with trial Shopping cart with a downward arrow, bar graph indicating loss, and sad face illustrating declining sales or performance. Ideal for business, ecommerce, market decline, economic loss, analytics. Illustration business decrease vectors Declining Sales Concept with Shopping Cart, Downward Arrow, Bar Graph, and Sad Face. Shopping cart with a downward arrow, bar graph indicating loss, and sad face illustrating declining sales or performance. Ideal for business, ecommerce, market decline, economic loss, analytics
Free with trial Loss Graph Neon Sign. Vector Illustration of Analytics Data Symbol. Illustration business decrease vectors Loss Graph Neon Sign
Free with trial Blue downward arrow, injured thumbs-up hand, and calculator icon highlight financial setback, risk management, medical expenses, cost analysis. Ideal for business, healthcare, budgeting. Illustration business decrease vectors Financial Loss Concept with Downward Arrow, Bandaged Thumbs-Up, and Calculator Symbol. Blue downward arrow, injured thumbs-up hand, and calculator icon highlight financial setback, risk management, medical expenses, cost analysis. Ideal for business, healthcare, budgeting
Free with trial Red sad face beside a line graph showing a downward trend and a bar graph. Ideal for business loss, economic decline, performance issues, challenges, setbacks, analytics, trends. Simple flat metaphor. Illustration business decrease vectors Declining Chart with Sad Face and Bar Graph Representing Negative Trend and Challenges. Red sad face beside a line graph showing a downward trend and a bar graph. Ideal for business loss, economic decline, performance issues, challenges, setbacks, analytics, trends. Simple flat metaphor
Free with trial Outline financial tax icons set featuring a book, magnifying glass, money, documents, and charts for financial accounting and business concept design. Illustration business decrease vectors Outline financial tax icons set featuring a book, magnifying glass, money, documents, and charts for financial
Free with trial Sad face symbolizing dissatisfaction or issues, with data point focus and declining performance graph. Ideal for business analytics, performance drops, feedback, emotions, troubleshooting, reporting. Illustration business decrease illustrations Sad face with declining graph and focus on data highlighting underperformance and issues. Sad face symbolizing dissatisfaction or issues, with data point focus and declining performance graph. Ideal for business analytics, performance drops, feedback, emotions, troubleshooting, reporting
Free with trial Blue sad face next to dollar symbol with an arrow pointing forward, symbolizing financial loss, economic downturn, challenges, budgeting issues, income concerns, business decline. Ideal for economic. Illustration business decrease vectors Sad Face and Dollar Sign with Arrow Indicating Financial Loss or Unhappiness About Money. Blue sad face next to dollar symbol with an arrow pointing forward, symbolizing financial loss, economic downturn, challenges, budgeting issues, income concerns, business decline. Ideal for economic
Free with trial A 3D render shows a vibrant, pastel-colored bar chart displaying a decreasing trend with blue, yellow, and lavender bars on a transparent background. Illustration business decrease vectors Downward trendy pastel bar chart illustration on transparent background. A 3D render shows a vibrant, pastel-colored bar chart displaying a decreasing trend with blue, yellow, and lavender bars on a transparent background.
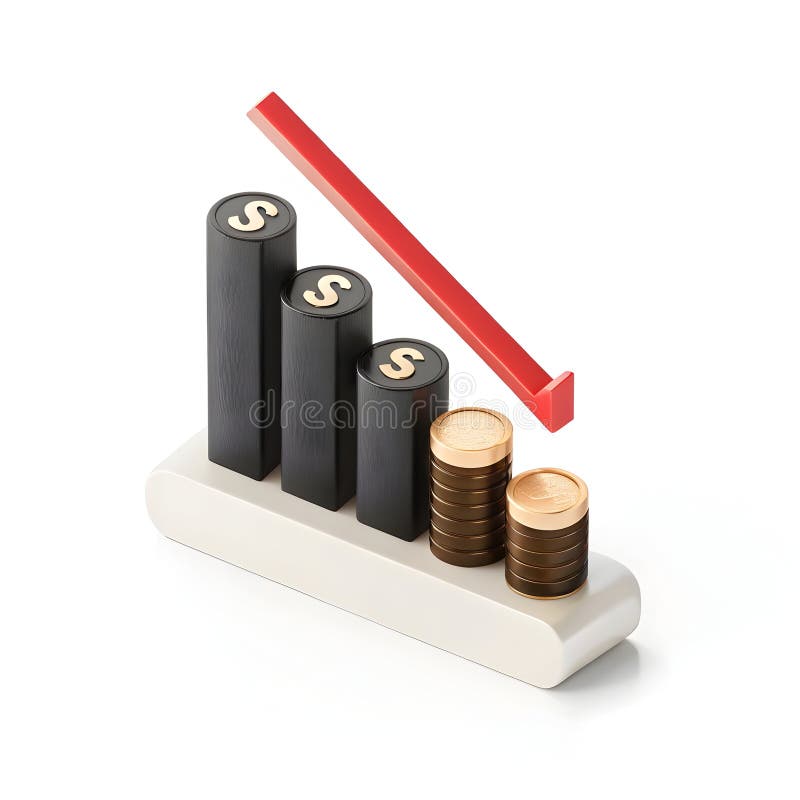
Free with trial A 3D illustration depicts a financial graph with a downward trend. Three black bars, each topped with a gold dollar sign, decrease in height from left to right. To the right of the bars, two stacks of gold coins are shown, also decreasing in height. A thick red arrow points downwards, crossing over the bars and coins, indicating a decline. The entire composition rests on a white base and is set. Illustration business decrease illustrations Falling financial graph with stacked coins finance. A 3D illustration depicts a financial graph with a downward trend. Three black bars, each topped with a gold dollar sign, decrease in height from left to right. To the right of the bars, two stacks of gold coins are shown, also decreasing in height. A thick red arrow points downwards, crossing over the bars and coins, indicating a decline. The entire composition rests on a white base and is set
Free with trial Women in technology concept. Analyzing cryptocurrency trends and market data. Collaboration in digital finance research. Vector illustration. Illustration business decrease vectors Women In Technology. Flat Vector. Women in technology concept. Analyzing cryptocurrency trends and market data. Collaboration in digital finance research. Vector illustration.
Free with trial Bar graph with declining values, percentage on black square, globe in blue square. Ideal for data, statistics, global business, market trends, finance, analysis research flat simple metaphor. Illustration business decrease vectors Bar chart with decreasing bars alongside percentage and globe icons for data and global analytics. Bar graph with declining values, percentage on black square, globe in blue square. Ideal for data, statistics, global business, market trends, finance, analysis research flat simple metaphor
Free with trial This image shows two bar graphs. One shows an upward trend with an arrow pointing up. The other shows a downward trend with an arrow pointing down. Black and white. Illustration business decrease illustrations Black and white illustration showing upward and downward trending bar graphs with arrows pointing up down. This image shows two bar graphs. One shows an upward trend with an arrow pointing up. The other shows a downward trend with an arrow pointing down. Black and white.
Free with trial A high-tech illustration of a glowing blue -2% percentage symbol displayed in a sleek, modern office environment. Surrounded by digital data icons and futuristic charts, this image is perfect for representing concepts like small financial losses, minor discounts, data drops, business trends, or analytical reports. Ideal for presentations, websites, digital marketing, or economic graphics. Illustration business decrease illustrations Glowing -2% Discount Graphic in Modern Office Environment. A high-tech illustration of a glowing blue -2% percentage symbol displayed in a sleek, modern office environment. Surrounded by digital data icons and futuristic charts, this image is perfect for representing concepts like small financial losses, minor discounts, data drops, business trends, or analytical reports. Ideal for presentations, websites, digital marketing, or economic graphics.
Free with trial Downward trend graph with large sad face and woman in casual attire. Ideal for business performance, feedback, failure, regret, decisions, emotions, analytics. Clean simple flat metaphor. Illustration business decrease vectors Declining Trend Graph with Sad Face and Casual Woman Highlighting Failure or Negative Feedback. Downward trend graph with large sad face and woman in casual attire. Ideal for business performance, feedback, failure, regret, decisions, emotions, analytics. Clean simple flat metaphor
Free with trial The image features a black icon of currency, displaying a dollar symbol with a downward-pointing arrow, suggesting a decrease in value. This conceptual image evokes themes of loss and depreciation on a plain white background. Illustration business decrease vectors Decreasing Value: Icon Depicting a Dollar with Downward Arrow on White Background. The image features a black icon of currency, displaying a dollar symbol with a downward-pointing arrow, suggesting a decrease in value. This conceptual image evokes themes of loss and depreciation on a plain white background.
Free with trial A bright and bold 3D rendering of a 25% discount icon. It features yellow numbers and a green percentage sign. Illustration business decrease vectors Twenty-Five Percent Discount Symbol in 3D Illustration on transparent background. A bright and bold 3D rendering of a 25% discount icon. It features yellow numbers and a green percentage sign.
Free with trial Five colorful bars, resembling a chart, visually represent a downward trend. The bars are yellow, green, blue and purple. Illustration business decrease vectors Colorful bar chart illustration showing declining trend on transparent background. Five colorful bars, resembling a chart, visually represent a downward trend. The bars are yellow, green, blue and purple.
Free with trial Blue upward bar graph with arrow and falling coin near a sad face. Ideal for finance, economy, investment risks, financial loss, market analysis, emotional impact, business strategies. Simple flat. Illustration business decrease vectors Financial growth with unhappy outcome reflected by increasing bar chart, falling coin, and sad face. Blue upward bar graph with arrow and falling coin near a sad face. Ideal for finance, economy, investment risks, financial loss, market analysis, emotional impact, business strategies. Simple flat
Free with trial Outline financial tax icons set featuring a book, magnifying glass, money, documents, and charts for financial accounting and business concept design. Illustration business decrease illustrations Outline financial tax icons set featuring a book, magnifying glass, money, documents, and charts for financial
Free with trial A high-quality 3D conceptual illustration of sharp metallic scissors actively cutting a green dollar banknote in half. Set against a clean white background, this image serves as a powerful metaphor for monetary policy actions such as currency redenomination, sanering, inflation control, and the reduction of purchasing power. Ideal for financial news, economic editorial content, and articles discussing devalued currency, government fiscal reform, or budget cuts. Illustration business decrease illustrations Scissors Cutting Dollar Banknote Concept for Redenomination and Currency Sanering. A high-quality 3D conceptual illustration of sharp metallic scissors actively cutting a green dollar banknote in half. Set against a clean white background, this image serves as a powerful metaphor for monetary policy actions such as currency redenomination, sanering, inflation control, and the reduction of purchasing power. Ideal for financial news, economic editorial content, and articles discussing devalued currency, government fiscal reform, or budget cuts.
Free with trial A high-quality 3D conceptual illustration of sharp metallic scissors actively cutting a green dollar banknote in half. Set against a clean white background, this image serves as a powerful metaphor for monetary policy actions such as currency redenomination, sanering, inflation control, and the reduction of purchasing power. Ideal for financial news, economic editorial content, and articles discussing devalued currency, government fiscal reform, or budget cuts. Illustration business decrease illustrations Scissors Cutting Dollar Banknote Concept for Redenomination and Currency Sanering. A high-quality 3D conceptual illustration of sharp metallic scissors actively cutting a green dollar banknote in half. Set against a clean white background, this image serves as a powerful metaphor for monetary policy actions such as currency redenomination, sanering, inflation control, and the reduction of purchasing power. Ideal for financial news, economic editorial content, and articles discussing devalued currency, government fiscal reform, or budget cuts.
Free with trial A high-quality 3D conceptual illustration of sharp metallic scissors actively cutting a green dollar banknote in half. Set against a clean white background, this image serves as a powerful metaphor for monetary policy actions such as currency redenomination, sanering, inflation control, and the reduction of purchasing power. Ideal for financial news, economic editorial content, and articles discussing devalued currency, government fiscal reform, or budget cuts. Illustration business decrease illustrations Scissors Cutting Dollar Banknote Concept for Redenomination and Currency Sanering. A high-quality 3D conceptual illustration of sharp metallic scissors actively cutting a green dollar banknote in half. Set against a clean white background, this image serves as a powerful metaphor for monetary policy actions such as currency redenomination, sanering, inflation control, and the reduction of purchasing power. Ideal for financial news, economic editorial content, and articles discussing devalued currency, government fiscal reform, or budget cuts.
Free with trial 3D render showcasing descending statistical bar graph. The bars are colored differently: purple, blue, and yellow. This graphic represents statistical data trend decreasing. Illustration business decrease vectors Colorful statistical bar graph rendering showing decrease on transparent background. 3D render showcasing descending statistical bar graph. The bars are colored differently: purple, blue, and yellow. This graphic represents statistical data trend decreasing.
Free with trial Bitcoin failing graph crypto currency. Coin B symbol finance economy banking system. Blockchain extra crash with lightning negative forecast for decline in value vector illustration. Illustration business decrease vectors Bitcoin failing graph crypto currency. Coin B symbol finance economy banking system. Blockchain extra crash with
Free with trial 3D illustration of a red bar chart with a downward arrow, isolated on a transparent background. Symbolizes financial loss, economic crisis, revenue drop, or business decline. Ideal for presentations, finance reports, investment warnings, stock market analysis, and economic downturn visuals. Illustration business decrease illustrations 3D Red Downward Arrow Graph Icon Showing Financial Decline on Transparent Background. 3D illustration of a red bar chart with a downward arrow, isolated on a transparent background. Symbolizes financial loss, economic crisis, revenue drop, or business decline. Ideal for presentations, finance reports, investment warnings, stock market analysis, and economic downturn visuals.
Free with trial Visualize investment loss with this 3D rendering. A downward-pointing red arrow plunges towards scattered coins on a smartphone screen, symbolizing financial decline. Ideal for illustrating market downturns, recession risks, and online banking losses. Use this image for business, finance, or technology content. The purple pastel background adds a modern touch to this digital illustration of a. Illustration business decrease illustrations Investment loss concept with down arrow and coins on smartphone. Visualize investment loss with this 3D rendering. A downward-pointing red arrow plunges towards scattered coins on a smartphone screen, symbolizing financial decline. Ideal for illustrating market downturns, recession risks, and online banking losses. Use this image for business, finance, or technology content. The purple pastel background adds a modern touch to this digital illustration of a
Free with trial A flat, cartoon-style line graph on a white grid background shows a green upward-pointing arrow representing growth and a red downward-pointing arrow indicating decline, with a red dollar sign placed atop the green arrow to symbolize financial gain, illustrating contrasting economic trends in a simplified, visually engaging manner ideal for business, finance, and investment-related content that. Illustration business decrease illustrations Upward and downward financial trend with green and red arrows on grid graph. A flat, cartoon-style line graph on a white grid background shows a green upward-pointing arrow representing growth and a red downward-pointing arrow indicating decline, with a red dollar sign placed atop the green arrow to symbolize financial gain, illustrating contrasting economic trends in a simplified, visually engaging manner ideal for business, finance, and investment-related content that
Free with trial A striking 3D rendering depicts a bold red downward trend arrow overlaid on a subtle grid, immediately conveying a sense of decline and loss. Set against a pristine white background, the graphic powerfully symbolizes financial instability, market downturns, and the potential for recession. This illustration is ideal for conveying concepts of investment risk, negative business trends, and economic. Illustration business decrease illustrations Red downward trend arrow and grid symbolizing decline or recession on white background. A striking 3D rendering depicts a bold red downward trend arrow overlaid on a subtle grid, immediately conveying a sense of decline and loss. Set against a pristine white background, the graphic powerfully symbolizes financial instability, market downturns, and the potential for recession. This illustration is ideal for conveying concepts of investment risk, negative business trends, and economic