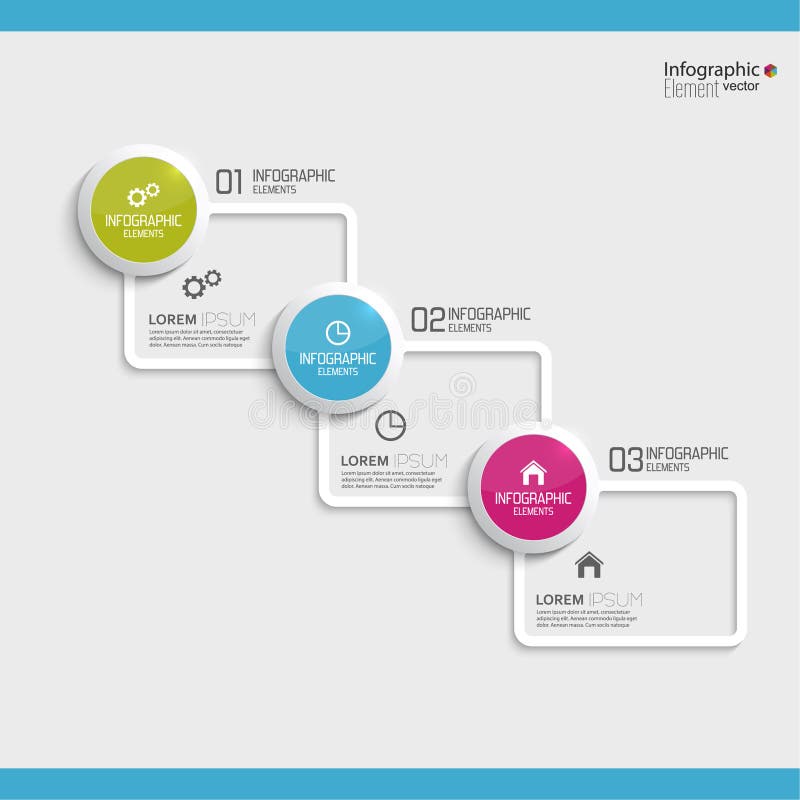
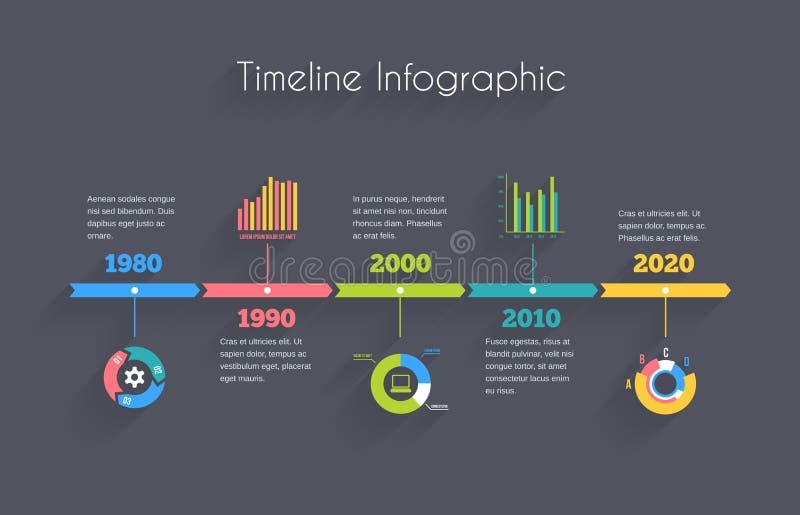
Free with trial Vector Timeline Infographic template with charts and text. Informative representation vectors Timeline Infographic template
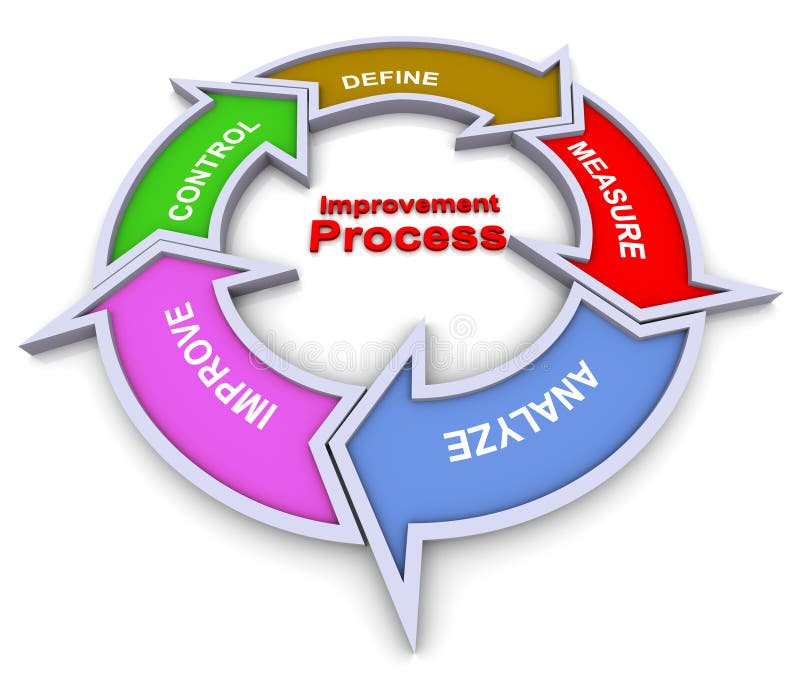
Free with trial 3d colorful flow chart diagram of improvement process. Informative representation illustrations Improvement process flowchart. 3d colorful flow chart diagram of improvement process
Free with trial Signs with different kind of meteorologic symbols. Informative representation vectors Meteorologic symbols
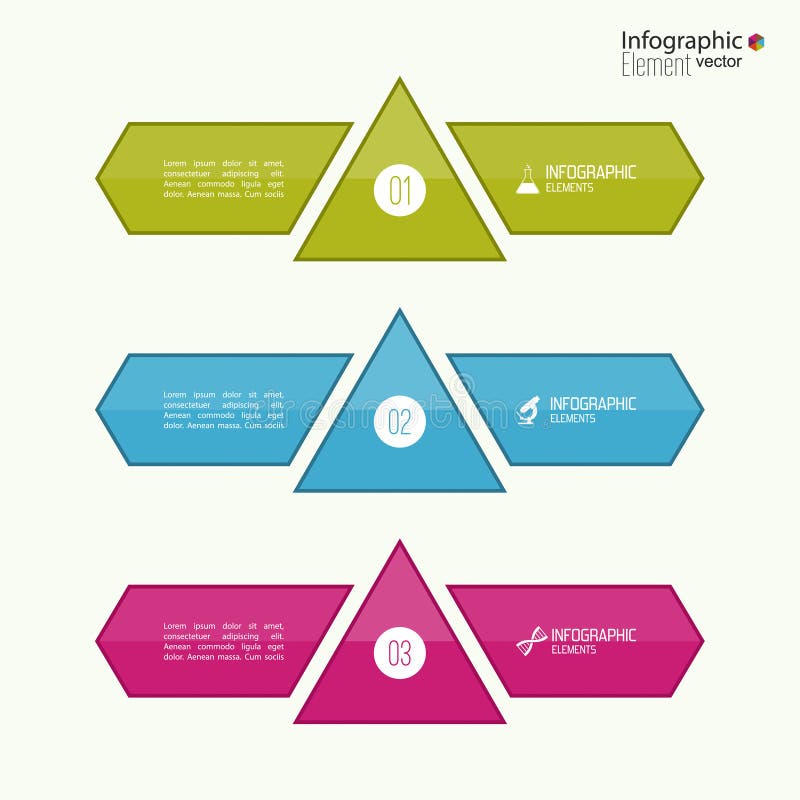
Free with trial Comparative chart with templates for presentation, informative. Option. Medical. Infographic for annual report, infochart, advertising, web button, explanation. Process step by step. analyze. Informative representation vectors Comparative chart with templates for presentation
Free with trial Comparative chart with templates for presentation, informative forms. Option. Infographic for the annual report, statistics, infochart, advertising, web button, explanation. Process step by step. analyze. Informative representation vectors Comparative chart with templates for presentation
Free with trial This image shows the carbon element from the periodic table. It includes its atomic number, symbol, and atomic weight. It is a clear and informative representation. Informative representation vectors Illustration of the carbon element, showcasing its atomic number, symbol, and atomic weight in a periodic table format. This image shows the carbon element from the periodic table. It includes its atomic number, symbol, and atomic weight. It is a clear and informative representation
Free with trial Visual representation of financial data showcased on screen graph, illuminating economic metrics Vertical Mobile Wallpaper. Informative representation illustrations Visual representation of financial data showcased on screen graph, illuminating economic metrics
Free with trial Visual representation of financial data showcased on screen graph, illuminating economic metrics Vertical Mobile Wallpaper. Informative representation illustrations Visual representation of financial data showcased on screen graph, illuminating economic metrics
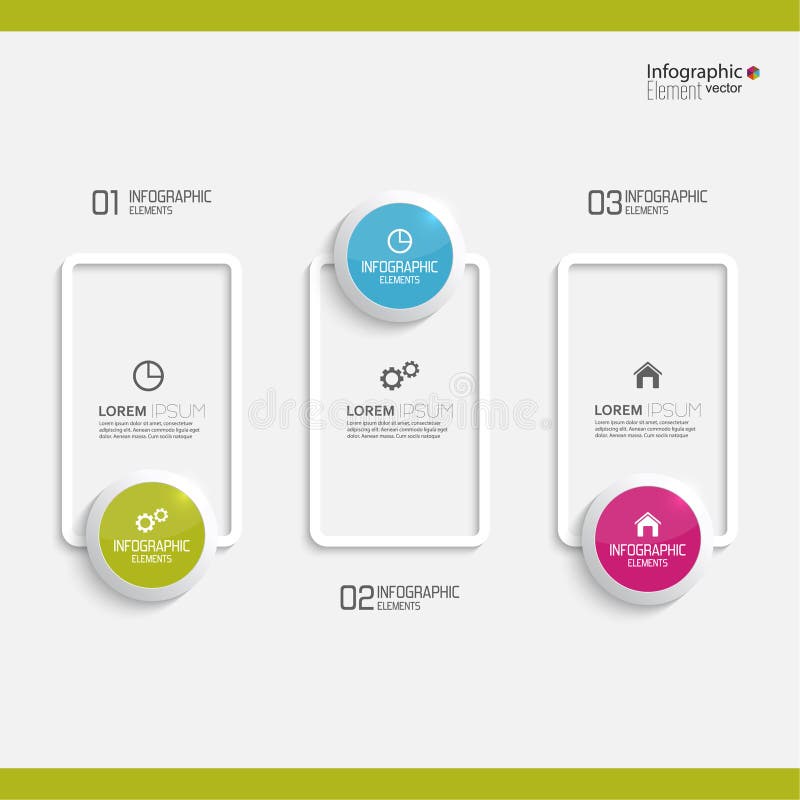
Free with trial Comparative chart with banner for presentation, informative forms. Option. Infographic for annual report, statistics, infochart, advertising, web button, explanation. Process step by step. analyze. Informative representation vectors Comparative chart with templates for presentation. Comparative chart with banner for presentation, informative forms. Option. Infographic for annual report, statistics, infochart, advertising, web button, explanation. Process step by step. analyze
Free with trial Comparative chart with templates for presentation, informative forms. Option. Infographic for annual report, statistics, infochart, advertising, web button, explanation. Process step by step. analyze. Informative representation vectors Comparative chart with templates for presentation
Free with trial Comparative chart with templates for presentation, informative forms. Option. Infographic for annual report, statistics, infochart, advertising, web button, explanation. Process step by step. analyze. Informative representation vectors Comparative chart with templates for presentation
Free with trial Comparative chart with templates for presentation, informative forms. Option. Infographic for the annual report, statistics, infochart, advertising, web button, explanation. Process step by step. analyze. Informative representation vectors Comparative chart with templates for presentation
Free with trial Comparative chart with banner for presentation, informative forms. Option. Infographic for annual report, statistics, infochart, advertising, web button, explanation. Process step by step. analyze. Informative representation vectors Comparative chart with templates for presentation. Comparative chart with banner for presentation, informative forms. Option. Infographic for annual report, statistics, infochart, advertising, web button, explanation. Process step by step. analyze
Free with trial Comparative chart with banner for presentation, informative forms. Option. Infographic for annual report, statistics, infochart, advertising, web button, explanation. Process step by step. analyze. Informative representation vectors Comparative chart with templates for presentation. Comparative chart with banner for presentation, informative forms. Option. Infographic for annual report, statistics, infochart, advertising, web button, explanation. Process step by step. analyze
Free with trial Comparative chart with banner for presentation, informative forms. Option. Infographic for annual report, statistics, infochart, advertising, web button, explanation. Process step by step. analyze. Informative representation vectors Comparative chart with templates for presentation. Comparative chart with banner for presentation, informative forms. Option. Infographic for annual report, statistics, infochart, advertising, web button, explanation. Process step by step. analyze
Free with trial Comparative chart with templates for presentation, informative forms. Option. Infographic for annual report, statistics, infochart, advertising, web banner, explanation. Process step by step. analyze. Informative representation vectors Comparative chart with templates for presentation
Free with trial Comparative chart with templates for presentation, informative forms. Option. Infographic for annual report, statistics, infochart, advertising, web banner, explanation. Process step by step. analyze. Informative representation vectors Comparative chart with templates for presentation
Free with trial Comparative chart with banner for presentation, informative forms. Option. Infographic for annual report, statistics, infochart, advertising, web button, explanation. Process step by step. analyze. Informative representation vectors Comparative chart with templates for presentation. Comparative chart with banner for presentation, informative forms. Option. Infographic for annual report, statistics, infochart, advertising, web button, explanation. Process step by step. analyze
Free with trial Comparative chart with banner for presentation, informative forms. Option. Infographic for annual report, statistics, infochart, advertising, web button, explanation. Process step by step. analyze. Informative representation vectors Comparative chart with templates for presentation. Comparative chart with banner for presentation, informative forms. Option. Infographic for annual report, statistics, infochart, advertising, web button, explanation. Process step by step. analyze
Free with trial Comparative chart with banner for presentation, informative forms. Option. Infographic for annual report, statistics, infochart, advertising, web button, explanation. Process step by step. analyze. Informative representation vectors Comparative chart with templates for presentation. Comparative chart with banner for presentation, informative forms. Option. Infographic for annual report, statistics, infochart, advertising, web button, explanation. Process step by step. analyze
Free with trial Comparative chart with templates for presentation, informative forms. Option. Infographic for annual report, statistics, infochart, advertising, web button, explanation. Process step by step. analyze. Informative representation vectors Comparative chart with templates for presentation
Free with trial Detailed artistic representation of Bigfoot anatomy, showcasing three stages of evolution in a conceptual diagram. Perfect for cryptozoology enthusiasts and scientific illustration lovers. Generative AI Image. Informative representation illustrations Conceptual Diagram of Bigfoot Anatomy in Scientific Sketch. Detailed artistic representation of Bigfoot anatomy, showcasing three stages of evolution in a conceptual diagram. Perfect for cryptozoology enthusiasts and scientific illustration lovers. Generative AI Image.
Free with trial Comparative chart with templates for presentation, informative forms. Option. Infographic for annual report, statistics, infochart, advertising, web button, explanation. Process step by step. analyze. algorithm. Informative representation vectors Comparative chart with templates for presentation
Free with trial A vivid illustration of the human heart and circulatory system, showcasing arteries and veins in an artistic representation. The glowing colors emphasize the intricate cardiovascular network, creating a visually captivating depiction of human anatomy. Informative representation illustrations Anatomical illustration of a heart and blood vessels, glowing in vibrant colors, highlighting the cardiovascular system. A vivid illustration of the human heart and circulatory system, showcasing arteries and veins in an artistic representation. The glowing colors emphasize the intricate cardiovascular network, creating a visually captivating depiction of human anatomy.
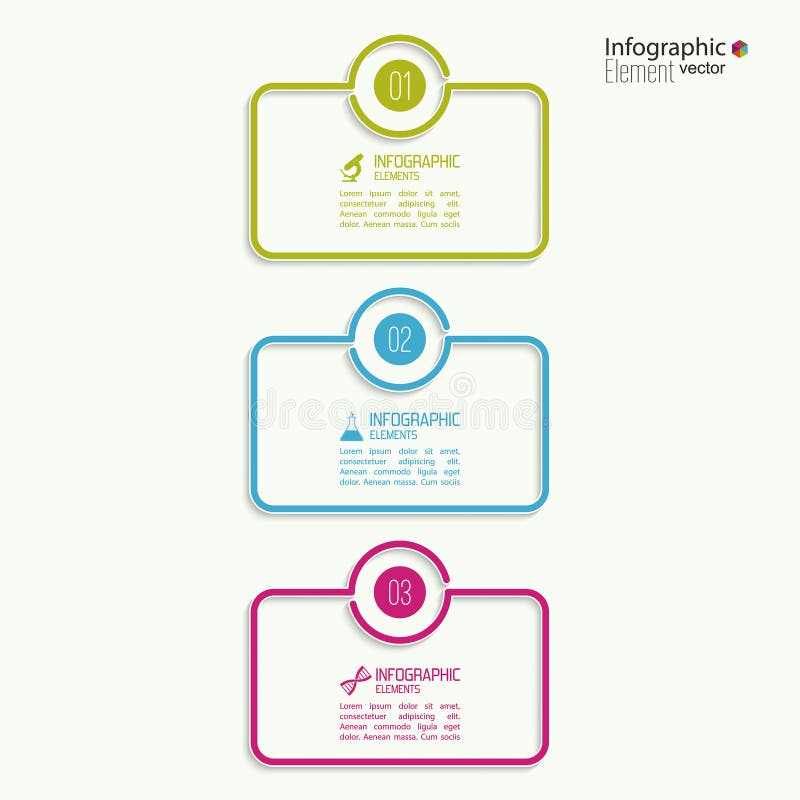
Free with trial Vector timeline infographics, elements and icons in vintage style, design template. Informative representation vectors Timeline infographics
Free with trial Signs with different kind of meteorologic symbols. Informative representation vectors Meteorologic symbols
Free with trial This image showcases a vertical color chart with seven blocks representing the spectrum colors: violet, indigo, blue, green, yellow, orange, and red. Each block is labeled with its respective color name on the right. The chart is set against a light background with a green border. Informative representation illustrations Rainbow Spectrum Color Guide: Violet, Indigo, Blue, Green, Yellow, Orange, Red. This image showcases a vertical color chart with seven blocks representing the spectrum colors: violet, indigo, blue, green, yellow, orange, and red. Each block is labeled with its respective color name on the right. The chart is set against a light background with a green border.
Free with trial This image showcases vertical stripes in the seven spectrum colors: violet, indigo, blue, green, yellow, orange, and red. Each stripe is equally spaced and vivid, creating a striking rainbow pattern. The design is simple yet vibrant, emphasizing the full spectrum of colors. Informative representation illustrations Vertical Striped Pattern with Rainbow Spectrum Colors: Violet, Indigo, Blue, Green, Yellow, Orange, Red. This image showcases vertical stripes in the seven spectrum colors: violet, indigo, blue, green, yellow, orange, and red. Each stripe is equally spaced and vivid, creating a striking rainbow pattern. The design is simple yet vibrant, emphasizing the full spectrum of colors.
Free with trial Set of vector icons with oil production, processing, refining, transportation of oil. Flat design. Informative representation vectors Oil infographic. Set of vector icons with oil production, processing, refining, transportation of oil. Flat design
Free with trial This detailed illustration represents human kidneys, showcasing intricate anatomy and structure. Perfect for educational and healthcare use, it highlights kidney function and design. Informative representation illustrations Human Kidney Anatomy in Detailed Illustration. This detailed illustration represents human kidneys, showcasing intricate anatomy and structure. Perfect for educational and healthcare use, it highlights kidney function and design
Free with trial This educational diagram highlights the major blood vessels in the body, including arteries, veins, and capillaries. Each vessel is clearly labeled, with arrows showing the flow of blood. A color-coded system distinguishes between oxygenated and deoxygenated blood pathways for easy understanding. Informative representation illustrations Anatomical Diagram of Major Blood Vessels. This educational diagram highlights the major blood vessels in the body, including arteries, veins, and capillaries. Each vessel is clearly labeled, with arrows showing the flow of blood. A color-coded system distinguishes between oxygenated and deoxygenated blood pathways for easy understanding
Free with trial Business Flat Icon. Vector Pictogram. EPS 10. Informative representation vectors Business Flat Icon
Free with trial This anatomically accurate illustration showcases the human heart, the vital organ that powers the body's cardiovascular system. Depicted in vivid red against a serene, azure-hued backdrop, the heart's intricate structure and pulsing motion are on full display. The heart's role in maintaining overall health and well-being is undeniable. This detailed visual representation underscores the heart's importance, inviting viewers to appreciate the remarkable complexity and significance of this crucial organ. Whether used in medical, health or scientific materials, this illustration provides an engaging, informative look at the human heart. The illustration is created using AI. Informative representation illustrations Anatomically Accurate Human Heart in Hands. This anatomically accurate illustration showcases the human heart, the vital organ that powers the body's cardiovascular system. Depicted in vivid red against a serene, azure-hued backdrop, the heart's intricate structure and pulsing motion are on full display. The heart's role in maintaining overall health and well-being is undeniable. This detailed visual representation underscores the heart's importance, inviting viewers to appreciate the remarkable complexity and significance of this crucial organ. Whether used in medical, health or scientific materials, this illustration provides an engaging, informative look at the human heart. The illustration is created using AI.
Free with trial Illustration electrical conductivity concept. Two light bulbs demonstrate insulators vs conductors. One glowing with bright sparks, dim. Clear representation for educational commercial. Informative representation illustrations Illustration electrical conductivity concept. Two light bulbs demonstrate insulators vs conductors. One glowing with bright
Free with trial Vector Timeline Infographic template with charts and text. Informative representation vectors Timeline Infographic template
Free with trial Oxygen element symbol. O chemical element. Orange glossy spheres. Chemistry concept. Vector illustration. EPS 10. Informative representation vectors Oxygen element symbol. O chemical element. Orange glossy spheres. Chemistry concept. Vector illustration.
Free with trial Electronic gadgets vector. A vector representation of Monitor, Laptop, Tablet , Cellphone. Informative representation vectors Electronic gadgets
Free with trial Collection of colourful infographics on white. Vector poster of round diagrams with percentages and column charts in flat style. Business informative schemes of development with percents and text. Informative representation vectors Collection of Infographics Colourful on White. Collection of colourful infographics on white. Vector poster of round diagrams with percentages and column charts in flat style. Business informative schemes of development with percents and text
Free with trial Team members discuss performance metrics and review growth trends at their workplace, Employees review growth charts using flat illustrations. Informative representation vectors Team members discuss performance metrics and review growth trends at their workplace, Employees review growth charts using flat
Free with trial Lithium element symbol. Pink glossy spheres. Chemistry concept. Vector illustration. Scientific graphic. EPS 10. Informative representation vectors Lithium element symbol. Pink glossy spheres. Chemistry concept. Vector illustration. Scientific graphic.
Free with trial Detailed 3D anatomical model of human lungs, showcasing the intricate branching of bronchi and pulmonary vessels. The image presents a clear and realistic representation of the lung structure, ideal for educational purposes, medical illustrations, or scientific publications. The soft, pastel color palette and well-defined details create a visually appealing and informative image. Informative representation illustrations 3D Human Lungs Anatomy. Detailed 3D anatomical model of human lungs, showcasing the intricate branching of bronchi and pulmonary vessels. The image presents a clear and realistic representation of the lung structure, ideal for educational purposes, medical illustrations, or scientific publications. The soft, pastel color palette and well-defined details create a visually appealing and informative image.
Free with trial ISO 7010 registered safety signs are internationally recognized graphical symbols used to convey prohibitive instructions in various settings. These pictograms employ universally understood imagery to effectively communicate hazards, restrictions, or actions to be avoided. They adhere to ISO standards, ensuring consistency and clarity across different environments and cultures. These signs play a crucial role in enhancing safety by alerting individuals to potential dangers and guiding behavior accordingly, ultimately reducing the risk of accidents and injuries. Informative representation vectors ISO 7010 registered safety signs graphical symbols pictogram prohibition No jumping into water. ISO 7010 registered safety signs are internationally recognized graphical symbols used to convey prohibitive instructions in various settings. These pictograms employ universally understood imagery to effectively communicate hazards, restrictions, or actions to be avoided. They adhere to ISO standards, ensuring consistency and clarity across different environments and cultures. These signs play a crucial role in enhancing safety by alerting individuals to potential dangers and guiding behavior accordingly, ultimately reducing the risk of accidents and injuries.
Free with trial This clean, high-resolution vector graphic features a modern world map with clearly labeled country names. The minimalist design incorporates distinct borders and a neutral color scheme, making it easy to read and highly functional. Perfect for educational content, business presentations, and travel planning, this map serves as a reliable resource for understanding global geography while maintaining an aesthetically pleasing appearance. Its versatility makes it an excellent choice for anyone in need of a contemporary and professional mapping solution. Informative representation illustrations Modern world map with clear country labels and borders. This clean, high-resolution vector graphic features a modern world map with clearly labeled country names. The minimalist design incorporates distinct borders and a neutral color scheme, making it easy to read and highly functional. Perfect for educational content, business presentations, and travel planning, this map serves as a reliable resource for understanding global geography while maintaining an aesthetically pleasing appearance. Its versatility makes it an excellent choice for anyone in need of a contemporary and professional mapping solution.
Free with trial Microscopic illustration of six different genetic skin disorders. Each cube-shaped illustration shows a cross-section of skin with various colors and textures indicating abnormalities. The illustrations use a pixel art style on a dark background, providing a clear, detailed view of the cellular structures affected by each disorder. The images. Informative representation illustrations Six Pixel Art Illustrations Depicting Genetic Skin Disorders. Microscopic illustration of six different genetic skin disorders. Each cube-shaped illustration shows a cross-section of skin with various colors and textures indicating abnormalities. The illustrations use a pixel art style on a dark background, providing a clear, detailed view of the cellular structures affected by each disorder. The images
Free with trial Detailed illustration of neurodegeneration, showcasing a neuron with damaged synapses and surrounding glial cells. The image also features a cross-section of the human brain highlighting the affected areas. The color palette uses dark blue, red, and various pastel shades to represent different components. The style is scientific and. Informative representation illustrations Neurodegeneration: Neuron Damage and Brain Cross Section Illustration. Detailed illustration of neurodegeneration, showcasing a neuron with damaged synapses and surrounding glial cells. The image also features a cross-section of the human brain highlighting the affected areas. The color palette uses dark blue, red, and various pastel shades to represent different components. The style is scientific and
Free with trial This clean, high-resolution vector graphic features a modern world map with clearly labeled country names. The minimalist design incorporates distinct borders and a neutral color scheme, making it easy to read and highly functional. Perfect for educational content, business presentations, and travel planning, this map serves as a reliable resource for understanding global geography while maintaining an aesthetically pleasing appearance. Its versatility makes it an excellent choice for anyone in need of a contemporary and professional mapping solution. Informative representation illustrations Clean vector graphic of a minimalist world map. This clean, high-resolution vector graphic features a modern world map with clearly labeled country names. The minimalist design incorporates distinct borders and a neutral color scheme, making it easy to read and highly functional. Perfect for educational content, business presentations, and travel planning, this map serves as a reliable resource for understanding global geography while maintaining an aesthetically pleasing appearance. Its versatility makes it an excellent choice for anyone in need of a contemporary and professional mapping solution.
Free with trial This clean, high-resolution vector graphic features a modern world map with clearly labeled country names. The minimalist design incorporates distinct borders and a neutral color scheme, making it easy to read and highly functional. Perfect for educational content, business presentations, and travel planning, this map serves as a reliable resource for understanding global geography while maintaining an aesthetically pleasing appearance. Its versatility makes it an excellent choice for anyone in need of a contemporary and professional mapping solution. Informative representation illustrations Easy-to-read vector map perfect for presentations. This clean, high-resolution vector graphic features a modern world map with clearly labeled country names. The minimalist design incorporates distinct borders and a neutral color scheme, making it easy to read and highly functional. Perfect for educational content, business presentations, and travel planning, this map serves as a reliable resource for understanding global geography while maintaining an aesthetically pleasing appearance. Its versatility makes it an excellent choice for anyone in need of a contemporary and professional mapping solution.
Free with trial The words Impact Report are prominently featured, sitting on a textured surface, emphasizing the significance of the content. The background is minimal, drawing focus to the typography. Informative representation illustrations Impact report text visually displayed with a simple background highlighting importance. The words Impact Report are prominently featured, sitting on a textured surface, emphasizing the significance of the content. The background is minimal, drawing focus to the typography
Free with trial Concept Of Illustration depicting diabetic neuropathy with glowing red nerve lines radiating from affected feet against a dark gradient. Informative representation illustrations Illustration depicting diabetic neuropathy with glowing red nerve lines radiating from affected feet against a dark gradient
Free with trial Cartoon-style illustration of a Uterus with attached ovaries, drawn in pink and yellow tones, isolated on a clean white background. Vector hand drawn cartoon kawaii character illustration icon. Informative representation vectors Illustration of a Uterus with ovaries in cartoon style on white background. Cartoon-style illustration of a Uterus with attached ovaries, drawn in pink and yellow tones, isolated on a clean white background. Vector hand drawn cartoon kawaii character illustration icon
Free with trial Illustration showing various parts of the philodendron plant in detailed arrangement. Informative representation illustrations Illustration showing various parts of the philodendron plant in detailed arrangement
Free with trial A digital illustration of the female reproductive system, highlighting the uterus and ovaries. The image contrasts vibrant red and blue colors, suggesting medical or anatomical significance. The background features an X-ray view of the lower abdomen, providing a detailed look at the biological structures. Informative representation illustrations Anatomical illustration of the female reproductive system with vibrant blue and red lighting. A digital illustration of the female reproductive system, highlighting the uterus and ovaries. The image contrasts vibrant red and blue colors, suggesting medical or anatomical significance. The background features an X-ray view of the lower abdomen, providing a detailed look at the biological structures.
Free with trial This captivating 3D medical illustration showcases a low-poly, wireframe representation of a knee joint. The futuristic aesthetic, combined with the detailed anatomical structure, creates a visually striking and informative piece. The dark blue background enhances the digital art, drawing attention to the complex interplay of bones, ligaments, and cartilage within the knee. The polygonal mesh. Informative representation illustrations Futuristic LowPoly 3D Knee Joint Wireframe Medical Illustration for Anatomy Biomechanics and Orthopedic Research. This captivating 3D medical illustration showcases a low-poly, wireframe representation of a knee joint. The futuristic aesthetic, combined with the detailed anatomical structure, creates a visually striking and informative piece. The dark blue background enhances the digital art, drawing attention to the complex interplay of bones, ligaments, and cartilage within the knee. The polygonal mesh
Free with trial A silhouette of the USA map captures the immense size and geographical diversity of the United States of America in a visually captivating and informative form. This minimalist representation showcases the iconic outlines of the USA's borders, symbolizing the nation's unity and the rich tapestry of cultures and landscapes that define it. Against a contrasting backdrop, the dark silhouette of the USA map highlights the distinct shapes of the contiguous states, as well as the outlines of Alaska and Hawaii. In this artistic portrayal, the silhouette USA map evokes a sense of pride and identity, reminding us of the country's historical journey, from its founding to becoming a melting pot of cultures and a land of opportunity. Beyond its geographical representation, the silhouette USA map also symbolizes the nation's historical landmarks, from the bustling cities of New York and Los Angeles to the majestic beauty of national parks like Yellowstone and the Grand Canyon. These evocative images serve as a reminder of the unique fabric of American life, from its diverse people to its iconic symbols and landmarks. Overall, the silhouette USA map captures the essence of the nation's vastness, diversity, and the American spirit. It stands as a symbol of the country's enduring legacy, inspiring unity and a sense of belonging among its citizens, and representing the pursuit of freedom, opportunity, and the American dream. Informative representation vectors Layered USA map silhouette vector art. A silhouette of the USA map captures the immense size and geographical diversity of the United States of America in a visually captivating and informative form. This minimalist representation showcases the iconic outlines of the USA's borders, symbolizing the nation's unity and the rich tapestry of cultures and landscapes that define it.Against a contrasting backdrop, the dark silhouette of the USA map highlights the distinct shapes of the contiguous states, as well as the outlines of Alaska and Hawaii.In this artistic portrayal, the silhouette USA map evokes a sense of pride and identity, reminding us of the country's historical journey, from its founding to becoming a melting pot of cultures and a land of opportunity.Beyond its geographical representation, the silhouette USA map also symbolizes the nation's historical landmarks, from the bustling cities of New York and Los Angeles to the majestic beauty of national parks like Yellowstone and the Grand Canyon.These evocative images serve as a reminder of the unique fabric of American life, from its diverse people to its iconic symbols and landmarks.Overall, the silhouette USA map captures the essence of the nation's vastness, diversity, and the American spirit. It stands as a symbol of the country's enduring legacy, inspiring unity and a sense of belonging among its citizens, and representing the pursuit of freedom, opportunity, and the American dream.
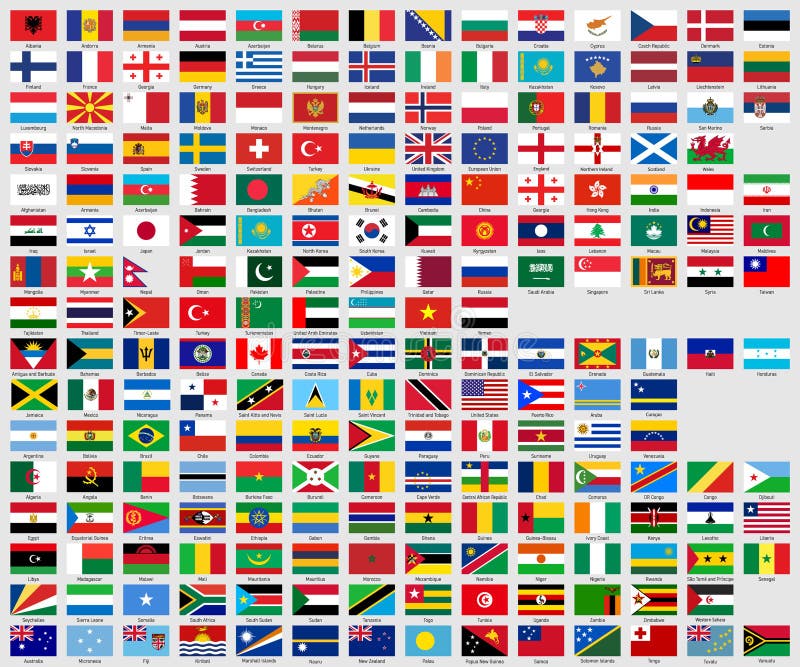
Free with trial Collection of world flags, each labeled with its respective country name. Sort by continents. Informative representation vectors World Flags Collection with Country Names Displayed. collection of world flags, each labeled with its respective country name. Sort by continents
Free with trial Business sketch: An informative representation of business elements and concepts, focusing on professionalism image. Informative representation illustrations Business sketch: An informative representation of business elements and concepts, focusing on professionalism.
Free with trial A comprehensive vector illustration of a vintage globe, featuring historical maps and an antique representation of the world. Ideal for educational content, historical archives, or exploration themes. High-quality, detailed, and informative. vector design Generative AI. Informative representation vectors Vintage globe illustration, historical map, antique world representation vector design Generative AI. A comprehensive vector illustration of a vintage globe, featuring historical maps and an antique representation of the world. Ideal for educational content, historical archives, or exploration themes. High-quality, detailed, and informative. vector design Generative AI
Free with trial A dynamic vector illustration of an ascending bar chart, symbolizing growth, progress, and statistical data. Perfect for business reports, financial analysis, educational content, or marketing presentations. Its clear visual representation effectively conveys positive trends and numerical increases, making it highly informative, vector design Generative AI. Informative representation vectors Ascending Bar Chart, Growth, Progress, and Statistical Data Representation vector design Generative AI. A dynamic vector illustration of an ascending bar chart, symbolizing growth, progress, and statistical data. Perfect for business reports, financial analysis, educational content, or marketing presentations. Its clear visual representation effectively conveys positive trends and numerical increases, making it highly informative, vector design Generative AI
Free with trial Understanding the concept of duties and responsibilities in the workplace through colorful and informative visual representation. Informative representation vectors Understanding the concept of duties and responsibilities in the workplace through colorful and informative visual representation
Free with trial Celebrate World Thyroid Day with this informative graphic. A pink ribbon and anatomical thyroid representation are presented on a white background, emphasizing awareness for thyroid health. Perfect for medical publications, infographics, posters, and educational materials promoting prevention and healthcare on May 25. This vector illustration embodies health, wellbeing, and support. Informative representation vectors World thyroid day awareness concept with pink ribbon and anatomical representation on white background. Celebrate World Thyroid Day with this informative graphic. A pink ribbon and anatomical thyroid representation are presented on a white background, emphasizing awareness for thyroid health. Perfect for medical publications, infographics, posters, and educational materials promoting prevention and healthcare on May 25. This vector illustration embodies health, wellbeing, and support
Free with trial This image depicts a visual representation of sound waves, showcasing the amplitude and frequency of the sound. The waves are illustrated in blue and green color tones, creating a visually appealing and informative graphic. Informative representation illustrations A visual representation of sound waves with blue and green color tones. This image depicts a visual representation of sound waves, showcasing the amplitude and frequency of the sound. The waves are illustrated in blue and green color tones, creating a visually appealing and informative graphic
Free with trial This image presents a detailed illustration of chromosomes and DNA structure, showcasing the intricate details of genetic material. The visual representation is crucial for scientific and educational purposes, providing insights into the molecular structure of DNA and chromosomes. The illustration highlights the helix structure of DNA, the composition of chromosomes, and the relationships between genetic components. This image is suitable for use in biology, genetics, and medical contexts, serving as a valuable resource for research, education, and informative materials. Informative representation vectors A detailed illustration of chromosomes and DNA structure in a scientific visual representation. This image presents a detailed illustration of chromosomes and. This image presents a detailed illustration of chromosomes and DNA structure, showcasing the intricate details of genetic material. The visual representation is crucial for scientific and educational purposes, providing insights into the molecular structure of DNA and chromosomes. The illustration highlights the helix structure of DNA, the composition of chromosomes, and the relationships between genetic components. This image is suitable for use in biology, genetics, and medical contexts, serving as a valuable resource for research, education, and informative materials.
Free with trial This dynamic bar graph showcases data in a visually appealing and engaging way. The use of a diverse palette of bright, sharp colors makes the chart highly informative and easy to understand at a glance. Each bar represents a distinct category, allowing for quick comparison and identification of trends and patterns. The sharp, detailed design ensures clarity and precision in data representation. Informative representation illustrations A Vibrant and Informative Colorful Bar Graph for Effective Data Visualization and Business Intelligence. This dynamic bar graph showcases data in a visually appealing and engaging way. The use of a diverse palette of bright, sharp colors makes the chart highly informative and easy to understand at a glance. Each bar represents a distinct category, allowing for quick comparison and identification of trends and patterns. The sharp, detailed design ensures clarity and precision in data representation
Free with trial This captivating full-color map of the United States showcases a meticulous representation of each state's boundaries. The vibrant hues and clear delineation of state borders offer a visually engaging and informative way to explore the geography of the nation. Ideal for educational purposes, presentations, or simply appreciating the diverse landscapes and political divisions of the country, this. Informative representation illustrations Detailed USA State Map A Vibrant Visual Representation of the United States Perfect for Educational Resources. This captivating full-color map of the United States showcases a meticulous representation of each state's boundaries. The vibrant hues and clear delineation of state borders offer a visually engaging and informative way to explore the geography of the nation. Ideal for educational purposes, presentations, or simply appreciating the diverse landscapes and political divisions of the country, this
Free with trial A 3D representation of a stylized sun, featuring a bright yellow circle with triangular rays radiating outward. The letters "SPF" are prominently displayed in white across the center of the sun. This design likely references sun protection, as SPF stands for Sun Protection Factor, commonly used in sunscreens to indicate the level of protection against UV rays. The clean, minimalist design emphasizes its informative and protective function. Informative representation illustrations A 3D representation of a stylized sun, featuring a bright yellow circle with triangul
Free with trial A clear and informative pie chart displaying various percentages, representing data visualization and analysis. Ideal for business reports, market research, educational presentations, or financial dashboards. Symbolizes statistics, proportional representation, and analytical insights, vector design Generative AI. Informative representation vectors Informative Pie Chart with Percentages, Data Visualization, vector design Generative AI. A clear and informative pie chart displaying various percentages, representing data visualization and analysis. Ideal for business reports, market research, educational presentations, or financial dashboards. Symbolizes statistics, proportional representation, and analytical insights, vector design Generative AI
Free with trial A polar area chart, representing circular data representation, analysis graphs, and radial data visualization in a clear, informative style vector design Generative AI. Informative representation vectors Polar area chart, circular data representation analysis graph vector design Generative AI. A polar area chart, representing circular data representation, analysis graphs, and radial data visualization in a clear, informative style vector design Generative AI
Free with trial A clean bar chart with varied heights, representing data representation and statistical reporting. Perfect for business analytics, academic research, or informational graphics. Symbolizes quantitative analysis, comparative data, and clear presentation of facts. Modern and informative. vector design Generative AI. Informative representation vectors Analytical Bar Chart Icon, Data Representation Statistical Report, vector design Generative AI. A clean bar chart with varied heights, representing data representation and statistical reporting. Perfect for business analytics, academic research, or informational graphics. Symbolizes quantitative analysis, comparative data, and clear presentation of facts. Modern and informative. vector design Generative AI
Free with trial This stylized blue icon embodies the essence of innovative ideas and informative reports. The meticulously crafted white paper texture evokes the tactile quality of research documentation, while the folded corner adds a dynamic element, symbolizing the process of discovery and insightful analysis. This visual representation is ideal for use in presentations, websites, or any context where you. Informative representation illustrations Innovative Report Icon A Symbolic Representation of Research Analysis and Insightful Documentation. This stylized blue icon embodies the essence of innovative ideas and informative reports. The meticulously crafted white paper texture evokes the tactile quality of research documentation, while the folded corner adds a dynamic element, symbolizing the process of discovery and insightful analysis. This visual representation is ideal for use in presentations, websites, or any context where you
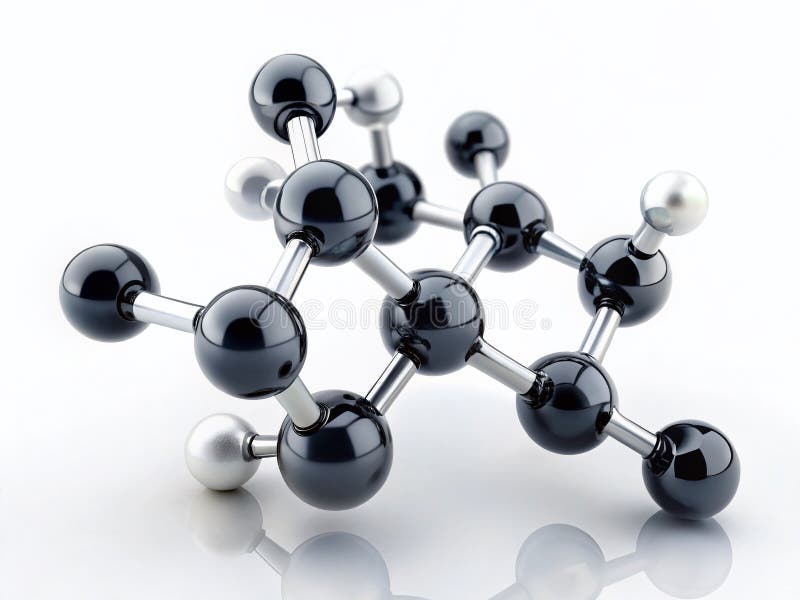
Free with trial This captivating visual showcases a meticulously detailed representation of an ethanol molecule, isolated against a clean white backdrop. The molecule's structure is presented with precision, highlighting the carbon and hydrogen atoms that form the ethyl group and the hydroxyl group characteristic of alcohols. The artistic style blends scientific accuracy with a contemporary aesthetic, making the. Informative representation illustrations Detailed Illustration of an Ethanol Molecule A Stylish and Informative Visual Representation of the Ethyl Alcohol. This captivating visual showcases a meticulously detailed representation of an ethanol molecule, isolated against a clean white backdrop. The molecule's structure is presented with precision, highlighting the carbon and hydrogen atoms that form the ethyl group and the hydroxyl group characteristic of alcohols. The artistic style blends scientific accuracy with a contemporary aesthetic, making the
Free with trial This breathtaking 4K heartbeat cardiogram animation is a captivating visual representation of the human heart's rhythmic pulse. The meticulously crafted animation showcases the intricate patterns of a cardiogram, pulsating with a dynamic energy. The vibrant colors and fluid motion create an aesthetically pleasing and informative visual experience. This medical animation is not only visually. Informative representation illustrations Dynamic 4K Heartbeat Cardiogram Animation A Visually Stunning and Informative Medical Visualization Masterfully. This breathtaking 4K heartbeat cardiogram animation is a captivating visual representation of the human heart's rhythmic pulse. The meticulously crafted animation showcases the intricate patterns of a cardiogram, pulsating with a dynamic energy. The vibrant colors and fluid motion create an aesthetically pleasing and informative visual experience. This medical animation is not only visually