Free with trial Display, dashboard, target, innovation, user, interface, sensors, sign, , cyberspace, symbol, elements, interactive, circle, data, graphic, digital, hud, technology, illustration, chart, system, visualization, panel, futuristic, web design science electronic set control radar navigator aim space virtual navigation statistic game screen counter virtual panel motion sensors interface design te. Interactive chart system illustrations Futuristic blue virtual graphic touch user interface. Display, dashboard, target, innovation, user, interface, sensors, sign, , cyberspace, symbol, elements. Display, dashboard, target, innovation, user, interface, sensors, sign, , cyberspace, symbol, elements, interactive, circle, data, graphic, digital, hud, technology, illustration, chart, system, visualization, panel, futuristic, web design science electronic set control radar navigator aim space virtual navigation statistic game screen counter virtual panel motion sensors interface design te
Free with trial Financial chart analysis system for business growth and market investment with interactive tablet data. Interactive chart system illustrations Financial Chart Analysis for Market Investment and Business Growth Strategy. Financial chart analysis system for business growth and market investment with. Financial chart analysis system for business growth and market investment with interactive tablet data
Free with trial Display, dashboard, target, innovation, user, interface, sensors, sign, , cyberspace, symbol, elements, interactive, circle, data, graphic, digital, hud, technology, illustration, chart, system, visualization, panel, futuristic, web design science electronic set control radar navigator aim space virtual navigation statistic game screen counter virtual panel motion sensors interface design te. Interactive chart system illustrations Futuristic black and white HUD, virtual touch user interface in flat design. Display, dashboard, target, innovation, user, interface, sensors, sign, , cyberspace. Display, dashboard, target, innovation, user, interface, sensors, sign, , cyberspace, symbol, elements, interactive, circle, data, graphic, digital, hud, technology, illustration, chart, system, visualization, panel, futuristic, web design science electronic set control radar navigator aim space virtual navigation statistic game screen counter virtual panel motion sensors interface design te
Free with trial Flat line design concepts for system analyst, information system architect and developer, business analyst, virtual reality technology, augmented reality, vr gaming and headset devices. Interactive chart system vectors Flat line design concepts for system analyst and virtual reality technology. Flat line design concepts for system analyst, information system architect and. Flat line design concepts for system analyst, information system architect and developer, business analyst, virtual reality technology, augmented reality, vr gaming and headset devices.
Free with trial Business & finance infographics set with integrated icons in pie chart illustration. Set included icons for development, investment, security, teamwork, innovations & etc. + 8 bonus icons!. Interactive chart system vectors Business & finance infographics set with integrated icons in pie chart illustration. Set included icons for development, investment, security, teamwork
Free with trial Project management system for business planning and scheduling with interactive Gantt chart interface. Interactive chart system illustrations Project Management Gantt Chart for Business Planning and Operational Scheduling. Project management system for business planning and scheduling with interactive. Project management system for business planning and scheduling with interactive Gantt chart interface
Free with trial Abstract technology ui futuristic human medical hud interface hologram elements of digital data chart, DNA,Fingerprint,Brain computing circle vitality innovation on hi tech future design background. Interactive chart system vectors Abstract technology ui futuristic human medical hud interface hologram elements of digital data chart, DNA,Fingerprint,Brain. Computing circle vitality. Abstract technology ui futuristic human medical hud interface hologram elements of digital data chart, DNA,Fingerprint,Brain computing circle vitality innovation on hi tech future design background
Free with trial Set Element for Futuristic Design. Interactive Interface Control Panels - Illustration Vector. Interactive chart system illustrations Set Element for Futuristic Design. Interactive Interface Control Panels. Illustration Vector
Free with trial Abstract technology ui futuristic Ai colorful hud interface hologram elements of digital data,chart communication, computing and circle percent vitality innovation on hi tech future design background. Interactive chart system vectors Abstract technology ui futuristic Ai colorful hud interface hologram elements of digital data,chart communication, computing and. Circle percent vitality. Abstract technology ui futuristic Ai colorful hud interface hologram elements of digital data,chart communication, computing and circle percent vitality innovation on hi tech future design background
Free with trial Financial trading system for market analysis and investment strategy with interactive tablet and hand interaction. Interactive chart system illustrations Financial Trading System for Market Analysis and Investment Strategy Using Interactive Tablet. Financial trading system for market analysis and investment. Financial trading system for market analysis and investment strategy with interactive tablet and hand interaction
Free with trial Abstract technology ui futuristic concept Ai hud interface hologram elements of digital data chart, communication, computing and circle percent vitality innovation on hi tech future design background. Interactive chart system vectors Abstract technology ui futuristic concept Ai hud interface hologram elements of digital data chart, communication, computing and. Circle percent vitality. Abstract technology ui futuristic concept Ai hud interface hologram elements of digital data chart, communication, computing and circle percent vitality innovation on hi tech future design background
Free with trial Abstract technology ui futuristic concept Ai hud interface hologram elements of digital data chart, communication, computing and circle percent vitality innovation on hi tech future design background. Interactive chart system vectors Abstract technology ui futuristic concept Ai hud interface hologram elements of digital data chart, communication, computing and. Circle percent vitality. Abstract technology ui futuristic concept Ai hud interface hologram elements of digital data chart, communication, computing and circle percent vitality innovation on hi tech future design background
Free with trial Abstract technology ui futuristic concept human digital DNA health care of hud interface hologram elements of digital data chart,. Eps10. Interactive chart system vectors Abstract technology ui futuristic concept human digital DNA health care of hud interface hologram elements of digital data chart,. Eps10
Free with trial Financial trading system for market analysis and investment strategy with interactive charts and user interaction. Interactive chart system illustrations Financial Trading System for Market Analysis and Investment Strategy Using Interactive Charts. Financial trading system for market analysis and investment. Financial trading system for market analysis and investment strategy with interactive charts and user interaction
Free with trial Color circles with flat icons in an arrow up business, marketing research, strategy, mission, analytics concepts. Abstract background with connected objects. Vector interactive illustration. Interactive chart system vectors Color circles with flat icons in an arrow up business, marketing research, strategy, mission, analytics concepts. Abstract background with connected objects
Free with trial Business network. Growth background with integrate flat icons. Connected symbols for strategy, service, analytics, research, digital marketing, communicate concepts. Vector interactive illustration. Interactive chart system vectors Business network. background with integrate flat icons. Business network. Growth background with integrate flat icons. Connected symbols for strategy, service. Business network. Growth background with integrate flat icons. Connected symbols for strategy, service, analytics, research, digital marketing, communicate concepts. Vector interactive illustration
Free with trial Set included icons for development, investment, security, bargain, teamwork, innovations + 8 bonus icons!. Interactive chart system vectors Business & finance infographics set with integrated icons in pie chart vector illustration. Set included icons for development, investment, security, bargain. Set included icons for development, investment, security, bargain, teamwork, innovations + 8 bonus icons!
Free with trial Commercial stock photograph shows analytics pie chart supports investment decisions on a cinematic digital interface. Carefully selected frame provides clear technology, analytics and business communication imagery. Interactive chart system illustrations Interactive Analytics pie chart supports investment decisions Stock Photograph. Commercial stock photograph shows analytics pie chart supports investment. Commercial stock photograph shows analytics pie chart supports investment decisions on a cinematic digital interface. Carefully selected frame provides clear technology, analytics and business communication imagery.
Free with trial Abstract technology ui futuristic concept human digital DNA health care of hud interface hologram elements of digital data chart, communication,innovation on hi tech future design background. Interactive chart system vectors Abstract technology ui futuristic concept human digital DNA heal. Th care of hud interface hologram elements of digital data chart, communication,innovation on. Abstract technology ui futuristic concept human digital DNA health care of hud interface hologram elements of digital data chart, communication,innovation on hi tech future design background
Free with trial Abstract technology ui futuristic concept hud interface hologram elements of digital data chart, communication, computing,human body digital health care ; health future design on hi tech background. Interactive chart system vectors Abstract technology ui futuristic concept hud interface hologram. Elements of digital data chart, communication, computing,human body digital health care. Abstract technology ui futuristic concept hud interface hologram elements of digital data chart, communication, computing,human body digital health care ; health future design on hi tech background.
Free with trial Abstract technology ui futuristic concept hud interface hologram elements of digital data chart, communication, computing and circle percent vitality innovation on hi tech future design background. Interactive chart system vectors Abstract technology ui futuristic concept hud interface. Hologram elements of digital data chart, communication, computing and circle percent vitality. Abstract technology ui futuristic concept hud interface hologram elements of digital data chart, communication, computing and circle percent vitality innovation on hi tech future design background
Free with trial Commercial stock photograph shows rising bar chart highlights infrastructure growth on a cinematic digital interface. Carefully selected frame provides clear technology, analytics and business communication imagery. Interactive chart system illustrations Interactive Rising bar chart highlights infrastructure growth Stock Photograph. Commercial stock photograph shows rising bar chart highlights infrastructure. Commercial stock photograph shows rising bar chart highlights infrastructure growth on a cinematic digital interface. Carefully selected frame provides clear technology, analytics and business communication imagery.
Free with trial Abstract technology ui futuristic concept fingerprint hud interface hologram elements of digital data chart,cyber security, computing and circle percent innovation on hi tech future design background. Interactive chart system vectors Abstract technology ui futuristic concept fingerprint hud interface hologram elements of digital data. Chart,cyber security, computing and circle percent. Abstract technology ui futuristic concept fingerprint hud interface hologram elements of digital data chart,cyber security, computing and circle percent innovation on hi tech future design background
Free with trial Futuristic Circles, Full color Elements Set. HUD Sci Fi Interfaces Cockpit Panels, Circulars, Dashboards, Crosshair, Radar Modern technoloy elements HUD UI. Vector full colors Sci fi interfaces set. Interactive chart system vectors Futuristic Circles, Full color HUD Elements Set. Futuristic Circles, Full color Elements Set. HUD Sci Fi Interfaces Cockpit Panels, Circulars, Dashboards. Futuristic Circles, Full color Elements Set. HUD Sci Fi Interfaces Cockpit Panels, Circulars, Dashboards, Crosshair, Radar Modern technoloy elements HUD UI. Vector full colors Sci fi interfaces set
Free with trial Vector display panel to control a smart house for humidity security and lighting with a person activiting a button on the interface shaped in the form of a house with a wifi antenna. Interactive chart system vectors Vector display panel to control a smart house. For humidity security and lighting with a person activiting a button on the interface shaped in the form of a. Vector display panel to control a smart house for humidity security and lighting with a person activiting a button on the interface shaped in the form of a house with a wifi antenna.
Free with trial Commercial stock photograph shows donut chart reports technology investment allocation on a cinematic digital interface. Carefully selected frame provides clear technology, analytics and business communication imagery. Interactive chart system illustrations Interactive Donut chart reports technology investment allocation Stock Photograph. Commercial stock photograph shows donut chart reports technology investment. Commercial stock photograph shows donut chart reports technology investment allocation on a cinematic digital interface. Carefully selected frame provides clear technology, analytics and business communication imagery.
Free with trial Futuristic hologram ui. Science hud interfaces, graph interface frames and tech regulators or button design elements digital graphics interface. Virtual hologram panels vector icons set. Interactive chart system vectors Futuristic hologram ui. Science hud interfaces, graph interface frames and tech regulators or button design elements. Digital graphics interface. Virtual. Futuristic hologram ui. Science hud interfaces, graph interface frames and tech regulators or button design elements digital graphics interface. Virtual hologram panels vector icons set
Free with trial Color circles, flat icons in a idea bulb shape, business, marketing research, strategy, mission, analytics concepts. Abstract background with connected objects. Vector interactive illustration. Interactive chart system vectors Flat icons in a idea bulb shape, business, marketing research, strategy, analytics concepts. Color circles, flat icons in a idea bulb shape, business, marketing. Color circles, flat icons in a idea bulb shape, business, marketing research, strategy, mission, analytics concepts. Abstract background with connected objects. Vector interactive illustration.
Free with trial Color circles with flat icons in an arrow up business, marketing research, strategy, mission, analytics concepts. Abstract background with connected objects. Vector interactive illustration. Interactive chart system vectors Color circles with flat icons in an arrow up business, marketing research, strategy, mission, analytics concepts. Abstract background with connected objects
Free with trial Data analysis, cloud storage, technology innovation, software interface, system optimization, IT solutions. Pie chart with gear, cloud icon and computer screen showing UI designs. Data analysis. Interactive chart system illustrations Data Visualization and Cloud Computing Concept with Pie Chart and Web Interface Display on Screen. Data analysis, cloud storage, technology innovation, software. Data analysis, cloud storage, technology innovation, software interface, system optimization, IT solutions. Pie chart with gear, cloud icon and computer screen showing UI designs. Data analysis
Free with trial Puzzle piece infographics business concept vector included integrated icons of development, investment, solutions, bargain and security. Infographic step by step template. Interactive chart system vectors Infographic illustration with integrated business icons for development, investment, solutions, bargain and security. Puzzle piece infographics business concept. Puzzle piece infographics business concept vector included integrated icons of development, investment, solutions, bargain and security. Infographic step by step template
Free with trial Business. Growth abstract background with connected circles and integrated icons for development, security, globality, solutions, innovations, justice, investment. Vector infographic illustration. Interactive chart system vectors Growth abstract background with connected circles and integrated icons. Business. Growth abstract background with connected circles and integrated icons for. Business. Growth abstract background with connected circles and integrated icons for development, security, globality, solutions, innovations, justice, investment. Vector infographic illustration
Free with trial Business. Growth abstract background with connected metaball and integrated icons for strategy, service, analytics, research, digital marketing, communicate concepts. Vector infographic illustration. Interactive chart system vectors Business. Growth abstract background with connected metaball and integrated icons. For strategy, service, analytics, research, digital marketing, communicate. Business. Growth abstract background with connected metaball and integrated icons for strategy, service, analytics, research, digital marketing, communicate concepts. Vector infographic illustration
Free with trial Commercial stock photograph shows circular analytics chart measures regional performance on a cinematic digital interface. Carefully selected frame provides clear technology, analytics and business communication imagery. Interactive chart system illustrations Interactive Circular analytics chart measures regional performance Stock Photograph. Commercial stock photograph shows circular analytics chart measures regional. Commercial stock photograph shows circular analytics chart measures regional performance on a cinematic digital interface. Carefully selected frame provides clear technology, analytics and business communication imagery.
Free with trial Puzzle piece infographics business concept vector included integrated icons of competence, development and bargain. Infographic illustration. Interactive chart system vectors Infographic illustration. Business concept vector included integrated icons of competence, development and bargain. Puzzle piece infographics business concept. Puzzle piece infographics business concept vector included integrated icons of competence, development and bargain. Infographic illustration
Free with trial Puzzle piece infographics business concept vector included integrated icons of competence and bargain. Infographic illustration. Interactive chart system vectors Infographic illustration. Business concept vector included integrated icons of competence and bargain. Puzzle piece infographics business concept vector. Puzzle piece infographics business concept vector included integrated icons of competence and bargain. Infographic illustration
Free with trial Futuristic radar screen user interface. HUD. Infographics futuristic blue background. GUI hologram set with world map. Digital business data for web app. Head-up display elements. Vector EPS 10. Interactive chart system vectors Futuristic radar screen user interface. HUD. Vector EPS 10. Futuristic radar screen user interface. HUD. Infographics futuristic blue background. GUI hologram. Futuristic radar screen user interface. HUD. Infographics futuristic blue background. GUI hologram set with world map. Digital business data for web app. Head-up display elements. Vector EPS 10.
Free with trial Selected commercial stock photograph captured from the animation at a strong visual moment. A fingertip explores a green circular bar chart over South America while connected markets glow across the map, illustrating interactive regional growth and commercial intelligence. Interactive chart system illustrations Commercial stock still of interactive south american analytics reveal regional growth. Selected commercial stock photograph captured from the animation at a. Selected commercial stock photograph captured from the animation at a strong visual moment. A fingertip explores a green circular bar chart over South America while connected markets glow across the map, illustrating interactive regional growth and commercial intelligence.
Free with trial Futuristic black and white virtual graphic touch user interface HUD. Interactive chart system vectors Futuristic black and white virtual graphic touch user interface HUD. Futuristic black and white virtual graphic touch user interface
Free with trial Car HUD Dashboard. Abstract virtual graphic touch user interface. Futuristic user interface HUD and Infographic elements. Interactive chart system vectors Car HUD Dashboard. Abstract virtual graphic touch user interface. Futuristic user interface HUD. And Infographic elements
Free with trial Sci-fi futuristic hud dashboard display virtual reality technology screen. Interactive chart system illustrations Sci-fi futuristic hud dashboard display virtual reality technology screen. Sci-fi futuristic hud dashboard display virtual reality technology
Free with trial Modern business analytics dashboard displayed on a large widescreen monitor featuring interactive data visualization, performance metrics, trend analysis, financial reporting, and business intelligence charts in a contemporary office environment. The clean user interface presents line graphs, KPI indicators, statistical reports, analytics panels, and operational insights that represent digital transformation, artificial intelligence, big data analysis, predictive analytics, and enterprise decision support systems. The minimalist workspace, soft natural lighting, and elegant interior design emphasize professionalism, innovation, and modern technology in today's data-driven business landscape. This image illustrates the growing role of artificial intelligence and business intelligence platforms in helping organizations monitor key performance indicators, optimize operations, forecast future trends, and improve strategic planning through real-time data analysis. The visual communicates concepts of digital reporting, executive dashboards, financial monitoring, customer analytics, sales performance tracking, operational efficiency, cloud computing, enterprise software, machine learning, predictive modeling, and smart business automation. The modern dashboard interface symbolizes how organizations transform complex datasets into meaningful insights for executives, managers, analysts, investors, and decision-makers. Ideal for illustrating topics related to business intelligence, data science, artificial intelligence, analytics software, enterprise technology, cloud-based reporting, digital transformation, financial technology, corporate management, performance monitoring, KPI dashboards, executive reporting, startup analytics, SaaS platforms, marketing analytics, customer insights, predictive business intelligence, operational management, workflow optimization, strategic planning, investment analysis, productivity measurement, financial forecasting, management consulting, digital innovation, technology infrastructure, enterprise solutions, smart organizations, business reporting, and modern workplace technology. The clean composition provides generous copy space for advertising campaigns, corporate presentations, technology websites, annual reports, software landing pages, business blogs, fintech marketing, educational materials, investor presentations, product demonstrations, digital marketing campaigns, editorial publications, online courses, and enterprise branding. Its universal visual appeal makes it highly suitable for commercial licensing across industries including finance, banking, consulting, software development, artificial intelligence, cloud computing, business services, accounting, analytics, education, healthcare management, logistics, manufacturing, retail, telecommunications, and technology startups. Perfect for illustrating concepts such as AI-powered analytics, business dashboard interface, executive reporting system, financial performance monitoring, enterprise data visualization, predictive analytics platform, cloud business intelligence, management reporting software, strategic decision making, operational analytics, digital KPI dashboard, modern analytics workspace, intelligent reporting system, corporate data management, business performance optimization, real-time analytics, machine learning insights, enterprise software solutions, digital business ecosystem, and next-generation business intelligence technologies. Generative Ai. performance, business, datum, chart, statistic, dashboard, technology, intelligence, monitoring, digital, ai, information, network, analysis, graph, innovation, interface, strategy, automation, cloud, management, report, growth, database, system, finance, insight, reporting, algorithm, cyber, future, learning, planning, software, security, communication, futuristic, machine, computing, financial, optimization, science, cyberspace, infographic, screen, big, economy, trend, virtual, enterprise, monitor, marketing, progress, forecasting, productivity, prediction, corporate, presentation, transformation, development, professional, computer, artificial, decision, connectivity, modern, research, abstract, glowing, global, efficiency, display, interactive, startup, processing, artificial intelligence, platform, tracking, collaboration, visualisation, blue, metric, brain, coding, executive, map, meeting, real, server, solution, teamwork, tech, earth, investment, male, neural, office, work, connection, dot, location, man, protection, smart, time, user, woman, icon, market, modelling, particle, pattern, template, background, assessment, businessperson, connected, evaluation, forecast, geography, human, measurement, operation, programming, project, revenue, silhouette, success, trading, analyst, governance, integration, matrix, organisation, pin, pipeline, privacy, storage, trade, workflow, accuracy, application, caucasian, company, control, deep,. Interactive chart system illustrations AI Business Analytics Dashboard on Large Monitor with Data Visualization and Performance Metrics. Modern business analytics dashboard displayed on a large. Modern business analytics dashboard displayed on a large widescreen monitor featuring interactive data visualization, performance metrics, trend analysis, financial reporting, and business intelligence charts in a contemporary office environment. The clean user interface presents line graphs, KPI indicators, statistical reports, analytics panels, and operational insights that represent digital transformation, artificial intelligence, big data analysis, predictive analytics, and enterprise decision support systems. The minimalist workspace, soft natural lighting, and elegant interior design emphasize professionalism, innovation, and modern technology in today's data-driven business landscape.This image illustrates the growing role of artificial intelligence and business intelligence platforms in helping organizations monitor key performance indicators, optimize operations, forecast future trends, and improve strategic planning through real-time data analysis. The visual communicates concepts of digital reporting, executive dashboards, financial monitoring, customer analytics, sales performance tracking, operational efficiency, cloud computing, enterprise software, machine learning, predictive modeling, and smart business automation. The modern dashboard interface symbolizes how organizations transform complex datasets into meaningful insights for executives, managers, analysts, investors, and decision-makers.Ideal for illustrating topics related to business intelligence, data science, artificial intelligence, analytics software, enterprise technology, cloud-based reporting, digital transformation, financial technology, corporate management, performance monitoring, KPI dashboards, executive reporting, startup analytics, SaaS platforms, marketing analytics, customer insights, predictive business intelligence, operational management, workflow optimization, strategic planning, investment analysis, productivity measurement, financial forecasting, management consulting, digital innovation, technology infrastructure, enterprise solutions, smart organizations, business reporting, and modern workplace technology.The clean composition provides generous copy space for advertising campaigns, corporate presentations, technology websites, annual reports, software landing pages, business blogs, fintech marketing, educational materials, investor presentations, product demonstrations, digital marketing campaigns, editorial publications, online courses, and enterprise branding. Its universal visual appeal makes it highly suitable for commercial licensing across industries including finance, banking, consulting, software development, artificial intelligence, cloud computing, business services, accounting, analytics, education, healthcare management, logistics, manufacturing, retail, telecommunications, and technology startups.Perfect for illustrating concepts such as AI-powered analytics, business dashboard interface, executive reporting system, financial performance monitoring, enterprise data visualization, predictive analytics platform, cloud business intelligence, management reporting software, strategic decision making, operational analytics, digital KPI dashboard, modern analytics workspace, intelligent reporting system, corporate data management, business performance optimization, real-time analytics, machine learning insights, enterprise software solutions, digital business ecosystem, and next-generation business intelligence technologies. Generative Ai. performance, business, datum, chart, statistic, dashboard, technology, intelligence, monitoring, digital, ai, information, network, analysis, graph, innovation, interface, strategy, automation, cloud, management, report, growth, database, system, finance, insight, reporting, algorithm, cyber, future, learning, planning, software, security, communication, futuristic, machine, computing, financial, optimization, science, cyberspace, infographic, screen, big, economy, trend, virtual, enterprise, monitor, marketing, progress, forecasting, productivity, prediction, corporate, presentation, transformation, development, professional, computer, artificial, decision, connectivity, modern, research, abstract, glowing, global, efficiency, display, interactive, startup, processing, artificial intelligence, platform, tracking, collaboration, visualisation, blue, metric, brain, coding, executive, map, meeting, real, server, solution, teamwork, tech, earth, investment, male, neural, office, work, connection, dot, location, man, protection, smart, time, user, woman, icon, market, modelling, particle, pattern, template, background, assessment, businessperson, connected, evaluation, forecast, geography, human, measurement, operation, programming, project, revenue, silhouette, success, trading, analyst, governance, integration, matrix, organisation, pin, pipeline, privacy, storage, trade, workflow, accuracy, application, caucasian, company, control, deep,
Free with trial Sci-fi futuristic hud dashboard display virtual reality technology screen. Interactive chart system illustrations Sci-fi futuristic hud dashboard display virtual reality technology screen. Sci-fi futuristic hud dashboard display virtual reality technology
Free with trial Sci-fi futuristic hud dashboard display virtual reality technology screen. Interactive chart system illustrations Sci-fi futuristic hud dashboard display virtual reality technology screen. Sci-fi futuristic hud dashboard display virtual technology screen
Free with trial Sci-fi futuristic hud dashboard display virtual reality technology screen. Interactive chart system illustrations Sci-fi futuristic hud dashboard display virtual reality technology screen. Sci-fi futuristic hud dashboard display virtual reality technology
Free with trial Modern business analytics dashboard displayed on a large widescreen monitor featuring interactive data visualization, performance metrics, trend analysis, financial reporting, and business intelligence charts in a contemporary office environment. The clean user interface presents line graphs, KPI indicators, statistical reports, analytics panels, and operational insights that represent digital transformation, artificial intelligence, big data analysis, predictive analytics, and enterprise decision support systems. The minimalist workspace, soft natural lighting, and elegant interior design emphasize professionalism, innovation, and modern technology in today's data-driven business landscape. This image illustrates the growing role of artificial intelligence and business intelligence platforms in helping organizations monitor key performance indicators, optimize operations, forecast future trends, and improve strategic planning through real-time data analysis. The visual communicates concepts of digital reporting, executive dashboards, financial monitoring, customer analytics, sales performance tracking, operational efficiency, cloud computing, enterprise software, machine learning, predictive modeling, and smart business automation. The modern dashboard interface symbolizes how organizations transform complex datasets into meaningful insights for executives, managers, analysts, investors, and decision-makers. Ideal for illustrating topics related to business intelligence, data science, artificial intelligence, analytics software, enterprise technology, cloud-based reporting, digital transformation, financial technology, corporate management, performance monitoring, KPI dashboards, executive reporting, startup analytics, SaaS platforms, marketing analytics, customer insights, predictive business intelligence, operational management, workflow optimization, strategic planning, investment analysis, productivity measurement, financial forecasting, management consulting, digital innovation, technology infrastructure, enterprise solutions, smart organizations, business reporting, and modern workplace technology. The clean composition provides generous copy space for advertising campaigns, corporate presentations, technology websites, annual reports, software landing pages, business blogs, fintech marketing, educational materials, investor presentations, product demonstrations, digital marketing campaigns, editorial publications, online courses, and enterprise branding. Its universal visual appeal makes it highly suitable for commercial licensing across industries including finance, banking, consulting, software development, artificial intelligence, cloud computing, business services, accounting, analytics, education, healthcare management, logistics, manufacturing, retail, telecommunications, and technology startups. Perfect for illustrating concepts such as AI-powered analytics, business dashboard interface, executive reporting system, financial performance monitoring, enterprise data visualization, predictive analytics platform, cloud business intelligence, management reporting software, strategic decision making, operational analytics, digital KPI dashboard, modern analytics workspace, intelligent reporting system, corporate data management, business performance optimization, real-time analytics, machine learning insights, enterprise software solutions, digital business ecosystem, and next-generation business intelligence technologies. Generative Ai. performance, business, datum, chart, statistic, dashboard, technology, intelligence, monitoring, digital, ai, information, network, analysis, graph, innovation, interface, strategy, automation, cloud, management, report, growth, database, system, finance, insight, reporting, algorithm, cyber, future, learning, planning, software, security, communication, futuristic, machine, computing, financial, optimization, science, cyberspace, infographic, screen, big, economy, trend, virtual, enterprise, monitor, marketing, progress, forecasting, productivity, prediction, corporate, presentation, transformation, development, professional, computer, artificial, decision, connectivity, modern, research, abstract, glowing, global, efficiency, display, interactive, startup, processing, artificial intelligence, platform, tracking, collaboration, visualisation, blue, metric, brain, coding, executive, map, meeting, real, server, solution, teamwork, tech, earth, investment, male, neural, office, work, connection, dot, location, man, protection, smart, time, user, woman, icon, market, modelling, particle, pattern, template, background, assessment, businessperson, connected, evaluation, forecast, geography, human, measurement, operation, programming, project, revenue, silhouette, success, trading, analyst, governance, integration, matrix, organisation, pin, pipeline, privacy, storage, trade, workflow, accuracy,. Interactive chart system illustrations AI Business Analytics Dashboard on Large Monitor with Data Visualization and Performance Metrics. Modern business analytics dashboard displayed on a large. Modern business analytics dashboard displayed on a large widescreen monitor featuring interactive data visualization, performance metrics, trend analysis, financial reporting, and business intelligence charts in a contemporary office environment. The clean user interface presents line graphs, KPI indicators, statistical reports, analytics panels, and operational insights that represent digital transformation, artificial intelligence, big data analysis, predictive analytics, and enterprise decision support systems. The minimalist workspace, soft natural lighting, and elegant interior design emphasize professionalism, innovation, and modern technology in today's data-driven business landscape.This image illustrates the growing role of artificial intelligence and business intelligence platforms in helping organizations monitor key performance indicators, optimize operations, forecast future trends, and improve strategic planning through real-time data analysis. The visual communicates concepts of digital reporting, executive dashboards, financial monitoring, customer analytics, sales performance tracking, operational efficiency, cloud computing, enterprise software, machine learning, predictive modeling, and smart business automation. The modern dashboard interface symbolizes how organizations transform complex datasets into meaningful insights for executives, managers, analysts, investors, and decision-makers.Ideal for illustrating topics related to business intelligence, data science, artificial intelligence, analytics software, enterprise technology, cloud-based reporting, digital transformation, financial technology, corporate management, performance monitoring, KPI dashboards, executive reporting, startup analytics, SaaS platforms, marketing analytics, customer insights, predictive business intelligence, operational management, workflow optimization, strategic planning, investment analysis, productivity measurement, financial forecasting, management consulting, digital innovation, technology infrastructure, enterprise solutions, smart organizations, business reporting, and modern workplace technology.The clean composition provides generous copy space for advertising campaigns, corporate presentations, technology websites, annual reports, software landing pages, business blogs, fintech marketing, educational materials, investor presentations, product demonstrations, digital marketing campaigns, editorial publications, online courses, and enterprise branding. Its universal visual appeal makes it highly suitable for commercial licensing across industries including finance, banking, consulting, software development, artificial intelligence, cloud computing, business services, accounting, analytics, education, healthcare management, logistics, manufacturing, retail, telecommunications, and technology startups.Perfect for illustrating concepts such as AI-powered analytics, business dashboard interface, executive reporting system, financial performance monitoring, enterprise data visualization, predictive analytics platform, cloud business intelligence, management reporting software, strategic decision making, operational analytics, digital KPI dashboard, modern analytics workspace, intelligent reporting system, corporate data management, business performance optimization, real-time analytics, machine learning insights, enterprise software solutions, digital business ecosystem, and next-generation business intelligence technologies. Generative Ai. performance, business, datum, chart, statistic, dashboard, technology, intelligence, monitoring, digital, ai, information, network, analysis, graph, innovation, interface, strategy, automation, cloud, management, report, growth, database, system, finance, insight, reporting, algorithm, cyber, future, learning, planning, software, security, communication, futuristic, machine, computing, financial, optimization, science, cyberspace, infographic, screen, big, economy, trend, virtual, enterprise, monitor, marketing, progress, forecasting, productivity, prediction, corporate, presentation, transformation, development, professional, computer, artificial, decision, connectivity, modern, research, abstract, glowing, global, efficiency, display, interactive, startup, processing, artificial intelligence, platform, tracking, collaboration, visualisation, blue, metric, brain, coding, executive, map, meeting, real, server, solution, teamwork, tech, earth, investment, male, neural, office, work, connection, dot, location, man, protection, smart, time, user, woman, icon, market, modelling, particle, pattern, template, background, assessment, businessperson, connected, evaluation, forecast, geography, human, measurement, operation, programming, project, revenue, silhouette, success, trading, analyst, governance, integration, matrix, organisation, pin, pipeline, privacy, storage, trade, workflow, accuracy,
Free with trial A Software, web development, programming concept. Abstract Programming. Interactive chart system illustrations A Software, web development, programming concept. Abstract Programming. Software, web development, programming concept. Abstract Programming
Free with trial Handwriting text Analytics. Concept meaning Data Analysis Financial Information Statistics Report Dashboard Ideas messages pink background splatters messy paint communicate feelings. Interactive chart system illustrations Handwriting text Analytics. Concept meaning Data Analysis Financial Information Statistics Report Dashboard Ideas messages pink ba. Ckground splatters messy. Handwriting text Analytics. Concept meaning Data Analysis Financial Information Statistics Report Dashboard Ideas messages pink background splatters messy paint communicate feelings
Free with trial A professionally dressed 3D businessman stands against a white background, holding a floating interactive chart system. The graphic elements represent data organization, task management, and communication icons connected to a colorful base. This high-quality render conveys a sense of efficiency, corporate strategy, and modern digital workflow management solutions. Interactive chart system illustrations A 3D Businessman Holding A Colorful Chart Icon Representing Data Management Processes. A professionally dressed 3D businessman stands against a white background. A professionally dressed 3D businessman stands against a white background, holding a floating interactive chart system. The graphic elements represent data organization, task management, and communication icons connected to a colorful base. This high-quality render conveys a sense of efficiency, corporate strategy, and modern digital workflow management solutions
Free with trial Modern business analytics dashboard displayed on a large widescreen monitor featuring interactive data visualization, performance metrics, trend analysis, financial reporting, and business intelligence charts in a contemporary office environment. The clean user interface presents line graphs, KPI indicators, statistical reports, analytics panels, and operational insights that represent digital transformation, artificial intelligence, big data analysis, predictive analytics, and enterprise decision support systems. The minimalist workspace, soft natural lighting, and elegant interior design emphasize professionalism, innovation, and modern technology in today's data-driven business landscape. This image illustrates the growing role of artificial intelligence and business intelligence platforms in helping organizations monitor key performance indicators, optimize operations, forecast future trends, and improve strategic planning through real-time data analysis. The visual communicates concepts of digital reporting, executive dashboards, financial monitoring, customer analytics, sales performance tracking, operational efficiency, cloud computing, enterprise software, machine learning, predictive modeling, and smart business automation. The modern dashboard interface symbolizes how organizations transform complex datasets into meaningful insights for executives, managers, analysts, investors, and decision-makers. Ideal for illustrating topics related to business intelligence, data science, artificial intelligence, analytics software, enterprise technology, cloud-based reporting, digital transformation, financial technology, corporate management, performance monitoring, KPI dashboards, executive reporting, startup analytics, SaaS platforms, marketing analytics, customer insights, predictive business intelligence, operational management, workflow optimization, strategic planning, investment analysis, productivity measurement, financial forecasting, management consulting, digital innovation, technology infrastructure, enterprise solutions, smart organizations, business reporting, and modern workplace technology. The clean composition provides generous copy space for advertising campaigns, corporate presentations, technology websites, annual reports, software landing pages, business blogs, fintech marketing, educational materials, investor presentations, product demonstrations, digital marketing campaigns, editorial publications, online courses, and enterprise branding. Its universal visual appeal makes it highly suitable for commercial licensing across industries including finance, banking, consulting, software development, artificial intelligence, cloud computing, business services, accounting, analytics, education, healthcare management, logistics, manufacturing, retail, telecommunications, and technology startups. Perfect for illustrating concepts such as AI-powered analytics, business dashboard interface, executive reporting system, financial performance monitoring, enterprise data visualization, predictive analytics platform, cloud business intelligence, management reporting software, strategic decision making, operational analytics, digital KPI dashboard, modern analytics workspace, intelligent reporting system, corporate data management, business performance optimization, real-time analytics, machine learning insights, enterprise software solutions, digital business ecosystem, and next-generation business intelligence technologies. Generative Ai. performance, business, datum, chart, statistic, dashboard, technology, intelligence, monitoring, digital, ai, information, network, analysis, graph, innovation, interface, strategy, automation, cloud, management, report, growth, database, system, finance, insight, reporting, algorithm, cyber, future, learning, planning, software, security, communication, futuristic, machine, computing, financial, optimization, science, cyberspace, infographic, screen, big, economy, trend, virtual, enterprise, monitor, marketing, progress, forecasting, productivity, prediction, corporate, presentation, transformation, development, professional, computer, artificial, decision, connectivity, modern, research, abstract, glowing, global, efficiency, display, interactive, startup, processing, artificial intelligence, platform, tracking, collaboration, visualisation, blue, metric, brain, coding, executive, map, meeting, real, server, solution, teamwork, tech, earth, investment, male, neural, office, work, connection, dot, location, man, protection, smart, time, user, woman, icon, market, modelling, particle, pattern, template, background, assessment, businessperson, connected, evaluation, forecast, geography, human, measurement, operation, programming, project, revenue, silhouette, success, trading, analyst, governance, integration, matrix, organisation, pin, pipeline, privacy, storage, trade, workflow, accuracy,. Interactive chart system illustrations AI Business Analytics Dashboard on Large Monitor with Data Visualization and Performance Metrics. Modern business analytics dashboard displayed on a large. Modern business analytics dashboard displayed on a large widescreen monitor featuring interactive data visualization, performance metrics, trend analysis, financial reporting, and business intelligence charts in a contemporary office environment. The clean user interface presents line graphs, KPI indicators, statistical reports, analytics panels, and operational insights that represent digital transformation, artificial intelligence, big data analysis, predictive analytics, and enterprise decision support systems. The minimalist workspace, soft natural lighting, and elegant interior design emphasize professionalism, innovation, and modern technology in today's data-driven business landscape.This image illustrates the growing role of artificial intelligence and business intelligence platforms in helping organizations monitor key performance indicators, optimize operations, forecast future trends, and improve strategic planning through real-time data analysis. The visual communicates concepts of digital reporting, executive dashboards, financial monitoring, customer analytics, sales performance tracking, operational efficiency, cloud computing, enterprise software, machine learning, predictive modeling, and smart business automation. The modern dashboard interface symbolizes how organizations transform complex datasets into meaningful insights for executives, managers, analysts, investors, and decision-makers.Ideal for illustrating topics related to business intelligence, data science, artificial intelligence, analytics software, enterprise technology, cloud-based reporting, digital transformation, financial technology, corporate management, performance monitoring, KPI dashboards, executive reporting, startup analytics, SaaS platforms, marketing analytics, customer insights, predictive business intelligence, operational management, workflow optimization, strategic planning, investment analysis, productivity measurement, financial forecasting, management consulting, digital innovation, technology infrastructure, enterprise solutions, smart organizations, business reporting, and modern workplace technology.The clean composition provides generous copy space for advertising campaigns, corporate presentations, technology websites, annual reports, software landing pages, business blogs, fintech marketing, educational materials, investor presentations, product demonstrations, digital marketing campaigns, editorial publications, online courses, and enterprise branding. Its universal visual appeal makes it highly suitable for commercial licensing across industries including finance, banking, consulting, software development, artificial intelligence, cloud computing, business services, accounting, analytics, education, healthcare management, logistics, manufacturing, retail, telecommunications, and technology startups.Perfect for illustrating concepts such as AI-powered analytics, business dashboard interface, executive reporting system, financial performance monitoring, enterprise data visualization, predictive analytics platform, cloud business intelligence, management reporting software, strategic decision making, operational analytics, digital KPI dashboard, modern analytics workspace, intelligent reporting system, corporate data management, business performance optimization, real-time analytics, machine learning insights, enterprise software solutions, digital business ecosystem, and next-generation business intelligence technologies. Generative Ai. performance, business, datum, chart, statistic, dashboard, technology, intelligence, monitoring, digital, ai, information, network, analysis, graph, innovation, interface, strategy, automation, cloud, management, report, growth, database, system, finance, insight, reporting, algorithm, cyber, future, learning, planning, software, security, communication, futuristic, machine, computing, financial, optimization, science, cyberspace, infographic, screen, big, economy, trend, virtual, enterprise, monitor, marketing, progress, forecasting, productivity, prediction, corporate, presentation, transformation, development, professional, computer, artificial, decision, connectivity, modern, research, abstract, glowing, global, efficiency, display, interactive, startup, processing, artificial intelligence, platform, tracking, collaboration, visualisation, blue, metric, brain, coding, executive, map, meeting, real, server, solution, teamwork, tech, earth, investment, male, neural, office, work, connection, dot, location, man, protection, smart, time, user, woman, icon, market, modelling, particle, pattern, template, background, assessment, businessperson, connected, evaluation, forecast, geography, human, measurement, operation, programming, project, revenue, silhouette, success, trading, analyst, governance, integration, matrix, organisation, pin, pipeline, privacy, storage, trade, workflow, accuracy,
Free with trial Hand of businessman interactive touching a holographic financial growth graph chart system network and technology, success of trading innovation. Interactive chart system illustrations Businessman interactive touching a holographic financial growth graph chart system network and technology,. Hand of businessman interactive touching a. hand of businessman interactive touching a holographic financial growth graph chart system network and technology, success of trading innovation
Free with trial Hand of businessman interactive touching a holographic financial growth graph chart system network and technology, success of trading innovation. Interactive chart system illustrations Interactive touching a holographic financial growth graph chart system network and technology, success of trading innovation. Hand of businessman interactive. hand of businessman interactive touching a holographic financial growth graph chart system network and technology, success of trading innovation
Free with trial User experience, data analysis, customer feedback, business insights, rating systems, performance metrics. Graphics of a rating system, bar chart and statistics. Customer feedback and data analysis. Interactive chart system vectors Data Visualization with Rating System, Chart Analysis, and Dashboard Interface Elements. User experience, data analysis, customer feedback, business insights. User experience, data analysis, customer feedback, business insights, rating systems, performance metrics. Graphics of a rating system, bar chart and statistics. Customer feedback and data analysis
Free with trial A modern corporate boardroom featuring a sleek conference table, executive seating, panoramic city skyline views, and a large digital display presenting an advanced artificial intelligence network interface. This premium business environment represents digital transformation, enterprise innovation, smart collaboration, executive decision-making, cloud computing, cybersecurity, data analytics, and the future of intelligent corporate operations. The contemporary architectural design, minimalist interior, and immersive technology display create a sophisticated atmosphere ideal for illustrating modern business leadership and technology-driven organizations. The high-resolution image symbolizes the convergence of business strategy and advanced digital technologies including artificial intelligence, machine learning, cloud infrastructure, enterprise software, cybersecurity solutions, digital communication, automation, big data analytics, blockchain, Internet of Things, predictive analytics, and intelligent business platforms. The large interactive technology display visualizes connected systems, data flow, and digital infrastructure, reinforcing concepts of innovation, operational efficiency, enterprise networking, and smart decision support. Perfect for illustrating corporate innovation, executive meetings, digital strategy planning, technology consulting, startup investment, board presentations, cloud services, fintech solutions, software development, IT management, digital transformation initiatives, business intelligence, enterprise architecture, hybrid work environments, remote collaboration, project management, organizational leadership, research and development, future workplace concepts, and smart office ecosystems. The clean composition and balanced perspective also provide generous copy space for presentations, website hero images, annual reports, investor materials, business proposals, marketing campaigns, technology conferences, consulting firms, educational resources, and editorial publications. The sophisticated office environment reflects professionalism, trust, productivity, innovation, and strategic thinking while showcasing a workspace designed for high-level executive collaboration and digital leadership. The combination of modern furniture, architectural elegance, natural daylight, and futuristic digital visualization makes this image suitable for a broad range of commercial and editorial applications across industries including finance, healthcare, information technology, engineering, telecommunications, manufacturing, consulting, education, government, and enterprise services. Its timeless corporate aesthetic ensures long-term commercial relevance for organizations promoting innovation, leadership, digital modernization, smart business solutions, artificial intelligence adoption, cloud computing services, enterprise software platforms, cybersecurity awareness, and the evolving future of work. The image effectively communicates the transformation of traditional boardrooms into intelligent decision-making environments powered by advanced digital technologies. Generative Ai. boardroom, corporate, dashboard, modern, technology, business, datum, digital, innovation, strategy, futuristic, meeting, office, screen, display, professional, interface, ai, visualisation, information, intelligence, network, chart, analysis, future, planning, presentation, communication, global, virtual, leadership, management, concept, collaboration, graph, interactive, executive, automation, artificial, conference, science, statistic, system, finance, glasses, connectivity, software, team, tech, transformation, artificial intelligence, growth, urban, holographic, discussion, progress, cyberspace, glowing, connection, interior, smart, trend, design, market, lighting, silhouette, strategic, success, dramatic, room, workplace, abstract, big, computer, control, development, workspace, hologram, wall, table, efficiency, enterprise, financial, monitor, networking, performance, projection, research, solution, investment, productivity, chair, cyber, blue, hand, achievement, decision, interaction, pointing, project, server, teamwork, vision, businessman, businesswoman, code, conference room, expert, graphic, insight, sleek, workflow, algorithm, economy, electronic, processing, reality, robot, touch screen, user, woman, cloud, window, high technology, assistant, authority, briefing, diagram, efficient, expense, intelligent, jewellery, learning, manager, marketing, monitoring, polished, profile, report, senior, successful, touching, trading, visual, working, budget, competence, confidence, contemporary, cost, driving, focused, furniture, governance, hub, infographic, information technology, integration, meeting room, node, panel, power, privacy, quality, reviewing, savings, scientist,. Interactive chart system illustrations Modern Corporate Boardroom with AI Digital Dashboard Display and Smart Business Technology Concept. A modern corporate boardroom featuring a sleek conference. A modern corporate boardroom featuring a sleek conference table, executive seating, panoramic city skyline views, and a large digital display presenting an advanced artificial intelligence network interface. This premium business environment represents digital transformation, enterprise innovation, smart collaboration, executive decision-making, cloud computing, cybersecurity, data analytics, and the future of intelligent corporate operations. The contemporary architectural design, minimalist interior, and immersive technology display create a sophisticated atmosphere ideal for illustrating modern business leadership and technology-driven organizations.The high-resolution image symbolizes the convergence of business strategy and advanced digital technologies including artificial intelligence, machine learning, cloud infrastructure, enterprise software, cybersecurity solutions, digital communication, automation, big data analytics, blockchain, Internet of Things, predictive analytics, and intelligent business platforms. The large interactive technology display visualizes connected systems, data flow, and digital infrastructure, reinforcing concepts of innovation, operational efficiency, enterprise networking, and smart decision support.Perfect for illustrating corporate innovation, executive meetings, digital strategy planning, technology consulting, startup investment, board presentations, cloud services, fintech solutions, software development, IT management, digital transformation initiatives, business intelligence, enterprise architecture, hybrid work environments, remote collaboration, project management, organizational leadership, research and development, future workplace concepts, and smart office ecosystems. The clean composition and balanced perspective also provide generous copy space for presentations, website hero images, annual reports, investor materials, business proposals, marketing campaigns, technology conferences, consulting firms, educational resources, and editorial publications.The sophisticated office environment reflects professionalism, trust, productivity, innovation, and strategic thinking while showcasing a workspace designed for high-level executive collaboration and digital leadership. The combination of modern furniture, architectural elegance, natural daylight, and futuristic digital visualization makes this image suitable for a broad range of commercial and editorial applications across industries including finance, healthcare, information technology, engineering, telecommunications, manufacturing, consulting, education, government, and enterprise services.Its timeless corporate aesthetic ensures long-term commercial relevance for organizations promoting innovation, leadership, digital modernization, smart business solutions, artificial intelligence adoption, cloud computing services, enterprise software platforms, cybersecurity awareness, and the evolving future of work. The image effectively communicates the transformation of traditional boardrooms into intelligent decision-making environments powered by advanced digital technologies. Generative Ai. boardroom, corporate, dashboard, modern, technology, business, datum, digital, innovation, strategy, futuristic, meeting, office, screen, display, professional, interface, ai, visualisation, information, intelligence, network, chart, analysis, future, planning, presentation, communication, global, virtual, leadership, management, concept, collaboration, graph, interactive, executive, automation, artificial, conference, science, statistic, system, finance, glasses, connectivity, software, team, tech, transformation, artificial intelligence, growth, urban, holographic, discussion, progress, cyberspace, glowing, connection, interior, smart, trend, design, market, lighting, silhouette, strategic, success, dramatic, room, workplace, abstract, big, computer, control, development, workspace, hologram, wall, table, efficiency, enterprise, financial, monitor, networking, performance, projection, research, solution, investment, productivity, chair, cyber, blue, hand, achievement, decision, interaction, pointing, project, server, teamwork, vision, businessman, businesswoman, code, conference room, expert, graphic, insight, sleek, workflow, algorithm, economy, electronic, processing, reality, robot, touch screen, user, woman, cloud, window, high technology, assistant, authority, briefing, diagram, efficient, expense, intelligent, jewellery, learning, manager, marketing, monitoring, polished, profile, report, senior, successful, touching, trading, visual, working, budget, competence, confidence, contemporary, cost, driving, focused, furniture, governance, hub, infographic, information technology, integration, meeting room, node, panel, power, privacy, quality, reviewing, savings, scientist,
Free with trial Futuristic financial chart with glowing lines and interactive data points against a dark backdrop, representing global market analysis and digital trading. Generative AI. Interactive chart system illustrations Futuristic financial chart with glowing lines and interactive data points against a dark backdrop. Representing global market analysis and digital trading
Free with trial Interactive 3D cost? revenue formula chart explaining break-even and zero-profit. Interactive chart system illustrations Interactive 3D Cost-Revenue Formula Chart Showing Zero-Profit and Break-Even Concepts. Interactive 3D cost?revenue formula chart explaining break-even and zero. Interactive 3D cost?revenue formula chart explaining break-even and zero-profit
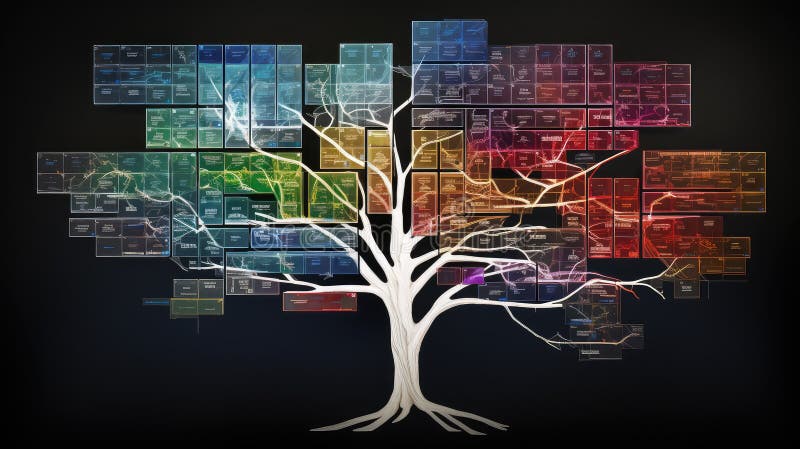
Free with trial Interactive tree flow chart illustration color visualization, data dynamic, engaging computer interactive tree flow chart. Interactive chart system illustrations Interactive tree flow chart. Illustration color visualization, data dynamic, engaging computer AI generated. interactive tree flow chart illustration color visualization, data dynamic, engaging computer interactive tree flow chart
Free with trial A modern corporate boardroom featuring a sleek conference table, executive seating, panoramic city skyline views, and a large digital display presenting an advanced artificial intelligence network interface. This premium business environment represents digital transformation, enterprise innovation, smart collaboration, executive decision-making, cloud computing, cybersecurity, data analytics, and the future of intelligent corporate operations. The contemporary architectural design, minimalist interior, and immersive technology display create a sophisticated atmosphere ideal for illustrating modern business leadership and technology-driven organizations. The high-resolution image symbolizes the convergence of business strategy and advanced digital technologies including artificial intelligence, machine learning, cloud infrastructure, enterprise software, cybersecurity solutions, digital communication, automation, big data analytics, blockchain, Internet of Things, predictive analytics, and intelligent business platforms. The large interactive technology display visualizes connected systems, data flow, and digital infrastructure, reinforcing concepts of innovation, operational efficiency, enterprise networking, and smart decision support. Perfect for illustrating corporate innovation, executive meetings, digital strategy planning, technology consulting, startup investment, board presentations, cloud services, fintech solutions, software development, IT management, digital transformation initiatives, business intelligence, enterprise architecture, hybrid work environments, remote collaboration, project management, organizational leadership, research and development, future workplace concepts, and smart office ecosystems. The clean composition and balanced perspective also provide generous copy space for presentations, website hero images, annual reports, investor materials, business proposals, marketing campaigns, technology conferences, consulting firms, educational resources, and editorial publications. The sophisticated office environment reflects professionalism, trust, productivity, innovation, and strategic thinking while showcasing a workspace designed for high-level executive collaboration and digital leadership. The combination of modern furniture, architectural elegance, natural daylight, and futuristic digital visualization makes this image suitable for a broad range of commercial and editorial applications across industries including finance, healthcare, information technology, engineering, telecommunications, manufacturing, consulting, education, government, and enterprise services. Its timeless corporate aesthetic ensures long-term commercial relevance for organizations promoting innovation, leadership, digital modernization, smart business solutions, artificial intelligence adoption, cloud computing services, enterprise software platforms, cybersecurity awareness, and the evolving future of work. The image effectively communicates the transformation of traditional boardrooms into intelligent decision-making environments powered by advanced digital technologies. Generative Ai. boardroom, corporate, dashboard, modern, technology, business, datum, digital, innovation, strategy, futuristic, meeting, office, screen, display, professional, interface, ai, visualisation, information, intelligence, network, chart, analysis, future, planning, presentation, communication, global, virtual, leadership, management, concept, collaboration, graph, interactive, executive, automation, artificial, conference, science, statistic, system, finance, glasses, connectivity, software, team, tech, transformation, artificial intelligence, growth, urban, holographic, discussion, progress, cyberspace, glowing, connection, interior, smart, trend, design, market, lighting, silhouette, strategic, success, dramatic, room, workplace, abstract, big, computer, control, development, workspace, hologram, wall, table, efficiency, enterprise, financial, monitor, networking, performance, projection, research, solution, investment, productivity, chair, cyber, blue, hand, achievement, decision, interaction, pointing, project, server, teamwork, vision, businessman, businesswoman, code, conference room, expert, graphic, insight, sleek, workflow, algorithm, economy, electronic, processing, reality, robot, touch screen, user, woman, cloud, window, high technology, assistant, authority, briefing, diagram, efficient, expense, intelligent, jewellery, learning, manager, marketing, monitoring, polished, profile, report, senior, successful, touching, trading, visual, working, budget, competence, confidence, contemporary, cost, driving, focused, furniture, governance, hub, infographic, information technology, integration, meeting room, node, panel, power, privacy, quality, reviewing, savings, scientist,. Interactive chart system illustrations Modern Corporate Boardroom with AI Digital Dashboard Display and Smart Business Technology Concept. A modern corporate boardroom featuring a sleek conference. A modern corporate boardroom featuring a sleek conference table, executive seating, panoramic city skyline views, and a large digital display presenting an advanced artificial intelligence network interface. This premium business environment represents digital transformation, enterprise innovation, smart collaboration, executive decision-making, cloud computing, cybersecurity, data analytics, and the future of intelligent corporate operations. The contemporary architectural design, minimalist interior, and immersive technology display create a sophisticated atmosphere ideal for illustrating modern business leadership and technology-driven organizations.The high-resolution image symbolizes the convergence of business strategy and advanced digital technologies including artificial intelligence, machine learning, cloud infrastructure, enterprise software, cybersecurity solutions, digital communication, automation, big data analytics, blockchain, Internet of Things, predictive analytics, and intelligent business platforms. The large interactive technology display visualizes connected systems, data flow, and digital infrastructure, reinforcing concepts of innovation, operational efficiency, enterprise networking, and smart decision support.Perfect for illustrating corporate innovation, executive meetings, digital strategy planning, technology consulting, startup investment, board presentations, cloud services, fintech solutions, software development, IT management, digital transformation initiatives, business intelligence, enterprise architecture, hybrid work environments, remote collaboration, project management, organizational leadership, research and development, future workplace concepts, and smart office ecosystems. The clean composition and balanced perspective also provide generous copy space for presentations, website hero images, annual reports, investor materials, business proposals, marketing campaigns, technology conferences, consulting firms, educational resources, and editorial publications.The sophisticated office environment reflects professionalism, trust, productivity, innovation, and strategic thinking while showcasing a workspace designed for high-level executive collaboration and digital leadership. The combination of modern furniture, architectural elegance, natural daylight, and futuristic digital visualization makes this image suitable for a broad range of commercial and editorial applications across industries including finance, healthcare, information technology, engineering, telecommunications, manufacturing, consulting, education, government, and enterprise services.Its timeless corporate aesthetic ensures long-term commercial relevance for organizations promoting innovation, leadership, digital modernization, smart business solutions, artificial intelligence adoption, cloud computing services, enterprise software platforms, cybersecurity awareness, and the evolving future of work. The image effectively communicates the transformation of traditional boardrooms into intelligent decision-making environments powered by advanced digital technologies. Generative Ai. boardroom, corporate, dashboard, modern, technology, business, datum, digital, innovation, strategy, futuristic, meeting, office, screen, display, professional, interface, ai, visualisation, information, intelligence, network, chart, analysis, future, planning, presentation, communication, global, virtual, leadership, management, concept, collaboration, graph, interactive, executive, automation, artificial, conference, science, statistic, system, finance, glasses, connectivity, software, team, tech, transformation, artificial intelligence, growth, urban, holographic, discussion, progress, cyberspace, glowing, connection, interior, smart, trend, design, market, lighting, silhouette, strategic, success, dramatic, room, workplace, abstract, big, computer, control, development, workspace, hologram, wall, table, efficiency, enterprise, financial, monitor, networking, performance, projection, research, solution, investment, productivity, chair, cyber, blue, hand, achievement, decision, interaction, pointing, project, server, teamwork, vision, businessman, businesswoman, code, conference room, expert, graphic, insight, sleek, workflow, algorithm, economy, electronic, processing, reality, robot, touch screen, user, woman, cloud, window, high technology, assistant, authority, briefing, diagram, efficient, expense, intelligent, jewellery, learning, manager, marketing, monitoring, polished, profile, report, senior, successful, touching, trading, visual, working, budget, competence, confidence, contemporary, cost, driving, focused, furniture, governance, hub, infographic, information technology, integration, meeting room, node, panel, power, privacy, quality, reviewing, savings, scientist,
Free with trial Abstract of electronic futuristic system background with chart d. Esign, vector eps10. Interactive chart system vectors Abstract of electronic futuristic system background with chart d. Esign, vector eps10
Free with trial Futuristic 3d medical visualization of the human respiratory system with interactive data points, Generated by AI. Interactive chart system illustrations Futuristic 3d medical visualization of the human respiratory system with interactive data points. Generated by AI
Free with trial Advanced Futuristic Data Visualization System Displays Complex Information with Interactive Charts and Graphs, Utilizing Cutting-Edge Technology for Seamless Data Analysis and Presentation. Generative AI image , high resolution. Interactive chart system illustrations Advanced Futuristic Data Visualization System Displays Complex Information with Interactive Charts and Graphs, Util. Izing Cutting-Edge Technology for Seamless. Advanced Futuristic Data Visualization System Displays Complex Information with Interactive Charts and Graphs, Utilizing Cutting-Edge Technology for Seamless Data Analysis and Presentation . Generative AI image , high resolution
Free with trial A modern corporate boardroom featuring a sleek conference table, executive seating, panoramic city skyline views, and a large digital display presenting an advanced artificial intelligence network interface. This premium business environment represents digital transformation, enterprise innovation, smart collaboration, executive decision-making, cloud computing, cybersecurity, data analytics, and the future of intelligent corporate operations. The contemporary architectural design, minimalist interior, and immersive technology display create a sophisticated atmosphere ideal for illustrating modern business leadership and technology-driven organizations. The high-resolution image symbolizes the convergence of business strategy and advanced digital technologies including artificial intelligence, machine learning, cloud infrastructure, enterprise software, cybersecurity solutions, digital communication, automation, big data analytics, blockchain, Internet of Things, predictive analytics, and intelligent business platforms. The large interactive technology display visualizes connected systems, data flow, and digital infrastructure, reinforcing concepts of innovation, operational efficiency, enterprise networking, and smart decision support. Perfect for illustrating corporate innovation, executive meetings, digital strategy planning, technology consulting, startup investment, board presentations, cloud services, fintech solutions, software development, IT management, digital transformation initiatives, business intelligence, enterprise architecture, hybrid work environments, remote collaboration, project management, organizational leadership, research and development, future workplace concepts, and smart office ecosystems. The clean composition and balanced perspective also provide generous copy space for presentations, website hero images, annual reports, investor materials, business proposals, marketing campaigns, technology conferences, consulting firms, educational resources, and editorial publications. The sophisticated office environment reflects professionalism, trust, productivity, innovation, and strategic thinking while showcasing a workspace designed for high-level executive collaboration and digital leadership. The combination of modern furniture, architectural elegance, natural daylight, and futuristic digital visualization makes this image suitable for a broad range of commercial and editorial applications across industries including finance, healthcare, information technology, engineering, telecommunications, manufacturing, consulting, education, government, and enterprise services. Its timeless corporate aesthetic ensures long-term commercial relevance for organizations promoting innovation, leadership, digital modernization, smart business solutions, artificial intelligence adoption, cloud computing services, enterprise software platforms, cybersecurity awareness, and the evolving future of work. The image effectively communicates the transformation of traditional boardrooms into intelligent decision-making environments powered by advanced digital technologies. Generative Ai. boardroom, corporate, dashboard, modern, technology, business, datum, digital, innovation, strategy, futuristic, meeting, office, screen, display, professional, interface, ai, visualisation, information, intelligence, network, chart, analysis, future, planning, presentation, communication, global, virtual, leadership, management, concept, collaboration, graph, interactive, executive, automation, artificial, conference, science, statistic, system, finance. Interactive chart system illustrations Modern Corporate Boardroom with AI Digital Dashboard Display and Smart Business Technology Concept. A modern corporate boardroom featuring a sleek conference. A modern corporate boardroom featuring a sleek conference table, executive seating, panoramic city skyline views, and a large digital display presenting an advanced artificial intelligence network interface. This premium business environment represents digital transformation, enterprise innovation, smart collaboration, executive decision-making, cloud computing, cybersecurity, data analytics, and the future of intelligent corporate operations. The contemporary architectural design, minimalist interior, and immersive technology display create a sophisticated atmosphere ideal for illustrating modern business leadership and technology-driven organizations.The high-resolution image symbolizes the convergence of business strategy and advanced digital technologies including artificial intelligence, machine learning, cloud infrastructure, enterprise software, cybersecurity solutions, digital communication, automation, big data analytics, blockchain, Internet of Things, predictive analytics, and intelligent business platforms. The large interactive technology display visualizes connected systems, data flow, and digital infrastructure, reinforcing concepts of innovation, operational efficiency, enterprise networking, and smart decision support.Perfect for illustrating corporate innovation, executive meetings, digital strategy planning, technology consulting, startup investment, board presentations, cloud services, fintech solutions, software development, IT management, digital transformation initiatives, business intelligence, enterprise architecture, hybrid work environments, remote collaboration, project management, organizational leadership, research and development, future workplace concepts, and smart office ecosystems. The clean composition and balanced perspective also provide generous copy space for presentations, website hero images, annual reports, investor materials, business proposals, marketing campaigns, technology conferences, consulting firms, educational resources, and editorial publications.The sophisticated office environment reflects professionalism, trust, productivity, innovation, and strategic thinking while showcasing a workspace designed for high-level executive collaboration and digital leadership. The combination of modern furniture, architectural elegance, natural daylight, and futuristic digital visualization makes this image suitable for a broad range of commercial and editorial applications across industries including finance, healthcare, information technology, engineering, telecommunications, manufacturing, consulting, education, government, and enterprise services.Its timeless corporate aesthetic ensures long-term commercial relevance for organizations promoting innovation, leadership, digital modernization, smart business solutions, artificial intelligence adoption, cloud computing services, enterprise software platforms, cybersecurity awareness, and the evolving future of work. The image effectively communicates the transformation of traditional boardrooms into intelligent decision-making environments powered by advanced digital technologies. Generative Ai. boardroom, corporate, dashboard, modern, technology, business, datum, digital, innovation, strategy, futuristic, meeting, office, screen, display, professional, interface, ai, visualisation, information, intelligence, network, chart, analysis, future, planning, presentation, communication, global, virtual, leadership, management, concept, collaboration, graph, interactive, executive, automation, artificial, conference, science, statistic, system, finance.
Free with trial Unravel the intricacies of data with this captivating labyrinth puzzle. The visual representation of a complex system is designed to be engaging and insightful. A central pie chart displays the breakdown of data elements, while the interconnected paths of the labyrinth reveal the relationships between these elements. Navigate through the maze-like structure to uncover hidden patterns and. Interactive chart system illustrations Interactive Labyrinth Puzzle Visualizes Data with a Pie Chart Explore Complex Relationships and Discover Insights. Unravel the intricacies of data with this. Unravel the intricacies of data with this captivating labyrinth puzzle. The visual representation of a complex system is designed to be engaging and insightful. A central pie chart displays the breakdown of data elements, while the interconnected paths of the labyrinth reveal the relationships between these elements. Navigate through the maze-like structure to uncover hidden patterns and
Free with trial The image showcases an interactive data visualization display featuring a combination of bar graphs and a pie chart. The display is likely part of a modern data analytics system, used to present complex data in an easily digestible format. The bar graphs and pie chart are rendered in 3D, with vibrant colors and dynamic lighting effects, suggesting a high-tech and sophisticated interface. This. Interactive chart system illustrations Interactive data visualization display. The image showcases an interactive data visualization display featuring a combination of bar graphs and a pie chart. The. The image showcases an interactive data visualization display featuring a combination of bar graphs and a pie chart. The display is likely part of a modern data analytics system, used to present complex data in an easily digestible format. The bar graphs and pie chart are rendered in 3D, with vibrant colors and dynamic lighting effects, suggesting a high-tech and sophisticated interface. This
Free with trial Display, dashboard, target, innovation, user, interface, sensors, sign, , cyberspace, symbol, elements, interactive, circle, data, graphic, digital, hud, technology, illustration, chart, system, visualization, panel, futuristic, web design science electronic set control radar navigator aim space virtual navigation statistic game screen counter virtual panel motion sensors interface design te. Interactive chart system illustrations Set black and white infographic display elements for the web app. Display, dashboard, target, innovation, user, interface, sensors, sign, , cyberspace, symbol. Display, dashboard, target, innovation, user, interface, sensors, sign, , cyberspace, symbol, elements, interactive, circle, data, graphic, digital, hud, technology, illustration, chart, system, visualization, panel, futuristic, web design science electronic set control radar navigator aim space virtual navigation statistic game screen counter virtual panel motion sensors interface design te
Free with trial Electronic steering angle sensor module displaying an interactive circular calibration and diagnostics chart. Interactive chart system illustrations Electronic steering angle sensor module displaying an interactive circular calibration and diagnostics chart.
Free with trial Display, dashboard, target, innovation, user, interface, sensors, sign, , cyberspace, symbol, elements, interactive, circle, data, graphic, digital, hud, technology, illustration, chart, system, visualization, panel, futuristic, web design science electronic set control radar navigator aim space virtual navigation statistic game screen counter virtual panel motion sensors interface design te. Interactive chart system illustrations Futuristic black and white HUD, virtual touch user interface in flat design. Display, dashboard, target, innovation, user, interface, sensors, sign, , cyberspace. Display, dashboard, target, innovation, user, interface, sensors, sign, , cyberspace, symbol, elements, interactive, circle, data, graphic, digital, hud, technology, illustration, chart, system, visualization, panel, futuristic, web design science electronic set control radar navigator aim space virtual navigation statistic game screen counter virtual panel motion sensors interface design te
Free with trial Display, dashboard, target, innovation, user, interface, sensors, sign, , cyberspace, symbol, elements, interactive, circle, data, graphic, digital, hud, technology, illustration, chart, system, visualization, panel, futuristic, web design science electronic set control radar navigator aim space virtual navigation statistic game screen counter virtual panel motion sensors interface design te. Interactive chart system illustrations Futuristic black and white HUD, virtual touch user interface in flat design. Display, dashboard, target, innovation, user, interface, sensors, sign, , cyberspace. Display, dashboard, target, innovation, user, interface, sensors, sign, , cyberspace, symbol, elements, interactive, circle, data, graphic, digital, hud, technology, illustration, chart, system, visualization, panel, futuristic, web design science electronic set control radar navigator aim space virtual navigation statistic game screen counter virtual panel motion sensors interface design te
Free with trial Display, dashboard, target, innovation, user, interface, sensors, sign, , cyberspace, symbol, elements, interactive, circle, data, graphic, digital, hud, technology, illustration, chart, system, visualization, panel, futuristic, web design science electronic set control radar navigator aim space virtual navigation statistic game screen counter virtual panel motion sensors interface design te. Interactive chart system illustrations Futuristic black and white HUD, virtual touch user interface in flat design. Display, dashboard, target, innovation, user, interface, sensors, sign, , cyberspace. Display, dashboard, target, innovation, user, interface, sensors, sign, , cyberspace, symbol, elements, interactive, circle, data, graphic, digital, hud, technology, illustration, chart, system, visualization, panel, futuristic, web design science electronic set control radar navigator aim space virtual navigation statistic game screen counter virtual panel motion sensors interface design te
Free with trial Modern digital health monitoring dashboard displayed on a high-resolution desktop monitor featuring real-time patient analytics, electrocardiogram waveforms, medical performance metrics, and interactive healthcare data visualization in a professional clinical environment. This advanced medical technology concept illustrates the digital transformation of healthcare through intelligent patient monitoring systems, electronic health records, real-time physiological data analysis, and integrated medical dashboards that support faster clinical decision-making and improved patient care. The clean workspace, modern computer display, and sophisticated user interface represent the future of connected healthcare, hospital information systems, and AI-assisted medical monitoring. The dashboard showcases multiple live health indicators including ECG waveforms, heart rhythm monitoring, patient statistics, clinical performance charts, trend analysis, and graphical healthcare analytics presented in a visually organized interface. These elements symbolize the increasing adoption of digital health platforms capable of collecting, processing, and visualizing complex medical information for physicians, nurses, healthcare administrators, researchers, and medical specialists. The combination of colorful medical graphs, biometric indicators, and performance dashboards reflects the growing importance of healthcare informatics, predictive analytics, and data-driven medicine in modern clinical practice. This image represents a wide range of healthcare technology applications including patient monitoring systems, remote patient management, hospital dashboards, telemedicine platforms, electronic medical records, clinical decision support systems, digital diagnostics, healthcare analytics, and smart hospital infrastructure. The visualization demonstrates how healthcare providers can monitor patient conditions continuously, analyze historical trends, identify abnormal vital signs, improve workflow efficiency, and enhance patient safety through advanced digital technologies. The realistic computer interface emphasizes concepts such as digital healthcare transformation, medical software development, healthcare information technology, artificial intelligence in medicine, cloud-based health platforms, hospital management systems, clinical workflow optimization, health data security, medical big data, and intelligent healthcare ecosystems. The modern dashboard also illustrates interoperability between medical devices, centralized patient records, automated reporting systems, and real-time visualization tools that improve communication between healthcare professionals while supporting evidence-based clinical decisions. Ideal for commercial and editorial use, this image is suitable for healthcare technology companies, medical software developers, hospitals, clinics, pharmaceutical organizations, biotechnology firms, research institutions, insurance providers, educational publishers, government health agencies, and digital health startups. It serves as an excellent visual asset for presentations, healthcare reports, medical journals, website banners, advertising campaigns, educational materials, conference publications, corporate communications, and technology demonstrations focusing on innovation in healthcare delivery. The clean office setting, modern workstation, and professional digital interface create a trustworthy atmosphere that reflects reliability, efficiency, and technological advancement. The balanced composition provides generous copy space for headlines, promotional messages, branding elements, educational content, and marketing materials while maintaining strong visual emphasis on the sophisticated medical dashboard and healthcare analytics displayed on the monitor. The realistic lighting and contemporary design enhance the commercial versatility of the image across multiple healthcare and technology industries. This high-quality AI-generated illustration effectively communicates the evolution of healthcare toward intelligent digital ecosystems where real-time patient monitoring, electronic health records, predictive analytics, cloud computing, machine learning, medical visualization, and connected healthcare infrastructure work together to improve diagnostic accuracy, optimize clinical operations, support preventive medicine, enhance patient engagement, reduce healthcare costs, and deliver better medical outcomes. Its modern aesthetic and universal healthcare technology concept make it an ideal choice for stock photography collections, healthcare innovation campaigns, digital medicine publications, health technology marketing, and commercial creative projects focused on the future of connected healthcare and data-driven medical services. Generative Ai. patient, dashboard, health care, datum, monitoring, health, technology, digital, interface, innovation, display, system, software, information, chart, analysis, futuristic, graph, diagnostic, clinical, hospital, care, science, statistic, interactive, design, advanced, performance, research, smart, tracking, ai, management, screen, treatment, virtual, monitor, electronic, diagnosis, solution, professional, control, equipment, device, connectivity, record, signs, medicine, biometric, future, doctor, modern, wellness, clinic, intelligence, vital, brain, assessment, efficiency, cardiology, tool, user, progress, graphic, presentation, glowing, scan, insight, precision, application, integration, communication, signal, anatomy, sensor, model, trend, network, measurement, nurse, operation, oxygen, secure, surgery, optimization, visual, cardiogram, biomedical, tech, laboratory, response, body, remote, wearable, blue, computing, anatomical, touch screen, summary, reporting, emergency, engagement, intelligent, fiction, lung, lighting, facility, connected, physician, pulse, x-ray, therapeutic, programming, dynamic, intensive, security, respiration, infographic, compliance, waveform, alert, algorithm, business, artificial intelligence, workflow, visionary, observation, reality, process, respiratory, platform, engineering, update, clean, hologram, cinematic, machine, exam, human, interaction, heartbeat, detailed, chest, complexity, buttons, database, feedback, innovative, nursing, program, profile, posture, live, learning, organ, practitioner, pressure, report, result, spine, scientific, resource, recovery, resolution, scheme, real, study, trial, therapy, stethoscope, support, stress, code, coordination, clinician, computerized, biology, diaphragm, enhance, documentation, front, focused, experiment, critical. Interactive chart system illustrations Digital Health Monitoring Dashboard with Real-Time Patient Analytics and Medical Data Visualization. Modern digital health monitoring dashboard displayed on a. Modern digital health monitoring dashboard displayed on a high-resolution desktop monitor featuring real-time patient analytics, electrocardiogram waveforms, medical performance metrics, and interactive healthcare data visualization in a professional clinical environment. This advanced medical technology concept illustrates the digital transformation of healthcare through intelligent patient monitoring systems, electronic health records, real-time physiological data analysis, and integrated medical dashboards that support faster clinical decision-making and improved patient care. The clean workspace, modern computer display, and sophisticated user interface represent the future of connected healthcare, hospital information systems, and AI-assisted medical monitoring.The dashboard showcases multiple live health indicators including ECG waveforms, heart rhythm monitoring, patient statistics, clinical performance charts, trend analysis, and graphical healthcare analytics presented in a visually organized interface. These elements symbolize the increasing adoption of digital health platforms capable of collecting, processing, and visualizing complex medical information for physicians, nurses, healthcare administrators, researchers, and medical specialists. The combination of colorful medical graphs, biometric indicators, and performance dashboards reflects the growing importance of healthcare informatics, predictive analytics, and data-driven medicine in modern clinical practice.This image represents a wide range of healthcare technology applications including patient monitoring systems, remote patient management, hospital dashboards, telemedicine platforms, electronic medical records, clinical decision support systems, digital diagnostics, healthcare analytics, and smart hospital infrastructure. The visualization demonstrates how healthcare providers can monitor patient conditions continuously, analyze historical trends, identify abnormal vital signs, improve workflow efficiency, and enhance patient safety through advanced digital technologies.The realistic computer interface emphasizes concepts such as digital healthcare transformation, medical software development, healthcare information technology, artificial intelligence in medicine, cloud-based health platforms, hospital management systems, clinical workflow optimization, health data security, medical big data, and intelligent healthcare ecosystems. The modern dashboard also illustrates interoperability between medical devices, centralized patient records, automated reporting systems, and real-time visualization tools that improve communication between healthcare professionals while supporting evidence-based clinical decisions.Ideal for commercial and editorial use, this image is suitable for healthcare technology companies, medical software developers, hospitals, clinics, pharmaceutical organizations, biotechnology firms, research institutions, insurance providers, educational publishers, government health agencies, and digital health startups. It serves as an excellent visual asset for presentations, healthcare reports, medical journals, website banners, advertising campaigns, educational materials, conference publications, corporate communications, and technology demonstrations focusing on innovation in healthcare delivery.The clean office setting, modern workstation, and professional digital interface create a trustworthy atmosphere that reflects reliability, efficiency, and technological advancement. The balanced composition provides generous copy space for headlines, promotional messages, branding elements, educational content, and marketing materials while maintaining strong visual emphasis on the sophisticated medical dashboard and healthcare analytics displayed on the monitor. The realistic lighting and contemporary design enhance the commercial versatility of the image across multiple healthcare and technology industries.This high-quality AI-generated illustration effectively communicates the evolution of healthcare toward intelligent digital ecosystems where real-time patient monitoring, electronic health records, predictive analytics, cloud computing, machine learning, medical visualization, and connected healthcare infrastructure work together to improve diagnostic accuracy, optimize clinical operations, support preventive medicine, enhance patient engagement, reduce healthcare costs, and deliver better medical outcomes. Its modern aesthetic and universal healthcare technology concept make it an ideal choice for stock photography collections, healthcare innovation campaigns, digital medicine publications, health technology marketing, and commercial creative projects focused on the future of connected healthcare and data-driven medical services. Generative Ai. patient, dashboard, health care, datum, monitoring, health, technology, digital, interface, innovation, display, system, software, information, chart, analysis, futuristic, graph, diagnostic, clinical, hospital, care, science, statistic, interactive, design, advanced, performance, research, smart, tracking, ai, management, screen, treatment, virtual, monitor, electronic, diagnosis, solution, professional, control, equipment, device, connectivity, record, signs, medicine, biometric, future, doctor, modern, wellness, clinic, intelligence, vital, brain, assessment, efficiency, cardiology, tool, user, progress, graphic, presentation, glowing, scan, insight, precision, application, integration, communication, signal, anatomy, sensor, model, trend, network, measurement, nurse, operation, oxygen, secure, surgery, optimization, visual, cardiogram, biomedical, tech, laboratory, response, body, remote, wearable, blue, computing, anatomical, touch screen, summary, reporting, emergency, engagement, intelligent, fiction, lung, lighting, facility, connected, physician, pulse, x-ray, therapeutic, programming, dynamic, intensive, security, respiration, infographic, compliance, waveform, alert, algorithm, business, artificial intelligence, workflow, visionary, observation, reality, process, respiratory, platform, engineering, update, clean, hologram, cinematic, machine, exam, human, interaction, heartbeat, detailed, chest, complexity, buttons, database, feedback, innovative, nursing, program, profile, posture, live, learning, organ, practitioner, pressure, report, result, spine, scientific, resource, recovery, resolution, scheme, real, study, trial, therapy, stethoscope, support, stress, code, coordination, clinician, computerized, biology, diaphragm, enhance, documentation, front, focused, experiment, critical
Free with trial Display, dashboard, target, innovation, user, interface, sensors, sign, , cyberspace, symbol, elements, interactive, circle, data, graphic, digital, hud, technology, illustration, chart, system, visualization, panel, futuristic, web design science electronic set control radar navigator aim space virtual navigation statistic game screen counter virtual panel motion sensors interface design te. Interactive chart system illustrations Futuristic black and white HUD, virtual touch user interface in flat design. Display, dashboard, target, innovation, user, interface, sensors, sign, , cyberspace. Display, dashboard, target, innovation, user, interface, sensors, sign, , cyberspace, symbol, elements, interactive, circle, data, graphic, digital, hud, technology, illustration, chart, system, visualization, panel, futuristic, web design science electronic set control radar navigator aim space virtual navigation statistic game screen counter virtual panel motion sensors interface design te
Free with trial Display, dashboard, target, innovation, user, interface, sensors, sign, , cyberspace, symbol, elements, interactive, circle, data, graphic, digital, hud, technology, illustration, chart, system, visualization, panel, futuristic, web design science electronic set control radar navigator aim space virtual navigation statistic game screen counter virtual panel motion sensors interface design te. Interactive chart system illustrations Futuristic black and white HUD, virtual touch user interface in flat design. Display, dashboard, target, innovation, user, interface, sensors, sign, , cyberspace. Display, dashboard, target, innovation, user, interface, sensors, sign, , cyberspace, symbol, elements, interactive, circle, data, graphic, digital, hud, technology, illustration, chart, system, visualization, panel, futuristic, web design science electronic set control radar navigator aim space virtual navigation statistic game screen counter virtual panel motion sensors interface design te
Free with trial Display, dashboard, target, innovation, user, interface, sensors, sign, , cyberspace, symbol, elements, interactive, circle, data, graphic, digital, hud, technology, illustration, chart, system, visualization, panel, futuristic, web design science electronic set control radar navigator aim space virtual navigation statistic game screen counter virtual panel motion sensors interface design te. Interactive chart system illustrations Futuristic black and white HUD, virtual touch user interface in flat design. Display, dashboard, target, innovation, user, interface, sensors, sign, , cyberspace. Display, dashboard, target, innovation, user, interface, sensors, sign, , cyberspace, symbol, elements, interactive, circle, data, graphic, digital, hud, technology, illustration, chart, system, visualization, panel, futuristic, web design science electronic set control radar navigator aim space virtual navigation statistic game screen counter virtual panel motion sensors interface design te
Free with trial Modern digital health monitoring dashboard displayed on a high-resolution desktop monitor featuring real-time patient analytics, electrocardiogram waveforms, medical performance metrics, and interactive healthcare data visualization in a professional clinical environment. This advanced medical technology concept illustrates the digital transformation of healthcare through intelligent patient monitoring systems, electronic health records, real-time physiological data analysis, and integrated medical dashboards that support faster clinical decision-making and improved patient care. The clean workspace, modern computer display, and sophisticated user interface represent the future of connected healthcare, hospital information systems, and AI-assisted medical monitoring. The dashboard showcases multiple live health indicators including ECG waveforms, heart rhythm monitoring, patient statistics, clinical performance charts, trend analysis, and graphical healthcare analytics presented in a visually organized interface. These elements symbolize the increasing adoption of digital health platforms capable of collecting, processing, and visualizing complex medical information for physicians, nurses, healthcare administrators, researchers, and medical specialists. The combination of colorful medical graphs, biometric indicators, and performance dashboards reflects the growing importance of healthcare informatics, predictive analytics, and data-driven medicine in modern clinical practice. This image represents a wide range of healthcare technology applications including patient monitoring systems, remote patient management, hospital dashboards, telemedicine platforms, electronic medical records, clinical decision support systems, digital diagnostics, healthcare analytics, and smart hospital infrastructure. The visualization demonstrates how healthcare providers can monitor patient conditions continuously, analyze historical trends, identify abnormal vital signs, improve workflow efficiency, and enhance patient safety through advanced digital technologies. The realistic computer interface emphasizes concepts such as digital healthcare transformation, medical software development, healthcare information technology, artificial intelligence in medicine, cloud-based health platforms, hospital management systems, clinical workflow optimization, health data security, medical big data, and intelligent healthcare ecosystems. The modern dashboard also illustrates interoperability between medical devices, centralized patient records, automated reporting systems, and real-time visualization tools that improve communication between healthcare professionals while supporting evidence-based clinical decisions. Ideal for commercial and editorial use, this image is suitable for healthcare technology companies, medical software developers, hospitals, clinics, pharmaceutical organizations, biotechnology firms, research institutions, insurance providers, educational publishers, government health agencies, and digital health startups. It serves as an excellent visual asset for presentations, healthcare reports, medical journals, website banners, advertising campaigns, educational materials, conference publications, corporate communications, and technology demonstrations focusing on innovation in healthcare delivery. The clean office setting, modern workstation, and professional digital interface create a trustworthy atmosphere that reflects reliability, efficiency, and technological advancement. The balanced composition provides generous copy space for headlines, promotional messages, branding elements, educational content, and marketing materials while maintaining strong visual emphasis on the sophisticated medical dashboard and healthcare analytics displayed on the monitor. The realistic lighting and contemporary design enhance the commercial versatility of the image across multiple healthcare and technology industries. This high-quality AI-generated illustration effectively communicates the evolution of healthcare toward intelligent digital ecosystems where real-time patient monitoring, electronic health records, predictive analytics, cloud computing, machine learning, medical visualization, and connected healthcare infrastructure work together to improve diagnostic accuracy, optimize clinical operations, support preventive medicine, enhance patient engagement, reduce healthcare costs, and deliver better medical outcomes. Its modern aesthetic and universal healthcare technology concept make it an ideal choice for stock photography collections, healthcare innovation campaigns, digital medicine publications, health technology marketing, and commercial creative projects focused on the future of connected healthcare and data-driven medical services. Generative Ai. patient, dashboard, health care, datum, monitoring, health, technology, digital, interface, innovation, display, system, software, information, chart, analysis, futuristic, graph, diagnostic, clinical, hospital, care, science, statistic, interactive, design, advanced, performance, research, smart, tracking, ai, management, screen, treatment, virtual, monitor, electronic, diagnosis, solution, professional, control, equipment, device, connectivity, record, signs, medicine, biometric, future, doctor, modern, wellness, clinic, intelligence, vital, brain, assessment, efficiency, cardiology, tool, user, progress, graphic, presentation, glowing, scan, insight, precision, application, integration, communication, signal, anatomy, sensor, model, trend, network, measurement, nurse, operation, oxygen, secure, surgery, optimization, visual, cardiogram, biomedical, tech, laboratory, response, body, remote, wearable, blue, computing, anatomical, touch screen, summary, reporting, emergency, engagement, intelligent, fiction, lung, lighting, facility, connected, physician, pulse, x-ray, therapeutic, programming, dynamic, intensive, security, respiration, infographic, compliance, waveform, alert, algorithm, business, artificial intelligence, workflow, visionary, observation, reality, process, respiratory, platform, engineering, update, clean, hologram, cinematic, machine, exam, human, interaction, heartbeat, detailed, chest, complexity, buttons, database, feedback, innovative, nursing, program, profile, posture, live, learning, organ, practitioner, pressure, report, result, spine, scientific, resource, recovery, resolution, scheme, real, study, trial, therapy, stethoscope, support, stress, code, coordination, clinician, computerized, biology, diaphragm, enhance, documentation, front, focused, experiment, critical. Interactive chart system illustrations Digital Health Monitoring Dashboard with Real-Time Patient Analytics and Medical Data Visualization. Modern digital health monitoring dashboard displayed on a. Modern digital health monitoring dashboard displayed on a high-resolution desktop monitor featuring real-time patient analytics, electrocardiogram waveforms, medical performance metrics, and interactive healthcare data visualization in a professional clinical environment. This advanced medical technology concept illustrates the digital transformation of healthcare through intelligent patient monitoring systems, electronic health records, real-time physiological data analysis, and integrated medical dashboards that support faster clinical decision-making and improved patient care. The clean workspace, modern computer display, and sophisticated user interface represent the future of connected healthcare, hospital information systems, and AI-assisted medical monitoring.The dashboard showcases multiple live health indicators including ECG waveforms, heart rhythm monitoring, patient statistics, clinical performance charts, trend analysis, and graphical healthcare analytics presented in a visually organized interface. These elements symbolize the increasing adoption of digital health platforms capable of collecting, processing, and visualizing complex medical information for physicians, nurses, healthcare administrators, researchers, and medical specialists. The combination of colorful medical graphs, biometric indicators, and performance dashboards reflects the growing importance of healthcare informatics, predictive analytics, and data-driven medicine in modern clinical practice.This image represents a wide range of healthcare technology applications including patient monitoring systems, remote patient management, hospital dashboards, telemedicine platforms, electronic medical records, clinical decision support systems, digital diagnostics, healthcare analytics, and smart hospital infrastructure. The visualization demonstrates how healthcare providers can monitor patient conditions continuously, analyze historical trends, identify abnormal vital signs, improve workflow efficiency, and enhance patient safety through advanced digital technologies.The realistic computer interface emphasizes concepts such as digital healthcare transformation, medical software development, healthcare information technology, artificial intelligence in medicine, cloud-based health platforms, hospital management systems, clinical workflow optimization, health data security, medical big data, and intelligent healthcare ecosystems. The modern dashboard also illustrates interoperability between medical devices, centralized patient records, automated reporting systems, and real-time visualization tools that improve communication between healthcare professionals while supporting evidence-based clinical decisions.Ideal for commercial and editorial use, this image is suitable for healthcare technology companies, medical software developers, hospitals, clinics, pharmaceutical organizations, biotechnology firms, research institutions, insurance providers, educational publishers, government health agencies, and digital health startups. It serves as an excellent visual asset for presentations, healthcare reports, medical journals, website banners, advertising campaigns, educational materials, conference publications, corporate communications, and technology demonstrations focusing on innovation in healthcare delivery.The clean office setting, modern workstation, and professional digital interface create a trustworthy atmosphere that reflects reliability, efficiency, and technological advancement. The balanced composition provides generous copy space for headlines, promotional messages, branding elements, educational content, and marketing materials while maintaining strong visual emphasis on the sophisticated medical dashboard and healthcare analytics displayed on the monitor. The realistic lighting and contemporary design enhance the commercial versatility of the image across multiple healthcare and technology industries.This high-quality AI-generated illustration effectively communicates the evolution of healthcare toward intelligent digital ecosystems where real-time patient monitoring, electronic health records, predictive analytics, cloud computing, machine learning, medical visualization, and connected healthcare infrastructure work together to improve diagnostic accuracy, optimize clinical operations, support preventive medicine, enhance patient engagement, reduce healthcare costs, and deliver better medical outcomes. Its modern aesthetic and universal healthcare technology concept make it an ideal choice for stock photography collections, healthcare innovation campaigns, digital medicine publications, health technology marketing, and commercial creative projects focused on the future of connected healthcare and data-driven medical services. Generative Ai. patient, dashboard, health care, datum, monitoring, health, technology, digital, interface, innovation, display, system, software, information, chart, analysis, futuristic, graph, diagnostic, clinical, hospital, care, science, statistic, interactive, design, advanced, performance, research, smart, tracking, ai, management, screen, treatment, virtual, monitor, electronic, diagnosis, solution, professional, control, equipment, device, connectivity, record, signs, medicine, biometric, future, doctor, modern, wellness, clinic, intelligence, vital, brain, assessment, efficiency, cardiology, tool, user, progress, graphic, presentation, glowing, scan, insight, precision, application, integration, communication, signal, anatomy, sensor, model, trend, network, measurement, nurse, operation, oxygen, secure, surgery, optimization, visual, cardiogram, biomedical, tech, laboratory, response, body, remote, wearable, blue, computing, anatomical, touch screen, summary, reporting, emergency, engagement, intelligent, fiction, lung, lighting, facility, connected, physician, pulse, x-ray, therapeutic, programming, dynamic, intensive, security, respiration, infographic, compliance, waveform, alert, algorithm, business, artificial intelligence, workflow, visionary, observation, reality, process, respiratory, platform, engineering, update, clean, hologram, cinematic, machine, exam, human, interaction, heartbeat, detailed, chest, complexity, buttons, database, feedback, innovative, nursing, program, profile, posture, live, learning, organ, practitioner, pressure, report, result, spine, scientific, resource, recovery, resolution, scheme, real, study, trial, therapy, stethoscope, support, stress, code, coordination, clinician, computerized, biology, diaphragm, enhance, documentation, front, focused, experiment, critical
Free with trial Display, dashboard, target, innovation, user, interface, sensors, sign, , cyberspace, symbol, elements, interactive, circle, data, graphic, digital, hud, technology, illustration, chart, system, visualization, panel, futuristic, web design science electronic set control radar navigator aim space virtual navigation statistic game screen counter virtual panel motion sensors interface design te. Interactive chart system illustrations Futuristic black and white HUD, virtual touch user interface in flat design. Display, dashboard, target, innovation, user, interface, sensors, sign, , cyberspace. Display, dashboard, target, innovation, user, interface, sensors, sign, , cyberspace, symbol, elements, interactive, circle, data, graphic, digital, hud, technology, illustration, chart, system, visualization, panel, futuristic, web design science electronic set control radar navigator aim space virtual navigation statistic game screen counter virtual panel motion sensors interface design te
Free with trial Display, dashboard, target, innovation, user, interface, sensors, sign, , cyberspace, symbol, elements, interactive, circle, data, graphic, digital, hud, technology, illustration, chart, system, visualization, panel, futuristic, web design science electronic set control radar navigator aim space virtual navigation statistic game screen counter virtual panel motion sensors interface design te. Interactive chart system illustrations Futuristic black and white HUD, virtual touch user interface in flat design. Display, dashboard, target, innovation, user, interface, sensors, sign, , cyberspace. Display, dashboard, target, innovation, user, interface, sensors, sign, , cyberspace, symbol, elements, interactive, circle, data, graphic, digital, hud, technology, illustration, chart, system, visualization, panel, futuristic, web design science electronic set control radar navigator aim space virtual navigation statistic game screen counter virtual panel motion sensors interface design te
Free with trial Display, dashboard, target, innovation, user, interface, sensors, sign, , cyberspace, symbol, elements, interactive, circle, data, graphic, digital, hud, technology, illustration, chart, system, visualization, panel, futuristic, web design science electronic set control radar navigator aim space virtual navigation statistic game screen counter virtual panel motion sensors interface design te. Interactive chart system illustrations Futuristic black and white HUD, virtual touch user interface in flat design. Display, dashboard, target, innovation, user, interface, sensors, sign, , cyberspace. Display, dashboard, target, innovation, user, interface, sensors, sign, , cyberspace, symbol, elements, interactive, circle, data, graphic, digital, hud, technology, illustration, chart, system, visualization, panel, futuristic, web design science electronic set control radar navigator aim space virtual navigation statistic game screen counter virtual panel motion sensors interface design te
Free with trial Modern digital health monitoring dashboard displayed on a high-resolution desktop monitor featuring real-time patient analytics, electrocardiogram waveforms, medical performance metrics, and interactive healthcare data visualization in a professional clinical environment. This advanced medical technology concept illustrates the digital transformation of healthcare through intelligent patient monitoring systems, electronic health records, real-time physiological data analysis, and integrated medical dashboards that support faster clinical decision-making and improved patient care. The clean workspace, modern computer display, and sophisticated user interface represent the future of connected healthcare, hospital information systems, and AI-assisted medical monitoring. The dashboard showcases multiple live health indicators including ECG waveforms, heart rhythm monitoring, patient statistics, clinical performance charts, trend analysis, and graphical healthcare analytics presented in a visually organized interface. These elements symbolize the increasing adoption of digital health platforms capable of collecting, processing, and visualizing complex medical information for physicians, nurses, healthcare administrators, researchers, and medical specialists. The combination of colorful medical graphs, biometric indicators, and performance dashboards reflects the growing importance of healthcare informatics, predictive analytics, and data-driven medicine in modern clinical practice. This image represents a wide range of healthcare technology applications including patient monitoring systems, remote patient management, hospital dashboards, telemedicine platforms, electronic medical records, clinical decision support systems, digital diagnostics, healthcare analytics, and smart hospital infrastructure. The visualization demonstrates how healthcare providers can monitor patient conditions continuously, analyze historical trends, identify abnormal vital signs, improve workflow efficiency, and enhance patient safety through advanced digital technologies. The realistic computer interface emphasizes concepts such as digital healthcare transformation, medical software development, healthcare information technology, artificial intelligence in medicine, cloud-based health platforms, hospital management systems, clinical workflow optimization, health data security, medical big data, and intelligent healthcare ecosystems. The modern dashboard also illustrates interoperability between medical devices, centralized patient records, automated reporting systems, and real-time visualization tools that improve communication between healthcare professionals while supporting evidence-based clinical decisions. Ideal for commercial and editorial use, this image is suitable for healthcare technology companies, medical software developers, hospitals, clinics, pharmaceutical organizations, biotechnology firms, research institutions, insurance providers, educational publishers, government health agencies, and digital health startups. It serves as an excellent visual asset for presentations, healthcare reports, medical journals, website banners, advertising campaigns, educational materials, conference publications, corporate communications, and technology demonstrations focusing on innovation in healthcare delivery. The clean office setting, modern workstation, and professional digital interface create a trustworthy atmosphere that reflects reliability, efficiency, and technological advancement. The balanced composition provides generous copy space for headlines, promotional messages, branding elements, educational content, and marketing materials while maintaining strong visual emphasis on the sophisticated medical dashboard and healthcare analytics displayed on the monitor. The realistic lighting and contemporary design enhance the commercial versatility of the image across multiple healthcare and technology industries. This high-quality AI-generated illustration effectively communicates the evolution of healthcare toward intelligent digital ecosystems where real-time patient monitoring, electronic health records, predictive analytics, cloud computing, machine learning, medical visualization, and connected healthcare infrastructure work together to improve diagnostic accuracy, optimize clinical operations, support preventive medicine, enhance patient engagement, reduce healthcare costs, and deliver better medical outcomes. Its modern aesthetic and universal healthcare technology concept make it an ideal choice for stock photography collections, healthcare innovation campaigns, digital medicine publications, health technology marketing, and commercial creative projects focused on the future of connected healthcare and data-driven medical services. Generative Ai. patient, dashboard, health care, datum, monitoring, health, technology, digital, interface, innovation, display, system, software, information, chart, analysis, futuristic, graph, diagnostic, clinical, hospital, care, science, statistic, interactive, design, advanced, performance, research, smart, tracking, ai, management, screen, treatment, virtual, monitor, electronic, diagnosis, solution, professional, control, equipment, device, connectivity, record, signs, medicine, biometric, future, doctor, modern, wellness, clinic, intelligence, vital, brain, assessment, efficiency, cardiology, tool, user, progress, graphic, presentation, glowing, scan, insight, precision, application, integration, communication, signal, anatomy, sensor, model, trend, network, measurement, nurse, operation, oxygen, secure, surgery, optimization, visual, cardiogram, biomedical, tech, laboratory, response, body, remote, wearable, blue, computing, anatomical, touch screen, summary, reporting, emergency, engagement, intelligent, fiction, lung, lighting, facility, connected, physician, pulse, x-ray, therapeutic, programming, dynamic, intensive, security, respiration, infographic, compliance, waveform, alert, algorithm, business, artificial intelligence, workflow, visionary, observation, reality, process, respiratory, platform, engineering, update, clean, hologram, cinematic, machine, exam, human, interaction, heartbeat, detailed, chest, complexity, buttons, database, feedback, innovative, nursing, program, profile, posture, live, learning, organ, practitioner, pressure, report, result, spine, scientific, resource, recovery, resolution, scheme, real, study, trial, therapy, stethoscope, support, stress, code, coordination, clinician, computerized, biology, diaphragm, enhance, documentation, front, focused, experiment, critical. Interactive chart system illustrations Digital Health Monitoring Dashboard with Real-Time Patient Analytics and Medical Data Visualization. Modern digital health monitoring dashboard displayed on a. Modern digital health monitoring dashboard displayed on a high-resolution desktop monitor featuring real-time patient analytics, electrocardiogram waveforms, medical performance metrics, and interactive healthcare data visualization in a professional clinical environment. This advanced medical technology concept illustrates the digital transformation of healthcare through intelligent patient monitoring systems, electronic health records, real-time physiological data analysis, and integrated medical dashboards that support faster clinical decision-making and improved patient care. The clean workspace, modern computer display, and sophisticated user interface represent the future of connected healthcare, hospital information systems, and AI-assisted medical monitoring.The dashboard showcases multiple live health indicators including ECG waveforms, heart rhythm monitoring, patient statistics, clinical performance charts, trend analysis, and graphical healthcare analytics presented in a visually organized interface. These elements symbolize the increasing adoption of digital health platforms capable of collecting, processing, and visualizing complex medical information for physicians, nurses, healthcare administrators, researchers, and medical specialists. The combination of colorful medical graphs, biometric indicators, and performance dashboards reflects the growing importance of healthcare informatics, predictive analytics, and data-driven medicine in modern clinical practice.This image represents a wide range of healthcare technology applications including patient monitoring systems, remote patient management, hospital dashboards, telemedicine platforms, electronic medical records, clinical decision support systems, digital diagnostics, healthcare analytics, and smart hospital infrastructure. The visualization demonstrates how healthcare providers can monitor patient conditions continuously, analyze historical trends, identify abnormal vital signs, improve workflow efficiency, and enhance patient safety through advanced digital technologies.The realistic computer interface emphasizes concepts such as digital healthcare transformation, medical software development, healthcare information technology, artificial intelligence in medicine, cloud-based health platforms, hospital management systems, clinical workflow optimization, health data security, medical big data, and intelligent healthcare ecosystems. The modern dashboard also illustrates interoperability between medical devices, centralized patient records, automated reporting systems, and real-time visualization tools that improve communication between healthcare professionals while supporting evidence-based clinical decisions.Ideal for commercial and editorial use, this image is suitable for healthcare technology companies, medical software developers, hospitals, clinics, pharmaceutical organizations, biotechnology firms, research institutions, insurance providers, educational publishers, government health agencies, and digital health startups. It serves as an excellent visual asset for presentations, healthcare reports, medical journals, website banners, advertising campaigns, educational materials, conference publications, corporate communications, and technology demonstrations focusing on innovation in healthcare delivery.The clean office setting, modern workstation, and professional digital interface create a trustworthy atmosphere that reflects reliability, efficiency, and technological advancement. The balanced composition provides generous copy space for headlines, promotional messages, branding elements, educational content, and marketing materials while maintaining strong visual emphasis on the sophisticated medical dashboard and healthcare analytics displayed on the monitor. The realistic lighting and contemporary design enhance the commercial versatility of the image across multiple healthcare and technology industries.This high-quality AI-generated illustration effectively communicates the evolution of healthcare toward intelligent digital ecosystems where real-time patient monitoring, electronic health records, predictive analytics, cloud computing, machine learning, medical visualization, and connected healthcare infrastructure work together to improve diagnostic accuracy, optimize clinical operations, support preventive medicine, enhance patient engagement, reduce healthcare costs, and deliver better medical outcomes. Its modern aesthetic and universal healthcare technology concept make it an ideal choice for stock photography collections, healthcare innovation campaigns, digital medicine publications, health technology marketing, and commercial creative projects focused on the future of connected healthcare and data-driven medical services. Generative Ai. patient, dashboard, health care, datum, monitoring, health, technology, digital, interface, innovation, display, system, software, information, chart, analysis, futuristic, graph, diagnostic, clinical, hospital, care, science, statistic, interactive, design, advanced, performance, research, smart, tracking, ai, management, screen, treatment, virtual, monitor, electronic, diagnosis, solution, professional, control, equipment, device, connectivity, record, signs, medicine, biometric, future, doctor, modern, wellness, clinic, intelligence, vital, brain, assessment, efficiency, cardiology, tool, user, progress, graphic, presentation, glowing, scan, insight, precision, application, integration, communication, signal, anatomy, sensor, model, trend, network, measurement, nurse, operation, oxygen, secure, surgery, optimization, visual, cardiogram, biomedical, tech, laboratory, response, body, remote, wearable, blue, computing, anatomical, touch screen, summary, reporting, emergency, engagement, intelligent, fiction, lung, lighting, facility, connected, physician, pulse, x-ray, therapeutic, programming, dynamic, intensive, security, respiration, infographic, compliance, waveform, alert, algorithm, business, artificial intelligence, workflow, visionary, observation, reality, process, respiratory, platform, engineering, update, clean, hologram, cinematic, machine, exam, human, interaction, heartbeat, detailed, chest, complexity, buttons, database, feedback, innovative, nursing, program, profile, posture, live, learning, organ, practitioner, pressure, report, result, spine, scientific, resource, recovery, resolution, scheme, real, study, trial, therapy, stethoscope, support, stress, code, coordination, clinician, computerized, biology, diaphragm, enhance, documentation, front, focused, experiment, critical
Free with trial Display, dashboard, target, innovation, user, interface, sensors, sign, , cyberspace, symbol, elements, interactive, circle, data, graphic, digital, hud, technology, illustration, chart, system, visualization, panel, futuristic, web design science electronic set control radar navigator aim space virtual navigation statistic game screen counter virtual panel motion sensors interface design te. Interactive chart system illustrations Futuristic black and white HUD, virtual touch user interface in flat design. Display, dashboard, target, innovation, user, interface, sensors, sign, , cyberspace. Display, dashboard, target, innovation, user, interface, sensors, sign, , cyberspace, symbol, elements, interactive, circle, data, graphic, digital, hud, technology, illustration, chart, system, visualization, panel, futuristic, web design science electronic set control radar navigator aim space virtual navigation statistic game screen counter virtual panel motion sensors interface design te
Free with trial Display, dashboard, target, innovation, user, interface, sensors, sign, , cyberspace, symbol, elements, interactive, circle, data, graphic, digital, hud, technology, illustration, chart, system, visualization, panel, futuristic, web design science electronic set control radar navigator aim space virtual navigation statistic game screen counter virtual panel motion sensors interface design te. Interactive chart system illustrations Futuristic black and white HUD, virtual touch user interface in flat design. Display, dashboard, target, innovation, user, interface, sensors, sign, , cyberspace. Display, dashboard, target, innovation, user, interface, sensors, sign, , cyberspace, symbol, elements, interactive, circle, data, graphic, digital, hud, technology, illustration, chart, system, visualization, panel, futuristic, web design science electronic set control radar navigator aim space virtual navigation statistic game screen counter virtual panel motion sensors interface design te
 Sign in