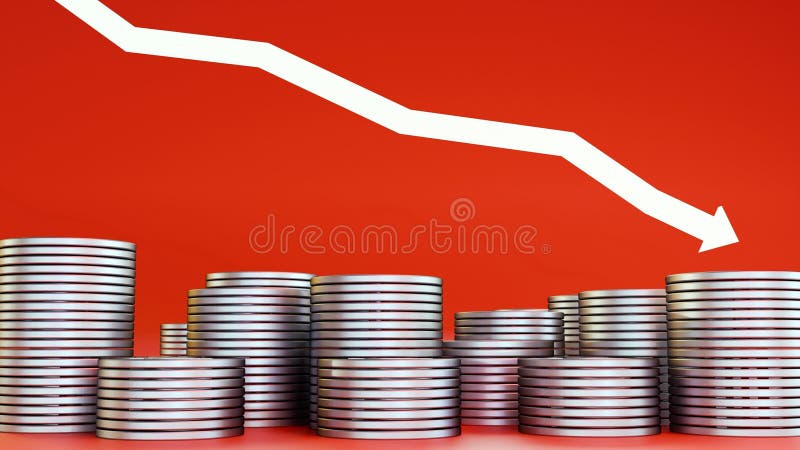
Free with trial 3D rendering of the red arrow and stack of coins, downward financial trend or economic decline. Metaphor for financial loss, market crashes, or decreasing value. Investment decrease illustrations 3D rendering of the red arrow and stack of coins, downward financial trend. 3D rendering of the red arrow and stack of coins, downward financial trend or. 3D rendering of the red arrow and stack of coins, downward financial trend or economic decline. Metaphor for financial loss, market crashes, or decreasing value.
Free with trial 3D rendering of the red arrow and stack of coins, downward financial trend or economic decline. Metaphor for financial loss, market crashes, or decreasing value. Investment decrease illustrations 3D rendering of the red arrow and stack of coins, downward financial trend. 3D rendering of the red arrow and stack of coins, downward financial trend or. 3D rendering of the red arrow and stack of coins, downward financial trend or economic decline. Metaphor for financial loss, market crashes, or decreasing value.
Free with trial Bold downward arrow and coins dropping, representing decline in money value or financial crisis. Ideal for economics, finance, decline, crisis, loss, risk economic issues. Simple flat metaphor. Investment decrease illustrations Downward Financial Trend Illustrated with Falling Coins and Bold Down Arrow. Bold downward arrow and coins dropping, representing decline in money value or. Bold downward arrow and coins dropping, representing decline in money value or financial crisis. Ideal for economics, finance, decline, crisis, loss, risk economic issues. Simple flat metaphor
Free with trial A colorful collection of flat-design icons representing various aspects of budgeting, finance, and personal accounting. Investment decrease illustrations A colorful collection of flat-design icons representing various. Aspects of budgeting, finance, and personal accounting
Free with trial A versatile set of business and finance icons isolated on a white background. This collection features various data visualization elements, including bar charts, line graphs, pie charts, and diagrams. The clean, vector style represents concepts like statistical analysis, market growth, financial reporting, and economic trends. These infographic elements are perfect for presentations, business reports, websites, and marketing materials to illustrate progress, performance, and data-driven insights. Investment decrease vectors Business and Finance Chart and Graph Icon Set. A versatile set of business and finance icons isolated on a white background. This collection features various. A versatile set of business and finance icons isolated on a white background. This collection features various data visualization elements, including bar charts, line graphs, pie charts, and diagrams. The clean, vector style represents concepts like statistical analysis, market growth, financial reporting, and economic trends. These infographic elements are perfect for presentations, business reports, websites, and marketing materials to illustrate progress, performance, and data-driven insights.
Free with trial Vector cartoon 3d percent up and down icon set. Realistic growth, downward percentage red, green sign with arrow. Minimal 3d render rate symbol collection for business chart, financial banking app. Investment decrease vectors Vector cartoon 3d percent up and down icon set. Realistic growth, downward percentage red, green sign with arrow. Minimal 3d render rate symbol collection for
Free with trial Depreciation Icon Flat Vector. Clean and minimal graphic design. Investment decrease vectors Depreciation Icon Flat Vector. Clean and minimal graphic design
Free with trial A 3D illustration depicts financial data analysis. On the left, a purple rectangular panel shows a red downward-trending arrow and a small pie chart with red, yellow, and blue segments. Below it, another purple panel displays a candlestick chart with red and blue bars. To the right, an orange magnifying glass with a turquoise lens hovers, suggesting investigation. The entire composition is set. Investment decrease illustrations 3D Render of Financial Data Visualization with Downward Trend Graph and Magnifying Glass. A 3D illustration depicts financial data analysis. On the left, a. A 3D illustration depicts financial data analysis. On the left, a purple rectangular panel shows a red downward-trending arrow and a small pie chart with red, yellow, and blue segments. Below it, another purple panel displays a candlestick chart with red and blue bars. To the right, an orange magnifying glass with a turquoise lens hovers, suggesting investigation. The entire composition is set
Free with trial A downward trending red arrow, generated by AI, rests on a smartphone displaying a graph, symbolizing a market decline. This visualization is a powerful representation of negative financial trends and economic downturn, ideal for illustrating news reports or financial analyses. Investment decrease illustrations Mobile Market Crash. A downward trending red arrow, generated by AI, rests on a smartphone displaying a graph, symbolizing a market decline. This visualization. A downward trending red arrow, generated by AI, rests on a smartphone displaying a graph, symbolizing a market decline. This visualization is a powerful representation of negative financial trends and economic downturn, ideal for illustrating news reports or financial analyses.
Free with trial A visual representation of negative financial performance and economic downturn. This graphic depicts a sharp decline, indicating losses and a downward trend in market or business metrics. Investment decrease vectors Red downward trending graph with arrow signifying financial decline and economic recession concept. A visual representation of negative financial performance and. A visual representation of negative financial performance and economic downturn. This graphic depicts a sharp decline, indicating losses and a downward trend in market or business metrics
Free with trial Increase percent loan icon doodle illustration. Increase percent loan doodle icon sketch vector. increase percent loan sign. isolated symbol illustration. Investment decrease vectors Increase percent loan icon doodle illustration. Increase percent loan doodle icon sketch vector. increase percent loan sign. isolated symbol illustration
Free with trial Simple hand-drawn chart with black zigzag lines and red and green arrows on White background, showing market movement,. Hand-drawn market trend chart with arrows. Investment decrease illustrations Simple hand-drawn chart with black zigzag lines and red and green arrows on White background, showing market movement,. Hand-drawn market trend chart with arrows
Free with trial This striking image depicts a downward arrow crashing through a globe, symbolizing market decline. The glowing red elements evoke urgency in financial analytics. Investment decrease illustrations Downward Arrow Crashing Through the Globe Concept. This striking image depicts a downward arrow crashing through a globe, symbolizing market decline. The glowing. This striking image depicts a downward arrow crashing through a globe, symbolizing market decline. The glowing red elements evoke urgency in financial analytics
Free with trial Downward arrow, dollar coin, and bar chart showing data. Ideal for finance, economy, loss, budget, analysis statistics and crisis. Flat simple metaphor. Investment decrease vectors Declining Financial Trends Represented by Down Arrow, Dollar Coin, and Bar Chart. Downward arrow, dollar coin, and bar chart showing data. Ideal for finance. Downward arrow, dollar coin, and bar chart showing data. Ideal for finance, economy, loss, budget, analysis statistics and crisis. Flat simple metaphor
Free with trial Business Woman hands typing on laptop with digital falling bar chart and cost percentage icon. Concept of financial cost reduction, business expense management and economic crisis strategy. Investment decrease illustrations Business Woman hands typing on laptop with digital falling bar chart and cost percentage icon. Concept of financial cost reduction. Business expense management. Business Woman hands typing on laptop with digital falling bar chart and cost percentage icon. Concept of financial cost reduction, business expense management and economic crisis strategy
Free with trial Global Economy Sketch - World Globe with Growth and Decline Arrows. Global economic downturn sketch falling arrows, documents around Earth business illustration. Investment decrease illustrations Global Economy Sketch - World Globe with Growth and Decline Arrows. Global economic downturn sketch falling arrows, documents around Earth business illustration
Free with trial Stock Market Loss 3D Icon, Isolated on White Background. Investment decrease illustrations Stock Market Loss 3D Icon. Isolated on White Background
Free with trial A close-up shot of a hand placing a wooden block with the letter C on top of other blocks spelling COST, with a green downward arrow indicating a decrease or reduction in expenses. Investment decrease illustrations Hand arranging wooden blocks spelling COST with a downward arrow, symbolizing cost reduction. A close-up shot of a hand placing a wooden block with the letter C. A close-up shot of a hand placing a wooden block with the letter C on top of other blocks spelling COST, with a green downward arrow indicating a decrease or reduction in expenses
Free with trial A 3D golden bar chart is arranged in a descending sequence, illustrating a downward trend. The bars are polished and reflective, casting subtle shadows on the pure white background. This visual represents a decline in data or financial performance. Investment decrease illustrations Golden Bar Chart Showing Downward Trend on White Background graph metallic. A 3D golden bar chart is arranged in a descending sequence, illustrating a downward. A 3D golden bar chart is arranged in a descending sequence, illustrating a downward trend. The bars are polished and reflective, casting subtle shadows on the pure white background. This visual represents a decline in data or financial performance
Free with trial Business professional analyzing cost data with a magnifying glass over financial charts and graphs indicating market trends and growth opportunities. Glyphic. Investment decrease illustrations Business professional analyzing cost data with a magnifying glass over financial charts and graphs indicating market. Trends and growth opportunities. Glyphic
Free with trial Businessman Struggling with Falling Profits and Financial Crisis, Business Loss Concept, illustration. Investment decrease illustrations Businessman Struggling with Falling Profits and Financial Crisis, Business Loss Concept. Illustration
Free with trial A visual representation of a stock market candlestick chart is depicted with a downward trend. The chart features alternating red and green candlesticks, indicating price fluctuations. A subtle shadow is cast on the white background, adding depth to the financial data visualization. Investment decrease illustrations Downward Trending Stock Market Candlestick Chart with Red and Green Bars and Shadow finance. A visual representation of a stock market candlestick chart is. A visual representation of a stock market candlestick chart is depicted with a downward trend. The chart features alternating red and green candlesticks, indicating price fluctuations. A subtle shadow is cast on the white background, adding depth to the financial data visualization
Free with trial Vector depicting rising fuel costs and economic inflation with a gas pump nozzle dripping fuel over a small car, upward red and blue arrows, bar charts, falling coins, shopping cart, and weight symbols indicating pressure. Isolated on white background in flat modern style. Ideal for articles, presentations and reports about gasoline prices, energy crisis, cost of living, recession, budgeting and financial markets. Investment decrease vectors Rising Fuel Prices and Inflation Economic Concept. Vector depicting rising fuel costs and economic inflation with a gas pump nozzle dripping fuel over a small. Vector depicting rising fuel costs and economic inflation with a gas pump nozzle dripping fuel over a small car, upward red and blue arrows, bar charts, falling coins, shopping cart, and weight symbols indicating pressure. Isolated on white background in flat modern style. Ideal for articles, presentations and reports about gasoline prices, energy crisis, cost of living, recession, budgeting and financial markets.
Free with trial Global Economic Downturn with Falling Graph and Red Arrow, Financial Recession Concept, illustration. Investment decrease vectors Global Economic Downturn with Falling Graph and Red Arrow, Financial Recession Concept. Illustration
Free with trial Tablet displaying financial stock chart against black background. Possible use Stock market analysis. Investment decrease illustrations Stock Market Data on Tablet Displaying Red Bearish Trend Chart and Figures. Tablet displaying financial stock chart against black background. Possible use Stock. Tablet displaying financial stock chart against black background. Possible use Stock market analysis
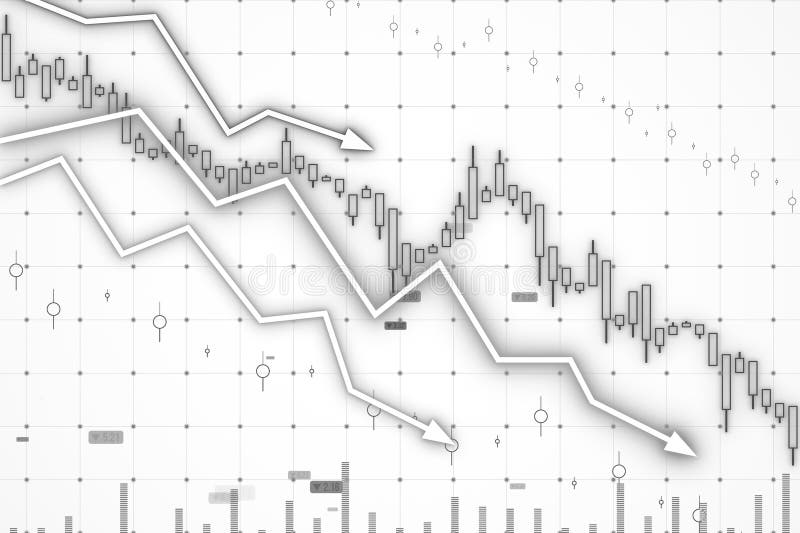
Free with trial Stock crash. This image shows a downward trend in stock prices with candlestick charts and arrows indicating the decline. Vector illustration design using ai. Investment decrease vectors Stock crash. This image shows a downward trend in stock prices with candlestick charts and arrows indicating the decline. Vector illustration design using ai
Free with trial A 3D rendered image features a golden coin with the Indian Rupee symbol prominently displayed. Adjacent to the coin is a blue circular icon containing a white downward-pointing arrow, symbolizing a decline or loss in financial value. The composition is clean and isolated on a white background. Investment decrease illustrations Indian Rupee Symbol Coin with Downward Arrow Icon Indicating Financial Decline currency. A 3D rendered image features a golden coin with the Indian Rupee symbol. A 3D rendered image features a golden coin with the Indian Rupee symbol prominently displayed. Adjacent to the coin is a blue circular icon containing a white downward-pointing arrow, symbolizing a decline or loss in financial value. The composition is clean and isolated on a white background
Free with trial Black and white line icons on a white background depicting various business finance and technology concepts , creative perspective. Investment decrease vectors Collection of business finance and technology icons including symbols for analysis marketing security and communica. Black and white line icons on a white. Black and white line icons on a white background depicting various business finance and technology concepts , creative perspective
Free with trial A line graph showing a declining stock market trend over time, with a downward sloping orange line and multiple blue and. Investment decrease illustrations Stock Market Decline Graph. A line graph showing a declining stock market trend over time, with a downward sloping orange line and multiple blue and. A line graph showing a declining stock market trend over time, with a downward sloping orange line and multiple blue and.
Free with trial A businessman is actively typing on a modern, transparent laptop, which prominently displays the word Cost alongside a green downward-pointing arrow, illustrating a concept of cost reduction and improved financial efficiency in business operations. Investment decrease illustrations Businessman typing on laptop with Cost and a downward arrow displayed, symbolizing cost reduction and financial efficiency. A businessman is actively typing on a. A businessman is actively typing on a modern, transparent laptop, which prominently displays the word Cost alongside a green downward-pointing arrow, illustrating a concept of cost reduction and improved financial efficiency in business operations
Free with trial Candlestick Chart vector Professional Financial Trading icon or symbol. Investment decrease vectors Candlestick Chart vector Professional Financial Trading icon or symbol. Candlestick Chart vector Professional Financial Trading concept icon or symbol
Free with trial Golden jewelry with a down and growth arrows. Price of gold. Investment decrease illustrations Golden jewelry with a down and growth arrows. Price of gold
Free with trial Scale with illustrations of cash and home stocks. The concept of inflation. Stock Illustration. Home price is decrease. Investment decrease vectors Scale with illustrations of cash and home stocks. The concept of inflation. Stock Illustration. Home price is decrease
Free with trial Conceptual image representing cost cutting and financial analysis. Investment decrease illustrations Cost Cutting Analysis Scissors Cutting Downward Graph Under Magnifier. Conceptual image representing cost cutting and financial analysis. Conceptual image representing cost cutting and financial analysis.
Free with trial Conceptual design showing a security analysis of a declining graph. Investment decrease illustrations Data Security Analysis Declining Graph Under Magnifying Glass. Conceptual design showing a security analysis of a declining graph. Conceptual design showing a security analysis of a declining graph.
Free with trial A simple line drawing shows a magnifying glass focused on a declining bar graph with a downward arrow and a star. Investment decrease illustrations Declining Graph Analysis Magnifying Glass, Star, Downward Trend. A simple line drawing shows a magnifying glass focused on a declining bar graph with a downward. A simple line drawing shows a magnifying glass focused on a declining bar graph with a downward arrow and a star.
Free with trial Futuristic Robot Hand Interacting with Cost Analysis Concepts on Digital Screen in Modern Business Environment Quark. Investment decrease illustrations Futuristic Robot Hand Interacting with Cost Analysis Concepts on Digital Screen in Modern Business Environment Quark.
Free with trial Concept illustrating economic downturn. The image shows wooden blocks that spell out economy, partially collapsed and a red arrow pointing downwards, against a neutral backdrop. It conveys crisis, recession, financial challenges, and market decline. Useful for illustrating financial news, economic a. Investment decrease illustrations Economy Downturn Concept, Wooden Blocks with Letters and Red Arrow. Business Crisis Illustration. Concept illustrating economic downturn. The image shows wooden. Concept illustrating economic downturn. The image shows wooden blocks that spell out economy, partially collapsed and a red arrow pointing downwards, against a neutral backdrop. It conveys crisis, recession, financial challenges, and market decline. Useful for illustrating financial news, economic a
Free with trial A vector illustration of a gold coin with a dollar sign, flanked by two red downward arrows, symbolizing financial decline, economic loss, or market downturn. Investment decrease vectors Financial Decline Icon â€\' Dollar Coin with Downward Arrows. A vector illustration of a gold coin with a dollar sign, flanked by two red downward arrows. A vector illustration of a gold coin with a dollar sign, flanked by two red downward arrows, symbolizing financial decline, economic loss, or market downturn
Free with trial Up and down curved arrow chart icon illustration. Business trend bar symbol in black circle. Investment decrease vectors Up and down curved arrow chart icon. Business trend bar symbol in black circle. Up and down curved arrow chart icon illustration. Business trend bar symbol in. Up and down curved arrow chart icon illustration. Business trend bar symbol in black circle
Free with trial Stacks of coins on laptop with stock market graph. Ai Generated. Investment decrease illustrations Stacks of coins on laptop with stock market graph. Ai Generated
Free with trial A businessman wearing a suit analyzes cost reduction versus quality improvement He uses both a laptop and a tablet computer to look at the data and see how these two factors interact to produce the best result for his company and business dealings shown with a graph of numbers going up and down. Investment decrease illustrations Cost reduction and quality improvement shown with businessman analyzing data on devices. A businessman wearing a suit analyzes cost reduction versus quality. A businessman wearing a suit analyzes cost reduction versus quality improvement He uses both a laptop and a tablet computer to look at the data and see how these two factors interact to produce the best result for his company and business dealings shown with a graph of numbers going up and down
Free with trial A yellow 3D percentage symbol and a downward pointing arrow are shown against a. Isolated on a transparent background. Investment decrease vectors Yellow Percentage Symbol and Down Arrow isolated on a transparent background image. A yellow 3D percentage symbol and a downward pointing arrow are shown against. A yellow 3D percentage symbol and a downward pointing arrow are shown against a . Isolated on a transparent background
Free with trial The image shows a stylized financial graph with a clear downward trend, rendered in a copper-like material. it sits on a polished floor in a modern interior. the background features a blurred living space, including a window with bright light, a desk, a chair, and a lamp. the graph's reflection is visible on the floor, enhancing the visual impact of the economic decline. the overall mood is somber, reflecting the negative financial trend. Investment decrease illustrations Financial downturn in modern interior space. The image shows a stylized financial graph with a clear downward trend, rendered in a copper-like material. it sits. the image shows a stylized financial graph with a clear downward trend, rendered in a copper-like material. it sits on a polished floor in a modern interior. the background features a blurred living space, including a window with bright light, a desk, a chair, and a lamp. the graph's reflection is visible on the floor, enhancing the visual impact of the economic decline. the overall mood is somber, reflecting the negative financial trend.
Free with trial The image shows a descending stack of gold coins from left to right, symbolizing a reduction in value or wealth. A bold red downward arrow overlays the coins, emphasizing a trend of decline or loss, often associated with financial downturns or devaluation. Investment decrease illustrations Decreasing stack of gold coins with downward trend arrow indicating financial decline. The image shows a descending stack of gold coins from left to right. The image shows a descending stack of gold coins from left to right, symbolizing a reduction in value or wealth. A bold red downward arrow overlays the coins, emphasizing a trend of decline or loss, often associated with financial downturns or devaluation
Free with trial Businessman holds smartphone displaying an image of a global economic recession, with a red downward pointing arrow and a declining employment graph, signifying an economic crisis, financial losses. Investment decrease illustrations Businessman holds smartphone displaying an image of a global economic recession, with a red downward pointing arrow and a. Declining employment graph. Businessman holds smartphone displaying an image of a global economic recession, with a red downward pointing arrow and a declining employment graph, signifying an economic crisis, financial losses
Free with trial Business bar graph icon vector with upward and downward arrow. Trend analysis symbol with long shadow. Investment decrease vectors Business bar graph icon with upward and downward arrow. Trend analysis symbol with long shadow. Business bar graph icon vector with upward and downward arrow. Business bar graph icon vector with upward and downward arrow. Trend analysis symbol with long shadow
Free with trial Downward arrow next to a dollar coin with clouds above, representing financial decline, recession, savings, budgeting, investments, economy, business risks, and simplicity in flat metaphor. Investment decrease vectors Economic Downturn Concept with Dollar Coin, Arrow, and Cloud Visual Elements. Downward arrow next to a dollar coin with clouds above, representing financial. Downward arrow next to a dollar coin with clouds above, representing financial decline, recession, savings, budgeting, investments, economy, business risks, and simplicity in flat metaphor
Free with trial A 3D golden percentage symbol on white background, ideal for financial and business presentations. High-quality render. Investment decrease illustrations Golden percentage symbol isolated on white background for finance. A 3D golden percentage symbol on white background, ideal for financial and business. A 3D golden percentage symbol on white background, ideal for financial and business presentations. High-quality render
Free with trial A stylized 3D business growth chart depicted against a light blue background. The chart features a blue mountain-like shape representing a peak, with two intersecting lines. One line, marked with pink nodes, shows fluctuations, while another line with green nodes indicates a general upward trend. This visual metaphor conveys concepts of business performance, market trends, and financial analysis. Investment decrease illustrations 3D Stylized Business Growth Chart with Red and Green Nodes on Blue Background graph data. A stylized 3D business growth chart depicted against a light blue. A stylized 3D business growth chart depicted against a light blue background. The chart features a blue mountain-like shape representing a peak, with two intersecting lines. One line, marked with pink nodes, shows fluctuations, while another line with green nodes indicates a general upward trend. This visual metaphor conveys concepts of business performance, market trends, and financial analysis
Free with trial Three stacks of coins labeled 'OP' and 'OM' are shown with a downward arrow above them, indicating a decrease in value or a financial downturn. Investment decrease illustrations Coins with labels and downward arrow isolated on white background. Three stacks of coins labeled 'OP' and 'OM' are shown with a downward arrow above them. Three stacks of coins labeled 'OP' and 'OM' are shown with a downward arrow above them, indicating a decrease in value or a financial downturn
Free with trial This image, generated by AI, depicts a downward trending graph inside a caged cube, symbolizing economic downturn. A jar of coins nearby further emphasizes the financial implications. The red arrow dramatically highlights the severity of the decline. Investment decrease illustrations Declining Economy: AI. This image, generated by AI, depicts a downward trending graph inside a caged cube, symbolizing economic downturn. A jar of coins nearby. This image, generated by AI, depicts a downward trending graph inside a caged cube, symbolizing economic downturn. A jar of coins nearby further emphasizes the financial implications. The red arrow dramatically highlights the severity of the decline.
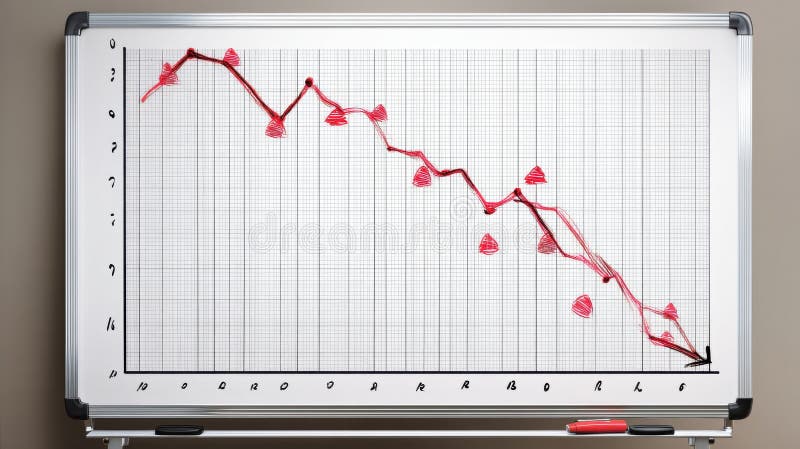
Free with trial A whiteboard displays a hand-drawn graph depicting a significant downward trend, marked by red triangles indicating decreasing values. This visual representation of a negative trend was generated by AI for illustrative purposes, possibly showcasing market decline or economic downturn. Investment decrease illustrations Downward Trend Graph. A whiteboard displays a hand-drawn graph depicting a significant downward trend, marked by red triangles indicating decreasing values. This. A whiteboard displays a hand-drawn graph depicting a significant downward trend, marked by red triangles indicating decreasing values. This visual representation of a negative trend was generated by AI for illustrative purposes, possibly showcasing market decline or economic downturn.
Free with trial Dynamic data visualization, red and green chart analysis on wall display. Data visualization with red and green chart on a wall display ,Generative ai. Investment decrease illustrations Dynamic data visualization, red and green chart analysis on wall display. Data visualization with red and green chart on a wall display ,Generative ai
Free with trial Three stacks of golden coins are arranged on a white surface. A prominent red arrow, indicating a downward trend, is positioned diagonally above the coins, pointing towards the right. The arrow's sharp angles and vibrant red color convey a sense of financial decline or loss. The coins are depicted in varying heights, with a single coin resting on top of the middle stack. Investment decrease illustrations Red downward trending graph arrow over stacks of gold coins on a white background finance. Three stacks of golden coins are arranged on a white surface. A. Three stacks of golden coins are arranged on a white surface. A prominent red arrow, indicating a downward trend, is positioned diagonally above the coins, pointing towards the right. The arrow's sharp angles and vibrant red color convey a sense of financial decline or loss. The coins are depicted in varying heights, with a single coin resting on top of the middle stack
Free with trial Dollar symbols set. Market trend Vector. Dollars rate variation. Currency arrow movement. Manual vector only. No autotrace used. EPS 10. Investment decrease vectors Dollar symbols set. Market trend Vector. Dollars rate variation. Currency arrow movement. Manual vector only. No autotrace used. EPS 10
Free with trial Graph showing a line that is green and has a black background. The line is going up and to the right AI generated. Investment decrease illustrations Graph showing a line that is green and has a black background. The line is going up and to the right AI generated
Free with trial A 3D render depicts a golden bar chart with bars decreasing in height from left to right. A downward-sloping golden arrow intersects the chart, pointing towards the right and downwards. A large, shiny golden coin with a dollar sign is positioned on the arrow, emphasizing a financial decline or loss. The image is set against a clean white background. Investment decrease illustrations Golden Downward Trend Arrow and Bar Chart with Dollar Coin Symbolizing Financial Decline. A 3D render depicts a golden bar chart with bars decreasing in height. A 3D render depicts a golden bar chart with bars decreasing in height from left to right. A downward-sloping golden arrow intersects the chart, pointing towards the right and downwards. A large, shiny golden coin with a dollar sign is positioned on the arrow, emphasizing a financial decline or loss. The image is set against a clean white background
Free with trial A black downward trending arrow with the text recession risk below it on a white background. Investment decrease illustrations Downward trending arrow indicating recession risk on white background economy financial. A black downward trending arrow with the text recession risk below it on. A black downward trending arrow with the text recession risk below it on a white background
Free with trial Financial loss, business decline, economic downturn, money flow, financial risk, currency. Blue arrow turning downwards and coins falling. Financial loss and business decline concept. Investment decrease vectors Financial Loss Concept with Blue Arrow and Falling Coins Business Decline. Financial loss, business decline, economic downturn, money flow, financial risk. Financial loss, business decline, economic downturn, money flow, financial risk, currency. Blue arrow turning downwards and coins falling. Financial loss and business decline concept
Free with trial A red 3D percentage symbol next to a white 3D downward pointing arrow. Isolated on a transparent background. Investment decrease vectors Red percentage sign and white down arrow isolated on a transparent background image. A red 3D percentage symbol next to a white 3D downward pointing arrow. A red 3D percentage symbol next to a white 3D downward pointing arrow. Isolated on a transparent background
Free with trial Interest rate line icons on white, eps 10 file, easy to edit. Investment decrease vectors Interest rate line icons on white. Eps 10 file, easy to edit
Free with trial Businesswoman pulls meter with rope to reduce risk or stress level. Describes reducing the risk level, reducing the anxiety meter and lowering the danger indicator. Business, work and career concept. Investment decrease vectors Businesswoman pulls meter with rope to reduce risk or stress level. Describes reducing the risk level, reducing the anxiety meter and lowering the danger
Free with trial Downward red arrow pointing at oil barrel showing falling oil prices. Oil prices are falling down. Crude oil prices declined and impact on economy. Investment decrease vectors Downward red arrow pointing at oil barrel showing falling oil prices. Oil prices are falling down. Crude oil prices declined and impact on economy
Free with trial Red stock market graph plummets on a laptop keyboard, indicating financial loss and market decline, great for business and finance themes. Investment decrease illustrations Stock market crash data on laptop keyboard. Red stock market graph plummets on a laptop keyboard, indicating financial loss and market decline, great for. Red stock market graph plummets on a laptop keyboard, indicating financial loss and market decline, great for business and finance themes
Free with trial A visual representation of cost reduction, featuring decreasing stacks of gold coins with wooden blocks spelling COST and a prominent red downward arrow, symbolizing financial savings and efficiency. Investment decrease illustrations Cost Reduction Concept with Stacks of Coins and Wooden Blocks Spelling COST with a Downward Arrow. A visual representation of cost reduction, featuring. A visual representation of cost reduction, featuring decreasing stacks of gold coins with wooden blocks spelling COST and a prominent red downward arrow, symbolizing financial savings and efficiency
Free with trial Businessman Presenting Digital Graph Illustrating Cost Reduction Trends with Dollar Signs and Decreasing Bar Chart in Modern Office Environment. Bitwise. Investment decrease illustrations Businessman Presenting Digital Graph Illustrating Cost Reduction Trends with Dollar Signs and Decreasing Bar Chart in. Modern Office Environment. Bitwise
Free with trial Financial market analysis with data charts and line graphs in blue tone. A dynamic display of market trends with charts and graphs in a cool blue color scheme. Investment decrease illustrations Financial market analysis with data charts and line graphs in blue tone. A dynamic display of market trends with charts and graphs in a cool blue color scheme
Free with trial A minimalist studio shot featuring a series of metallic spheres arranged in a line on a reflective grey surface. The spheres decrease in size from left to right, showcasing different finishes: a large textured silver ball, a smooth chrome sphere, and a progression of highly reflective gold balls. The clean white background emphasizes the objects, creating a sense of order, progression, and comparison. Ideal for concepts of growth, decline, hierarchy, or abstract design. Generated by AI. Investment decrease illustrations Metallic Spheres Progression: Gold and Silver Balls in Decreasing Size. A minimalist studio shot featuring a series of metallic spheres arranged in a line on a. A minimalist studio shot featuring a series of metallic spheres arranged in a line on a reflective grey surface. The spheres decrease in size from left to right, showcasing different finishes: a large textured silver ball, a smooth chrome sphere, and a progression of highly reflective gold balls. The clean white background emphasizes the objects, creating a sense of order, progression, and comparison. Ideal for concepts of growth, decline, hierarchy, or abstract design. Generated by AI
Free with trial Vector illustration of a bitcoin falling icon with red arrows and halftone texture. Symbol of crypto crash, market decline, and financial loss. Isolated on white background. Investment decrease vectors Vector illustration of a bitcoin falling icon with red arrows and halftone texture. Symbol of crypto crash, market. Decline, and financial loss. Isolated on
Free with trial A stylized declining bar chart with a downward arrow on a red, yellow, and dark backdrop, conveying a sense of financial loss. Investment decrease illustrations Declining bar chart with arrow on a red yellow and dark backdrop. A stylized declining bar chart with a downward arrow on a red, yellow, and dark backdrop. a stylized declining bar chart with a downward arrow on a red, yellow, and dark backdrop, conveying a sense of financial loss
Free with trial Risk Management Analysis Graph with Warning Signs, generative Ai. Investment decrease illustrations Risk Management Analysis Graph with Warning Signs. Generative Ai
Free with trial Abstract 3D render of a descending bar chart made of blue glass rectangles. The bars are reflected on a glossy surface, creating a clean and modern aesthetic. The image can be used to represent data visualization, financial trends, business performance, or concepts like decline, recession, or negative growth. The cool blue color palette adds a sense of calm and professionalism. Investment decrease illustrations Abstract Blue Glass Bar Chart. Abstract 3D render of a descending bar chart made of blue glass rectangles. The bars are reflected on a glossy surface, creating a. Abstract 3D render of a descending bar chart made of blue glass rectangles. The bars are reflected on a glossy surface, creating a clean and modern aesthetic. The image can be used to represent data visualization, financial trends, business performance, or concepts like decline, recession, or negative growth. The cool blue color palette adds a sense of calm and professionalism.
Free with trial A bright yellow, three-dimensional percentage symbol is displayed prominently against a clean white background. The symbol has a smooth, rounded appearance, suggesting a modern and approachable design, suitable for financial or promotional contexts. Investment decrease illustrations Yellow 3D Percentage Symbol on a White Background sign. A bright yellow, three-dimensional percentage symbol is displayed prominently against a clean white. A bright yellow, three-dimensional percentage symbol is displayed prominently against a clean white background. The symbol has a smooth, rounded appearance, suggesting a modern and approachable design, suitable for financial or promotional contexts
Free with trial A line drawing depicts a magnifying glass focusing on a house icon and a descending bar graph, symbolizing a real. Investment decrease illustrations Real Estate Market Downturn House Value Decline Under Scrutiny. A line drawing depicts a magnifying glass focusing on a house icon and a descending bar graph. A line drawing depicts a magnifying glass focusing on a house icon and a descending bar graph, symbolizing a real.
Free with trial Robotic Hand Holding Computer Display with Cost Reduction Concept, Analyzing Data and Strategies for Business Growth in Digital World Quark. Investment decrease illustrations Robotic Hand Holding Computer Display with Cost Reduction Concept, Analyzing Data and Strategies for Business Growth in. Digital World Quark
Free with trial A robotic hand extends toward dynamic financial graphs and data in a cosmic setting. This image symbolizes the intersection of technology and finance, showcasing innovation. Scalp. Investment decrease illustrations Futuristic robotic hand reaching towards digital financial graphs and data visualizations in a cosmic background with. A robotic hand extends toward dynamic. A robotic hand extends toward dynamic financial graphs and data in a cosmic setting. This image symbolizes the intersection of technology and finance, showcasing innovation. Scalp
Free with trial An upward trending bar graph displayed on a laptop screen, illuminated against a backdrop of blurred city lights at night. Shows financial success and progress. Investment decrease illustrations Financial Growth Chart on Laptop Screen at Night. An upward trending bar graph displayed on a laptop screen, illuminated against a backdrop of blurred city. An upward trending bar graph displayed on a laptop screen, illuminated against a backdrop of blurred city lights at night. Shows financial success and progress.
Free with trial Declining stock market trend illustration. 3D Rendering. A graph showing a downward trend on a grid background. Investment decrease illustrations Declining stock market trend illustration. 3D Rendering. A graph showing a downward trend on a grid background. 3D Rendering
Free with trial This illustration, generated by AI, depicts a piggy bank nestled in caring hands, with coins flowing in and out, symbolizing the dynamic nature of saving and spending. The image is vibrant and playful, ideal for illustrating financial concepts related to budgeting and money management. Investment decrease illustrations AI-Generated Piggy Bank Savings. This illustration, generated by AI, depicts a piggy bank nestled in caring hands, with coins flowing in and out, symbolizing the. This illustration, generated by AI, depicts a piggy bank nestled in caring hands, with coins flowing in and out, symbolizing the dynamic nature of saving and spending. The image is vibrant and playful, ideal for illustrating financial concepts related to budgeting and money management.
 Sign in