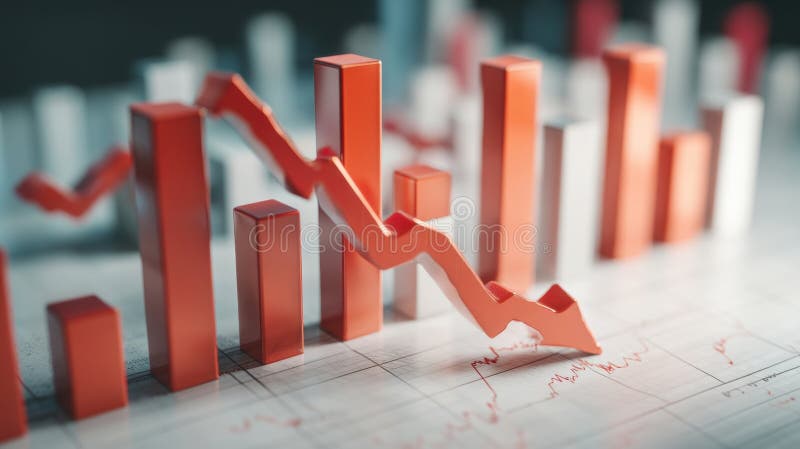
Free with trial A 3D financial visualization showing a sharp economic decline. A red downward arrow crashes through green and red bar charts, representing market loss, recession, and the impact on workforce and societ. Investment decrease illustrations 3D Economic Crisis Graph with Falling Red Arrow and People Icons. A 3D financial visualization showing a sharp economic decline. A red downward arrow crashes. A 3D financial visualization showing a sharp economic decline. A red downward arrow crashes through green and red bar charts, representing market loss, recession, and the impact on workforce and societ
Free with trial A 3D financial visualization showing a sharp economic decline. A red downward arrow crashes through green and red bar charts, representing market loss, recession, and the impact on workforce and societ. Investment decrease illustrations 3D Economic Crisis Graph with Falling Red Arrow and People Icons. A 3D financial visualization showing a sharp economic decline. A red downward arrow crashes. A 3D financial visualization showing a sharp economic decline. A red downward arrow crashes through green and red bar charts, representing market loss, recession, and the impact on workforce and societ
Free with trial A 3D financial visualization showing a sharp economic decline. A red downward arrow crashes through green and red bar charts, representing market loss, recession, and the impact on workforce and societ. Investment decrease illustrations 3D Economic Crisis Graph with Falling Red Arrow and People Icons. A 3D financial visualization showing a sharp economic decline. A red downward arrow crashes. A 3D financial visualization showing a sharp economic decline. A red downward arrow crashes through green and red bar charts, representing market loss, recession, and the impact on workforce and societ
Free with trial The image shows a red line graph sharply decreasing against a backdrop of a city skyline. A light blue line graph also shows a downward trend. Several stylized coronavirus illustrations are superimposed on the image. The overall color palette is cool toned, with the red graph line providing a stark contrast. The style is graphic and illustrative, suggesting a visual representation of economic, generated by AI. Investment decrease illustrations Red Decreasing Stock Market Graph Cityscape Coronavirus. The image shows a red line graph sharply decreasing against a backdrop of a city skyline. A light blue. The image shows a red line graph sharply decreasing against a backdrop of a city skyline. A light blue line graph also shows a downward trend. Several stylized coronavirus illustrations are superimposed on the image. The overall color palette is cool toned, with the red graph line providing a stark contrast. The style is graphic and illustrative, suggesting a visual representation of economic, generated by AI.
Free with trial Handmade origami style 3d chart showing falling trend. sharp pointed white paper sculpture casting shadows on flat surface. minimalist conceptual photography. economic crisis representation. business failure metaphor. clean architectural paper design. Investment decrease illustrations Creative paper art representing white downward arrow graph on light blue background symbolizing financial decline or recession. Handmade origami style 3d chart. Handmade origami style 3d chart showing falling trend. sharp pointed white paper sculpture casting shadows on flat surface. minimalist conceptual photography. economic crisis representation. business failure metaphor. clean architectural paper design
Free with trial Metallic 3D percent symbol on clean background. A metallic 3D rendered percentage sign against a plain, neutral backdrop. Investment decrease illustrations Metallic 3D percent symbol on clean background. A metallic 3D rendered percentage sign against a plain, neutral backdrop
Free with trial An unstable business situation. A businessman flying in a balloon symbolizes success, while another businessman descending symbolizes business failure. Investment decrease vectors The business situation is fluctuating and unstable. An unstable business situation. A businessman flying in a balloon symbolizes success, while another. An unstable business situation. A businessman flying in a balloon symbolizes success, while another businessman descending symbolizes business failure
Free with trial Red arrow going down stock icon on white background. Bankruptcy, financial market crash icon for your web site design, logo, app, UI. graph chart down trend symbol. chart going down sign. Investment decrease vectors Red arrow going down stock icon on white background. Bankruptcy, financial market crash icon for your web site design. Logo, app, UI. graph chart down trend. Red arrow going down stock icon on white background. Bankruptcy, financial market crash icon for your web site design, logo, app, UI. graph chart down trend symbol.chart going down sign.
Free with trial Red arrow going down stock icon on white background. Bankruptcy, financial market crash icon for your web site design, logo, app, UI. graph chart down trend symbol. chart going down sign. Investment decrease vectors Red arrow going down stock icon on white background. Bankruptcy, financial market crash icon for your web site design. Red arrow going down stock icon on white. Red arrow going down stock icon on white background. Bankruptcy, financial market crash icon for your web site design, logo, app, UI. graph chart down trend symbol.chart going down sign.
Free with trial A 3D rendered image displays a large white dollar sign ($) centered on a vibrant purple circle. Flanking the central circle are two smaller white circles, one containing a green upward-pointing arrow and the other a red downward-pointing arrow. This composition visually represents financial concepts like currency exchange, market fluctuations, or profit and loss. Investment decrease illustrations 3D Dollar Sign with Up and Down Arrows on Purple and White Circles currency money. A 3D rendered image displays a large white dollar sign ($) centered on a. A 3D rendered image displays a large white dollar sign ($) centered on a vibrant purple circle. Flanking the central circle are two smaller white circles, one containing a green upward-pointing arrow and the other a red downward-pointing arrow. This composition visually represents financial concepts like currency exchange, market fluctuations, or profit and loss
Free with trial A stark white 3D representation of a jagged line graph is depicted against a clean white background. The graph's peaks and valleys form a distinct downward trend, suggesting a decline or loss. The sharp angles and minimalist design emphasize the concept of a negative trajectory. The object casts a subtle shadow, adding depth and dimension to the isolated graphic. Investment decrease illustrations White 3D Jagged Line Graph Showing Downward Trend on White Background chart decline. A stark white 3D representation of a jagged line graph is depicted against a. A stark white 3D representation of a jagged line graph is depicted against a clean white background. The graph's peaks and valleys form a distinct downward trend, suggesting a decline or loss. The sharp angles and minimalist design emphasize the concept of a negative trajectory. The object casts a subtle shadow, adding depth and dimension to the isolated graphic
Free with trial Digital illustration depicting a financial decline with red downward-trending graphs, coin stacks, and scattered currency symbols. Set against a dark grid background with neon highlights, this image conveys themes of market loss, economic recession, and financial analysis—ideal for business, editorial, and presentation use. Investment decrease illustrations Economic Downturn Illustration Red Decline Graph with Coin Stacks on Digital Grid. Digital illustration depicting a financial decline with red downward-trending. Digital illustration depicting a financial decline with red downward-trending graphs, coin stacks, and scattered currency symbols. Set against a dark grid background with neon highlights, this image conveys themes of market loss, economic recession, and financial analysis—ideal for business, editorial, and presentation use.
Free with trial This image presents a visual representation of fluctuating percentages a common motif in discussions about market trends economic shifts and financial performance. The composition features a series of upward and downward pointing arrows paired with percentage symbols conveying the dynamic nature of change and volatility. The red and black colors create a clear distinction between positive and. Investment decrease vectors Fluctuating Percentages Illustrating Market Trends and Economic Shifts in Detail. This image presents a visual representation of fluctuating percentages a common. This image presents a visual representation of fluctuating percentages a common motif in discussions about market trends economic shifts and financial performance. The composition features a series of upward and downward pointing arrows paired with percentage symbols conveying the dynamic nature of change and volatility. The red and black colors create a clear distinction between positive and
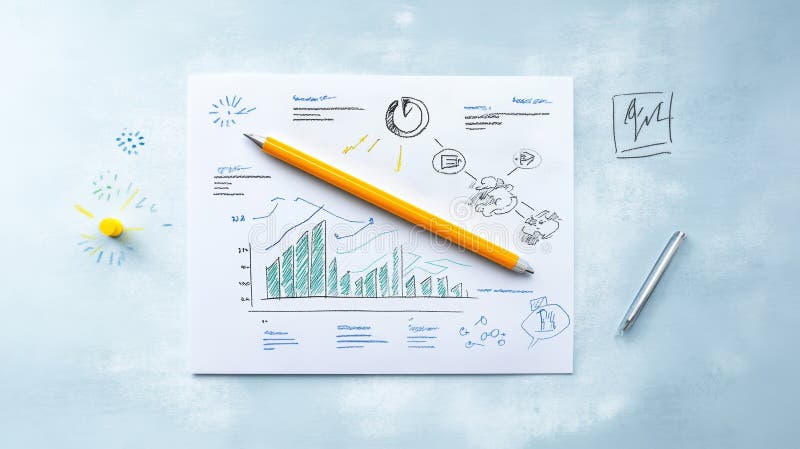
Free with trial Pencil and paper, a detailed illustration of graph for data analysis visualization. Graph depiction on paper with a pencil ,Generative ai. Investment decrease illustrations Pencil and paper, a detailed illustration of graph for data analysis visualization. Graph depiction on paper with a pencil ,Generative ai
Free with trial Blue letter s symbol indicating decline or financial loss. Glossy blue letter S symbol isolated on white background representing finance or a downward trend AI. Investment decrease illustrations Blue letter s symbol indicating decline or financial loss. Glossy blue letter S symbol isolated on white background representing finance or a downward trend AI
Free with trial This image was created using Generative AI. Black icon of hand holding money bag with dollar sign and motion arrow indicating financial expenditure or economic decline. Investment decrease vectors Money bag in hand with moving arrow symbolizing financial loss or spending. This image was created using Generative AI. Black icon of hand holding money bag with. This image was created using Generative AI. Black icon of hand holding money bag with dollar sign and motion arrow indicating financial expenditure or economic decline
Free with trial A red arrow pointing down over a row of decreasing gold coins. Generative AI. Investment decrease illustrations A red arrow pointing down over a row of decreasing gold coins. Generative AI.
Free with trial A collection of black silhouette icons representing financial crisis, economic hardship, and personal debt on a clean white background. The set includes a person carrying a heavy debt weight, a broken downward arrow, a cracked piggy bank, a protective shield with an umbrella, gears with a wrench, a locked padlock with a dollar sign, and a stressed individual under a storm cloud. These minimalist vector graphics are ideal for articles, presentations, and websites focusing on bankruptcy, inflation, insurance, financial planning, and economic recession. Investment decrease vectors Financial Crisis and Economic Debt Vector Icon Set. A collection of black silhouette icons representing financial crisis, economic hardship, and personal debt on. A collection of black silhouette icons representing financial crisis, economic hardship, and personal debt on a clean white background. The set includes a person carrying a heavy debt weight, a broken downward arrow, a cracked piggy bank, a protective shield with an umbrella, gears with a wrench, a locked padlock with a dollar sign, and a stressed individual under a storm cloud. These minimalist vector graphics are ideal for articles, presentations, and websites focusing on bankruptcy, inflation, insurance, financial planning, and economic recession.
Free with trial Trend chart icon in circular outline. Growth and decline symbol. Up and down arrow with bar graph. Illustration. Investment decrease vectors Trend chart icon in circular outline. Growth and decline symbol. Up and down arrow with bar graph. Illustration
Free with trial Stack of coins with downward trending graph arrow. A metallic downward trending graph arrow resting on a stack of silver coins against a white background. Investment decrease illustrations Stack of coins with downward trending graph arrow. A metallic downward trending graph arrow resting on a stack of silver coins against a white background
Free with trial Flaming red arrow pointing down on an earth globe. Global financial crisis, market crash, or economic downturn. World economy analysis. Investment decrease illustrations Flaming red arrow pointing down on an earth globe. Global financial crisis, market crash, or economic downturn. World economy analysis
Free with trial A comprehensive collection of flat icons illustrating various data visualization concepts, including bar charts, line graphs, area charts, scatter plots, and distribution curves. The set features directional arrows symbolizing growth, trends, and strategic planning. Designed with a clean, modern aesthetic using a palette of blue, green, yellow, and orange, these icons are ideal for business presentations, financial reports, infographics, dashboards, and corporate branding materials. Investment decrease vectors Flat Icon Set of Business Charts and Growth Arrows. A comprehensive collection of flat icons illustrating various data visualization concepts, including bar. A comprehensive collection of flat icons illustrating various data visualization concepts, including bar charts, line graphs, area charts, scatter plots, and distribution curves. The set features directional arrows symbolizing growth, trends, and strategic planning. Designed with a clean, modern aesthetic using a palette of blue, green, yellow, and orange, these icons are ideal for business presentations, financial reports, infographics, dashboards, and corporate branding materials.
Free with trial Profit and loss, entrepreneur sprinting on ascending growth chart and descending recession graph. Investment decrease vectors Profit and loss, entrepreneur sprinting on ascending growth chart and descending recession graph.
Free with trial Stack of gold coins are arranged against a backdrop of a red descending graph line, signifying financial loss, economic downturn, and market challenges. Image is generated using AI. Investment decrease illustrations Stack Of Coins With Falling Graph. Stack of gold coins are arranged against a backdrop of a red descending graph line, signifying financial loss, economic. Stack of gold coins are arranged against a backdrop of a red descending graph line, signifying financial loss, economic downturn, and market challenges. Image is generated using AI
Free with trial A visual representation of financial downturn, showing decreasing stacks of coins and a prominent red downward trending arrow. Investment decrease illustrations Financial decline illustrated by falling coin stacks and red arrow. A visual representation of financial downturn, showing decreasing stacks of coins and a. A visual representation of financial downturn, showing decreasing stacks of coins and a prominent red downward trending arrow
Free with trial Infographic collage illustrating rising fuel prices and economic inflation with multiple line and bar charts showing upward and downward trends. Central image features a fuel pump nozzle over a bold red-orange rising arrow, surrounded by icons of shopping carts, houses, coins, and delivery trucks. Blue, gray, and red graphs depict cost increases. Ideal for articles on energy, economy, inflation, logistics, and financial analysis. Investment decrease vectors Rising Fuel Prices and Inflation Economic Charts. Infographic collage illustrating rising fuel prices and economic inflation with multiple line and bar charts. Infographic collage illustrating rising fuel prices and economic inflation with multiple line and bar charts showing upward and downward trends. Central image features a fuel pump nozzle over a bold red-orange rising arrow, surrounded by icons of shopping carts, houses, coins, and delivery trucks. Blue, gray, and red graphs depict cost increases. Ideal for articles on energy, economy, inflation, logistics, and financial analysis.
Free with trial This image showcases a downward trending graph, generated by AI, represented by a red arrow descending within a transparent glass structure. The visual effectively communicates decline or negative growth. The clean, minimalist design enhances the impact of the falling trend. Investment decrease illustrations Decreasing Trend: AI-Generated Graph. This image showcases a downward trending graph, generated by AI, represented by a red arrow descending within a transparent. This image showcases a downward trending graph, generated by AI, represented by a red arrow descending within a transparent glass structure. The visual effectively communicates decline or negative growth. The clean, minimalist design enhances the impact of the falling trend.
Free with trial A 3D rendering depicts a scale, one side holding euro-shaped rocks, the other a dollar symbol with a downward arrow. The euro side is crumbling, signifying economic instability and the falling value of the euro against the dollar. The image symbolizes the current economic disparity and potential ri. Investment decrease illustrations Euro vs Dollar: Economic Imbalance. A 3D rendering depicts a scale, one side holding euro-shaped rocks, the other a dollar symbol with a downward arrow. The euro. A 3D rendering depicts a scale, one side holding euro-shaped rocks, the other a dollar symbol with a downward arrow. The euro side is crumbling, signifying economic instability and the falling value of the euro against the dollar. The image symbolizes the current economic disparity and potential ri
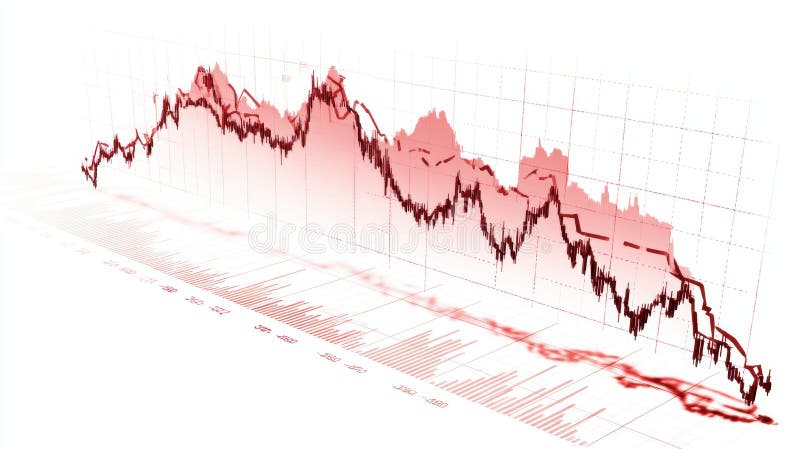
Free with trial This image depicts a dramatic market decline, visualized as a 3D graph showing a sharp downward trend. The red color emphasizes the severity of the losses, and the detailed chart is generated by AI, offering a realistic representation of financial instability. It can be used to illustrate economic. Investment decrease illustrations Red Market Crash Graph. This image depicts a dramatic market decline, visualized as a 3D graph showing a sharp downward trend. The red color emphasizes the. This image depicts a dramatic market decline, visualized as a 3D graph showing a sharp downward trend. The red color emphasizes the severity of the losses, and the detailed chart is generated by AI, offering a realistic representation of financial instability. It can be used to illustrate economic
Free with trial Bear Market Icon Color. Vector Illustration. Stock Price Fall. Arrow On Chart Pointing Down. Bear Head. Stock Market Concept. Investment decrease vectors Bear Market Icon Color. Vector Illustration. Stock Price Fall. Arrow On Chart Pointing Down. Bear Head. Stock Market Concept
Free with trial A downward arrow with a dollar sign in the middle. The image is blue and orange. Investment decrease vectors A downward arrow with a dollar sign in the middle. The image is blue and orange
Free with trial A downward trending bar graph in sand symbolizes economic downturn. A dead branch emphasizes decline and crisis. Financial instability concept. Investment decrease illustrations Declining Business Graph Sand Desert Branch Stock Visual: Financial Crisis Metaphor. A downward trending bar graph in sand symbolizes economic downturn. A dead. A downward trending bar graph in sand symbolizes economic downturn. A dead branch emphasizes decline and crisis. Financial instability concept
Free with trial A businessman in a suit analyzes financial data with a laptop. The concept represents improving quality while reducing costs to optimize business performance and increase profitability. Investment decrease illustrations Businessman analyzing data with cost and quality improvement concept. A businessman in a suit analyzes financial data with a laptop. The concept represents. A businessman in a suit analyzes financial data with a laptop. The concept represents improving quality while reducing costs to optimize business performance and increase profitability
Free with trial Worn oil barrel with red downward graph and spill, symbolizing falling oil prices, market decline, financial losses, and energy sector instability. Generative AI. Investment decrease illustrations Oil Barrel With Falling Price Graph Economic Decline. Worn oil barrel with red downward graph and spill, symbolizing falling oil prices, market decline. Worn oil barrel with red downward graph and spill, symbolizing falling oil prices, market decline, financial losses, and energy sector instability. Generative AI
Free with trial Detailed black and white line art icon depicting a falling bar chart graph with a red cross X mark. Investment decrease vectors Declining bar chart graph with cancel cross mark. Detailed AI generated black and white line art icon depicting a falling bar chart graph with a red cross X mark. Detailed black and white line art icon depicting a falling bar chart graph with a red cross X mark
Free with trial A series of small, stylized houses are arranged in a stepped pattern, each displaying a large golden percentage symbol. They ascend from left to right against a gradient sky. Investment decrease illustrations Miniature houses with percentage symbols arranged in an ascending staircase against a soft sunset sky. A series of small, stylized houses are arranged in a. A series of small, stylized houses are arranged in a stepped pattern, each displaying a large golden percentage symbol. They ascend from left to right against a gradient sky
Free with trial A worried business man and woman analyze a downward-trending red graph on a computer monitor, illustrating financial loss, market decline, or poor performance. This depicts stress, concern, and problem-solving in a professional office setting, suitable for concepts regarding recession, crisis management, stock market drops, or negative business analytics. Investment decrease vectors Business people reviewing declining financial graph. A worried business man and woman analyze a downward-trending red graph on a computer monitor, illustrating. A worried business man and woman analyze a downward-trending red graph on a computer monitor, illustrating financial loss, market decline, or poor performance. This depicts stress, concern, and problem-solving in a professional office setting, suitable for concepts regarding recession, crisis management, stock market drops, or negative business analytics.
Free with trial A collection of black and white icons representing financial concepts such as growth charts, decline arrows, and money symbols, all presented clearly on a plain white background for easy integration i. Investment decrease vectors Financial growth and decline icons isolated on transparent background. A collection of black and white icons representing financial concepts such as growth. A collection of black and white icons representing financial concepts such as growth charts, decline arrows, and money symbols, all presented clearly on a plain white background for easy integration i
Free with trial A graph crash hologram financial loss stock market digital chart red line technology dramatic crisis business. Investment decrease illustrations Graph crash hologram financial loss stock market digital chart red line technology dramatic crisis business. A graph crash hologram financial loss stock market. A graph crash hologram financial loss stock market digital chart red line technology dramatic crisis business
Free with trial A series of seven golden, metallic bars are arranged in a descending order, forming a bar chart that illustrates a significant decline. The bars are highly reflective, catching the light and emphasizing their three-dimensional form. The chart is presented in isolation against a pure white background, making the visual representation of a downward trend clear and impactful. Investment decrease illustrations Golden Bar Chart Showing a Steep Decline on White Background graph statistics. A series of seven golden, metallic bars are arranged in a descending order. A series of seven golden, metallic bars are arranged in a descending order, forming a bar chart that illustrates a significant decline. The bars are highly reflective, catching the light and emphasizing their three-dimensional form. The chart is presented in isolation against a pure white background, making the visual representation of a downward trend clear and impactful
Free with trial This image shows colorful financial charts and graphs, generated by AI, illustrating various data points and percentages. The overlaid arrows suggest a downward trend, potentially indicating a negative market shift or economic decline. The visual representation aids in quick understanding of compl. Investment decrease illustrations Financial Data Analysis. This image shows colorful financial charts and graphs, generated by AI, illustrating various data points and percentages. The overlaid. This image shows colorful financial charts and graphs, generated by AI, illustrating various data points and percentages. The overlaid arrows suggest a downward trend, potentially indicating a negative market shift or economic decline. The visual representation aids in quick understanding of compl
Free with trial Illustration in the form of a cloud of words related to Recession. Investment decrease illustrations Illustration in the form of a cloud of words related to Recession. Illustration in the form of a cloud of words related to a Recession
Free with trial A compelling image depicting a red downward-pointing arrow dramatically positioned over a stack of financial reports visually communicating a significant market downturn or economic crisis The charts and graphs emphasize the severity of the decline Ideal for illustrating financial news or articles related to economic instability. Investment decrease illustrations Financial Crisis Red Downward Arrow on Stack of Financial Reports and Charts Showing Market Decline AI generated. A compelling image depicting a red downward. A compelling image depicting a red downward-pointing arrow dramatically positioned over a stack of financial reports visually communicating a significant market downturn or economic crisis The charts and graphs emphasize the severity of the decline Ideal for illustrating financial news or articles related to economic instability
Free with trial Close-up image depicting a red arrow pointing downwards on a financial graph symbolizing market downturn A pen and cash are subtly included emphasizing financial loss and economic crisis The image evokes themes of recession and economic instability. Investment decrease illustrations Financial Crisis Concept Red Arrow Downward Trend on Stock Market Graph with Pen and Cash AI generated. Close-up image depicting a red arrow pointing downwards. Close-up image depicting a red arrow pointing downwards on a financial graph symbolizing market downturn A pen and cash are subtly included emphasizing financial loss and economic crisis The image evokes themes of recession and economic instability
Free with trial Stock market decline is visualized through a magnifying glass focusing on a falling graph line representing financial loss and economic downturn. Investment decrease illustrations Stock market decline shown through a magnifying glass with falling graph line. Stock market decline is visualized through a magnifying glass focusing on a. Stock market decline is visualized through a magnifying glass focusing on a falling graph line representing financial loss and economic downturn.
Free with trial A silver laptop sits on a light brown wooden surface. Its screen displays a dark background with a grid pattern and a prominent red line graph sharply declining from left to right. The red line is brightly lit, creating a strong visual contrast against the dark background. The overall mood is one of concern or warning, suggesting a negative trend or decline. The image is clean and simple, focusing, generated by AI. Investment decrease illustrations Laptop Screen Showing Red Downward Trend Graph computer. A silver laptop sits on a light brown wooden surface. Its screen displays a dark background with a grid. A silver laptop sits on a light brown wooden surface. Its screen displays a dark background with a grid pattern and a prominent red line graph sharply declining from left to right. The red line is brightly lit, creating a strong visual contrast against the dark background. The overall mood is one of concern or warning, suggesting a negative trend or decline. The image is clean and simple, focusing, generated by AI.
Free with trial Red arrow descending over digital candlestick chart with grid background, representing financial crash, stock market collapse, and recession. 3D Rendering. Investment decrease illustrations Red downward arrow on digital chart showing financial market crash and global economic recession with candlestick graph overlay on. Red arrow descending over. Red arrow descending over digital candlestick chart with grid background, representing financial crash, stock market collapse, and recession. 3D Rendering
Free with trial A striking 3D rendered red arrow pointing downwards, with a percentage symbol integrated into its design. The arrow is sharp and glossy, casting a subtle shadow on the clean white background. This graphic visually represents concepts such as price reduction, sales, economic decline, or negative financial trends. Investment decrease illustrations Red 3D Percentage Symbol Arrow Pointing Downward on a White Background down arrow. A striking 3D rendered red arrow pointing downwards, with a percentage symbol. A striking 3D rendered red arrow pointing downwards, with a percentage symbol integrated into its design. The arrow is sharp and glossy, casting a subtle shadow on the clean white background. This graphic visually represents concepts such as price reduction, sales, economic decline, or negative financial trends
Free with trial This image was created using Generative AI. A green dollar bill with a white dollar sign and blue arrows pointing up and down, symbolizing financial movement. Investment decrease vectors Green dollar bill with white dollar sign and blue arrows. This image was created using Generative AI. A green dollar bill with a white dollar sign and blue. This image was created using Generative AI. A green dollar bill with a white dollar sign and blue arrows pointing up and down, symbolizing financial movement
Free with trial Golden Bitcoin coin with red downward price arrow. A golden Bitcoin coin showing a downward price trend with bold red arrow. Investment decrease illustrations Golden Bitcoin coin with red downward price arrow. A golden Bitcoin coin showing a downward price trend with bold red arrow
Free with trial Interest rates are coming down in the form of a percentage symbol being pulled and pushed down from a mountain summit. This is a 3-d illustration about falling interest rates. Investment decrease illustrations Interest rates are coming down in the form of a percentage symbol being pulled and pushed down from a mountain summit. This is a 3-d illustration about falling
Free with trial Collection of twenty-four colorful flat line oil and petroleum industry icons isolated on white background featuring barrels, pumpjack, rig, refinery, pipeline valve, tanker ship and truck, gas station pump, global maps, and financial charts showing price growth and decline. Perfect for illustrating energy market, crude trading, fuel costs, economy reports, business presentations, websites, and educational materials about fossil fuels. Investment decrease vectors Oil Industry Icons Set Including Barrels Charts. Collection of twenty-four colorful flat line oil and petroleum industry icons isolated on white background. Collection of twenty-four colorful flat line oil and petroleum industry icons isolated on white background featuring barrels, pumpjack, rig, refinery, pipeline valve, tanker ship and truck, gas station pump, global maps, and financial charts showing price growth and decline. Perfect for illustrating energy market, crude trading, fuel costs, economy reports, business presentations, websites, and educational materials about fossil fuels.
Free with trial A collection of thirty-two colorful flat line icons arranged in grid on white background illustrating logistics, delivery, supply chain and financial concepts. Includes trucks, delivery workers, parcels, warehouse, drone, fuel, maps, gears, charts showing profit loss, expenses, money bags, coins and scales. Bright orange, blue and red colors with black outlines. Ideal for business presentations, e-commerce, transportation, accounting and marketing materials. Investment decrease vectors Colorful Logistics and Business Finance Icon Set. A collection of thirty-two colorful flat line icons arranged in grid on white background illustrating logistics. A collection of thirty-two colorful flat line icons arranged in grid on white background illustrating logistics, delivery, supply chain and financial concepts. Includes trucks, delivery workers, parcels, warehouse, drone, fuel, maps, gears, charts showing profit loss, expenses, money bags, coins and scales. Bright orange, blue and red colors with black outlines. Ideal for business presentations, e-commerce, transportation, accounting and marketing materials.
Free with trial A set of twenty-eight flat line icons in orange, black and gray illustrating energy crisis, fuel prices, and economic trends. Includes symbols for oil pumps, gas stations, power grids, solar panels, wind turbines, batteries, rising and falling charts, dollars, inflation, supply chain breaks, global trade, and consumer stress. Isolated on white background. Ideal for financial reports, news articles, presentations, and websites covering energy markets, inflation, sustainability, and economic forecasting. Investment decrease vectors Energy Crisis Market Trends Icon Collection Set. A set of twenty-eight flat line icons in orange, black and gray illustrating energy crisis, fuel prices, and. A set of twenty-eight flat line icons in orange, black and gray illustrating energy crisis, fuel prices, and economic trends. Includes symbols for oil pumps, gas stations, power grids, solar panels, wind turbines, batteries, rising and falling charts, dollars, inflation, supply chain breaks, global trade, and consumer stress. Isolated on white background. Ideal for financial reports, news articles, presentations, and websites covering energy markets, inflation, sustainability, and economic forecasting.
Free with trial Downward trend graph with white bars and red arrow. Bar chart showing decline, red arrow points down, financial crisis, recession, negative growth. Investment decrease illustrations Downward trend graph with white bars and red arrow. Bar chart showing decline, red arrow points down, financial crisis, recession, negative growth
Free with trial Businessman holding magnifying glass with word COST and downward arrows for cost reduction of financial strategy and budget management for business efficiency with savings improvement concept. Investment decrease illustrations Businessman holding magnifying glass with word COST and downward arrows for cost reduction of financial strategy and budget. Management for business efficiency. Businessman holding magnifying glass with word COST and downward arrows for cost reduction of financial strategy and budget management for business efficiency with savings improvement concept.
Free with trial A stock market crash illustration with red arrows pointing down indicating financial loss and economic downturn. a visual representation of recession and business failure on a blue grid 200. Investment decrease illustrations Stock market crash recession financial crisis chart falling down economic downturn graph business loss 100. A stock market crash illustration with red arrows. a stock market crash illustration with red arrows pointing down indicating financial loss and economic downturn. a visual representation of recession and business failure on a blue grid 200
Free with trial A 3D rendered image depicts a teal bar graph with a sharply downward trending red arrow. Gold coins with dollar signs are scattered around the graph, some appearing to fall. A large gold dollar sign rests near the base of the graph. The background is a blurred cityscape at night. The overall mood is one of financial downturn or crisis. The style is realistic 3D rendering with a focus on metallic. Investment decrease illustrations 3 D Render Falling Stock Market Graph Teal Red Gold Coins. A 3D rendered image depicts a teal bar graph with a sharply downward trending red arrow. Gold coins. A 3D rendered image depicts a teal bar graph with a sharply downward trending red arrow. Gold coins with dollar signs are scattered around the graph, some appearing to fall. A large gold dollar sign rests near the base of the graph. The background is a blurred cityscape at night. The overall mood is one of financial downturn or crisis. The style is realistic 3D rendering with a focus on metallic
Free with trial A vector illustration depicting a red downward trending line graph with a coin falling below it. The word FAILURE is prominently displayed alongside the graph. The color palette is primarily red and maroon against a light gray background. The style is simple and minimalist, suitable for presentations or reports related to financial loss or business failure. The image conveys a sense of decline and. Investment decrease illustrations Red Downward Trend Graph Coin Failure Vector Illustration. A vector illustration depicting a red downward trending line graph with a coin falling below it. The. A vector illustration depicting a red downward trending line graph with a coin falling below it. The word FAILURE is prominently displayed alongside the graph. The color palette is primarily red and maroon against a light gray background. The style is simple and minimalist, suitable for presentations or reports related to financial loss or business failure. The image conveys a sense of decline and
Free with trial Beige Cube with Downward Arrow and FED\' on Gray Wood. Beige cube with 'FED' and a downward blue arrow rests on a gray wooden surface. Investment decrease illustrations Beige Cube with Downward Arrow and FED\' on Gray Wood. Beige cube with 'FED' and a downward blue arrow rests on a gray wooden surface
Free with trial ?a high-quality 3d illustration of a miniature wooden house placed on the tallest block of a declining bar graph . set on a wooden table with soft natural sunlight from a window, this image conceptualizes debt reduction, mortgage payments, decreasing real estate prices, or strategic financial planning for home ownership. Investment decrease illustrations Wooden house model on descending bar chart representing mortgage reduction or property market analysis. ?a high-quality 3d illustration of a miniature wooden. ?a high-quality 3d illustration of a miniature wooden house placed on the tallest block of a declining bar graph. set on a wooden table with soft natural sunlight from a window, this image conceptualizes debt reduction, mortgage payments, decreasing real estate prices, or strategic financial planning for home ownership.
Free with trial A red triangle with the words 'INFLATION ALERT' in white, surrounded by scattered green banknotes and gold coins on a white background, symbolizing economic concerns. Investment decrease illustrations Illustration of inflation alert with money and coins isolated on white background. A red triangle with the words 'INFLATION ALERT' in white, surrounded by. A red triangle with the words 'INFLATION ALERT' in white, surrounded by scattered green banknotes and gold coins on a white background, symbolizing economic concerns.
Free with trial A comprehensive vector illustration featuring eight black icons on a clean white background, representing core concepts in business, finance, and data analytics. The set includes symbols for strategic goals (target), upward trends and progress (arrows, hand with arrows), data visualization (various bar and area charts), and operational processes or settings (gears, adjustable chart). This versatile collection is ideal for presentations, dashboards, reports, websites, and applications requiring clear visual communication of performance, strategy, and insights. Investment decrease vectors Business, Data Analytics and Growth Vector Icons Set. A comprehensive vector illustration featuring eight black icons on a clean white background, representing. A comprehensive vector illustration featuring eight black icons on a clean white background, representing core concepts in business, finance, and data analytics. The set includes symbols for strategic goals (target), upward trends and progress (arrows, hand with arrows), data visualization (various bar and area charts), and operational processes or settings (gears, adjustable chart). This versatile collection is ideal for presentations, dashboards, reports, websites, and applications requiring clear visual communication of performance, strategy, and insights.
Free with trial Flat showing economic inflation and market volatility with rising blue arrow and falling red arrow surrounded by icons for grocery cart, housing costs, coin stacks, fuel pump, shipping, factory production decline, bar chart and food bag on white background. Red and orange upward arrows indicate price increases while gray downward arrows show industrial slowdown. Ideal for finance, business, news articles about inflation, recession, cost of living and global economy. Investment decrease vectors Rising Prices Inflation Chart With Economic Icons. Flat showing economic inflation and market volatility with rising blue arrow and falling red arrow surrounded. Flat showing economic inflation and market volatility with rising blue arrow and falling red arrow surrounded by icons for grocery cart, housing costs, coin stacks, fuel pump, shipping, factory production decline, bar chart and food bag on white background. Red and orange upward arrows indicate price increases while gray downward arrows show industrial slowdown. Ideal for finance, business, news articles about inflation, recession, cost of living and global economy.
Free with trial Vector showing financial growth and economic crisis concepts with laptop displaying rising charts and red upward arrows, broken gears, and circular diagram with declining icons for retail, housing and oil prices. Blue, red and orange flat design on white background includes bar graphs and pie charts. Ideal for business, finance, marketing, recession, inflation, analytics, strategy presentations, articles and reports. Investment decrease vectors Business Growth Chart with Economic Decline Icons. Vector showing financial growth and economic crisis concepts with laptop displaying rising charts and red. Vector showing financial growth and economic crisis concepts with laptop displaying rising charts and red upward arrows, broken gears, and circular diagram with declining icons for retail, housing and oil prices. Blue, red and orange flat design on white background includes bar graphs and pie charts. Ideal for business, finance, marketing, recession, inflation, analytics, strategy presentations, articles and reports.
Free with trial Financial Decline and Monthly Decreasing Bar Chart with Red Arrow. Investment decrease vectors Financial Decline and Monthly Decreasing Bar Chart with Red Arrow.
Free with trial An illustrative icon depicting a strong blue shield encompassing a red segment of a pie chart and a prominent white downward-pointing arrow. This visual metaphor represents financial protection, risk management, and safeguarding against economic decline or market downturns. It symbolizes strategies to mitigate losses, secure investments, and manage negative trends in business or finance. Ideal for conveying concepts of security, crisis management, and data analysis related to falling statistics or decreasing performance in corporate presentations, reports, and financial articles. Investment decrease vectors Financial Protection Against Economic Decline Icon. An illustrative icon depicting a strong blue shield encompassing a red segment of a pie chart and a prominent. An illustrative icon depicting a strong blue shield encompassing a red segment of a pie chart and a prominent white downward-pointing arrow. This visual metaphor represents financial protection, risk management, and safeguarding against economic decline or market downturns. It symbolizes strategies to mitigate losses, secure investments, and manage negative trends in business or finance. Ideal for conveying concepts of security, crisis management, and data analysis related to falling statistics or decreasing performance in corporate presentations, reports, and financial articles.
Free with trial Mortgage rate drop icon. Illustration. Investment decrease vectors Mortgage rate drop icon. Illustration
Free with trial Stacks of coins in increasing height arranged on a dark surface, with a blurred, falling stock market graph in red in the background, depicting financial loss. Image is generated using AI. Investment decrease illustrations Stacks Of Coins With Falling Graph. Stacks of coins in increasing height arranged on a dark surface, with a blurred, falling stock market graph in red in the. Stacks of coins in increasing height arranged on a dark surface, with a blurred, falling stock market graph in red in the background, depicting financial loss. Image is generated using AI
Free with trial This image depicts a 3D rendering of a downward trending graph, generated by AI, showcasing a clear visual representation of market decline or economic downturn. The red bars and arrow emphasize the severity of the fall, suggesting potential financial instability or crisis. Investment decrease illustrations Declining Market Trends. This image depicts a 3D rendering of a downward trending graph, generated by AI, showcasing a clear visual representation of market. This image depicts a 3D rendering of a downward trending graph, generated by AI, showcasing a clear visual representation of market decline or economic downturn. The red bars and arrow emphasize the severity of the fall, suggesting potential financial instability or crisis.
Free with trial This infographic visually represents the concept of the 'long tail' versus 'niche' markets. A curved line descends from a high point labeled 'LONG' and then flattens out, indicating a broad range of products or services with low individual demand. This is contrasted with a series of bars, initially tall and labeled 'HITS', representing popular items, which then decrease in height and become more numerous, illustrating the 'niche' market where many specialized items collectively form a significant market share. The chart is ideal for illustrating business strategies, market analysis, and economic trends. Investment decrease vectors Long Tail vs. Niche Market Performance Chart. This infographic visually represents the concept of the 'long tail' versus 'niche' markets. A curved line descends. This infographic visually represents the concept of the 'long tail' versus 'niche' markets. A curved line descends from a high point labeled 'LONG' and then flattens out, indicating a broad range of products or services with low individual demand. This is contrasted with a series of bars, initially tall and labeled 'HITS', representing popular items, which then decrease in height and become more numerous, illustrating the 'niche' market where many specialized items collectively form a significant market share. The chart is ideal for illustrating business strategies, market analysis, and economic trends.
Free with trial Coin descending with downward arrow and a cloud. Ideal for finance, economy, savings, risk, business, crisis, recession themes. Minimalist design as a simple flat metaphor. Investment decrease illustrations Coin Falling from the Sky with Downward Arrow and Cloud Symbolizing Financial Loss or Decline. Coin descending with downward arrow and a cloud. Ideal for finance. Coin descending with downward arrow and a cloud. Ideal for finance, economy, savings, risk, business, crisis, recession themes. Minimalist design as a simple flat metaphor
Free with trial A high-quality 3D conceptual illustration of sharp metallic scissors actively cutting a green dollar banknote in half. Set against a clean white background, this image serves as a powerful metaphor for monetary policy actions such as currency redenomination, sanering, inflation control, and the reduction of purchasing power. Ideal for financial news, economic editorial content, and articles discussing devalued currency, government fiscal reform, or budget cuts. Investment decrease illustrations Scissors Cutting Dollar Banknote Concept for Redenomination and Currency Sanering. A high-quality 3D conceptual illustration of sharp metallic scissors actively. A high-quality 3D conceptual illustration of sharp metallic scissors actively cutting a green dollar banknote in half. Set against a clean white background, this image serves as a powerful metaphor for monetary policy actions such as currency redenomination, sanering, inflation control, and the reduction of purchasing power. Ideal for financial news, economic editorial content, and articles discussing devalued currency, government fiscal reform, or budget cuts.
Free with trial This image depicts a downward trending graph, generated by AI, illustrating a sharp decline in market performance. The 3D rendered red arrow emphasizes the severity of the fall. It symbolizes economic downturn, financial crisis, or market instability. Investment decrease illustrations Declining Market Trends. This image depicts a downward trending graph, generated by AI, illustrating a sharp decline in market performance. The 3D rendered red. This image depicts a downward trending graph, generated by AI, illustrating a sharp decline in market performance. The 3D rendered red arrow emphasizes the severity of the fall. It symbolizes economic downturn, financial crisis, or market instability.
Free with trial 3D red bar graph with downward arrows indicating decline. Suitable for diverse creative needs. Investment decrease illustrations 3D red bar graph with downward arrows indicating decline. Suitable for diverse creative needs
Free with trial Stock exchange prices declining during trading session, with clocks emphasizing the time sensitivity of market fluctuations. Investment decrease illustrations Stock exchange prices falling during trading with clocks showing time passing. Stock exchange prices declining during trading session, with clocks emphasizing. Stock exchange prices declining during trading session, with clocks emphasizing the time sensitivity of market fluctuations
Free with trial A man's hand holds a glowing blue bar graph with a white arrow pointing down indicating cost reduction. Investment decrease illustrations Man holding glowing cost reduction graph with downward arrow chart financial 1. A man's hand holds a glowing blue bar graph with a white arrow pointing down. A man's hand holds a glowing blue bar graph with a white arrow pointing down indicating cost reduction
Free with trial Finance flat concept going bankrupt vector design illustration. Financial business concept going bankrupt flat vector design. design vector illustration. Investment decrease vectors Finance flat concept going bankrupt vector design illustration. Financial business concept going bankrupt flat vector design.design vector illustration
Free with trial Dramatic red arrow pointing down symbolizes financial loss, market downturn, or economic recession. Perfect for illustrating concepts of decline, risk, and negative trends in business or finance. Ideal for presentations on economics, investments, and market analysis. Investment decrease vectors Red downward arrow indicating financial decline or economic downturn concept. Dramatic red arrow pointing down symbolizes financial loss, market downturn, or. Dramatic red arrow pointing down symbolizes financial loss, market downturn, or economic recession. Perfect for illustrating concepts of decline, risk, and negative trends in business or finance. Ideal for presentations on economics, investments, and market analysis
 Sign in