Free with trial Technological geometric vector illustration showing blue polygonal arrow aimed downwards. Modern digital art piece depicting financial decrease or direction using crystal triangulation technique. Isolated decrease vectors Abstract low poly blue arrow pointing down on dark background representing decline. Technological geometric vector illustration showing blue polygonal arrow aimed downwards. Modern digital art piece depicting financial decrease or direction using crystal triangulation technique
Free with trial Set of Burning Money Set Collection, Burning Money Dollar Bill in Flame Illustration - Cash Fire Destruction, Financial Loss Concept, Wealth Waste or Protest, Isolated on White Background. Isolated decrease vectors Set of Burning Money Set Collection, Burning Money Dollar Bill in Flame Illustration - Cash Fire Destruction, Financial Loss
Free with trial Decrease Temperature Icon Thermometer with minus sign symbol down reduce heat. Measurement tool measure low and decreasing climate cold winter season. Isolated decrease vectors Decrease Temperature Icon Thermometer with minus sign symbol down reduce heat. Measurement tool measure low
Free with trial A glossy, vibrant green 3D arrow with a curved shape, pointing downwards and to the right. The arrow starts with a broad curve at the top and tapers to a sharp arrowhead. It is isolated on a white background. Isolated decrease illustrations Green 3D Curved Arrow Pointing Downwards on White Background image photo. A glossy, vibrant green 3D arrow with a curved shape, pointing downwards and to the right. The arrow starts with a broad curve at the top and tapers to a sharp arrowhead. It is isolated on a white background
Free with trial A vibrant green 3D arrow is depicted pointing downwards, with a layered or stepped design. The arrow has a smooth, glossy finish and casts a subtle shadow on the white background. This visual element represents concepts of decrease, decline, or downward movement. Isolated decrease illustrations Green 3D arrow pointing downwards with layered effect direction movement. A vibrant green 3D arrow is depicted pointing downwards, with a layered or stepped design. The arrow has a smooth, glossy finish and casts a subtle shadow on the white background. This visual element represents concepts of decrease, decline, or downward movement
Free with trial A bold, black 3D number "1" is prominently displayed alongside a percentage sign, also in black 3D. The numeral and symbol are rendered with a glossy finish and are isolated on a stark white background, creating a strong visual contrast. Isolated decrease illustrations Black 3D number 1 with a percentage sign on a white background image photo. A bold, black 3D number "1" is prominently displayed alongside a percentage sign, also in black 3D. The numeral and symbol are rendered with a glossy finish and are isolated on a stark white background, creating a strong visual contrast
Free with trial A single, gleaming golden arrow curves downwards against a white background. The arrow has a polished, metallic finish that reflects light, giving it a luxurious and dynamic appearance. The shape suggests a downward trend, decline, or negative movement. It is presented in a clean studio shot, isolated from any other elements, making it a versatile graphic symbol. Isolated decrease illustrations A Gleaming Golden Downward Curved Arrow on a White Background metallic shiny. A single, gleaming golden arrow curves downwards against a white background. The arrow has a polished, metallic finish that reflects light, giving it a luxurious and dynamic appearance. The shape suggests a downward trend, decline, or negative movement. It is presented in a clean studio shot, isolated from any other elements, making it a versatile graphic symbol
Free with trial An isolated graphic illustration featuring a red downward-trending jagged arrow overlapping an outlined Indian Rupee symbol and a decreasing line graph, symbolizing financial loss, market decline, and currency depreciation. Delivered with an alpha transparent background. Isolated decrease vectors Red Downward Arrow with Indian Rupee Symbol and Declining Line Graph Alpha Transparent. An isolated graphic illustration featuring a red downward-trending jagged arrow overlapping an outlined Indian Rupee symbol and a decreasing line graph, symbolizing financial loss, market decline, and currency depreciation. Delivered with an alpha transparent background.
Free with trial A 3D rendered graphic featuring a large, smooth blue arrow pointing downwards. Attached to the side of the arrow is a small, round pink icon containing a white percent symbol. The entire graphic is isolated on a white background, suggesting a concept related to discounts, price reductions, or negative trends. Isolated decrease illustrations 3D Render of a Blue Downward Arrow with a Pink Circle and Percent Symbol down arrow. A 3D rendered graphic featuring a large, smooth blue arrow pointing downwards. Attached to the side of the arrow is a small, round pink icon containing a white percent symbol. The entire graphic is isolated on a white background, suggesting a concept related to discounts, price reductions, or negative trends
Free with trial A group of iridescent percentage symbols isolated on a white background. The symbols appear to be floating or hanging, creating a sense of lightness and movement. The iridescent material reflects light in a variety of colors, adding a modern and eye-catching element. Suitable for illustrating concepts related to discounts, sales, finance, and special offers. Isolated decrease illustrations Floating Percentage Symbols. A group of iridescent percentage symbols isolated on a white background. The symbols appear to be floating or hanging, creating a sense of lightness and movement. The iridescent material reflects light in a variety of colors, adding a modern and eye-catching element. Suitable for illustrating concepts related to discounts, sales, finance, and special offers.
Free with trial Irregular heartbeat anemia symptom line icon of hematology, physical disease, medicine science. Vector outline heart with arrhythmia heartbeat rate, tachycardia or bradycardia beat isolated sign. Isolated decrease vectors Irregular heartbeat anemia symptom line icon
Free with trial A sharp, faceted blue crystal arrow is depicted pointing diagonally downwards on a clean white background. The arrow exhibits reflective surfaces and sharp edges, giving it a modern and sleek appearance. This graphic element symbolizes decline, decrease, or a downward trend. Isolated decrease illustrations Blue Crystal Arrow Pointing Downward on a White Background direction decline. A sharp, faceted blue crystal arrow is depicted pointing diagonally downwards on a clean white background. The arrow exhibits reflective surfaces and sharp edges, giving it a modern and sleek appearance. This graphic element symbolizes decline, decrease, or a downward trend
Free with trial A graphic icon featuring two opposing black arrows, one pointing upwards and the other downwards, positioned vertically within a circular frame. The frame has a gradient effect, transitioning from black on the left to light grey and white on the right. The image is isolated on a white background. Isolated decrease illustrations Black Up and Down Arrows Inside a Circular Gradient Frame direction movement. A graphic icon featuring two opposing black arrows, one pointing upwards and the other downwards, positioned vertically within a circular frame. The frame has a gradient effect, transitioning from black on the left to light grey and white on the right. The image is isolated on a white background
Free with trial A simple, modern icon featuring a bright yellow arrow pointing directly downwards. The arrow is rendered in a 3D style with subtle shading, giving it a slightly raised appearance. It is set against a clean, rounded white square background. The image is isolated on a white background, making the yellow arrow and its directional meaning prominent. Isolated decrease illustrations A Yellow Downward Arrow Icon on a Rounded White Square Background down arrow download. A simple, modern icon featuring a bright yellow arrow pointing directly downwards. The arrow is rendered in a 3D style with subtle shading, giving it a slightly raised appearance. It is set against a clean, rounded white square background. The image is isolated on a white background, making the yellow arrow and its directional meaning prominent
Free with trial A simple and effective line graph illustrating the concept of debt reduction. The chart, on a clean white background, shows a green line trending downwards, representing a successful decrease in liabilities over time. A final red arrow emphasizes a significant or accelerated drop, symbolizing a successful financial strategy, cost-cutting, or achieving financial freedom. This vector illustration is perfect for presentations, articles, and infographics on personal or business finance, money management, and economic stability. Isolated decrease vectors Debt Reduction Concept Graph Showing Downward Trend. A simple and effective line graph illustrating the concept of debt reduction. The chart, on a clean white background, shows a green line trending downwards, representing a successful decrease in liabilities over time. A final red arrow emphasizes a significant or accelerated drop, symbolizing a successful financial strategy, cost-cutting, or achieving financial freedom. This vector illustration is perfect for presentations, articles, and infographics on personal or business finance, money management, and economic stability.
Free with trial A three-dimensional, solid white arrow is depicted pointing downwards and to the right. The arrow has a smooth, slightly rounded appearance and casts a subtle shadow on the white surface beneath it. This isolated graphic element is presented against a plain white background, making it suitable for various design applications. Isolated decrease illustrations 3D Rendered White Arrow Pointing Down and to the Right on a White Background symbol. A three-dimensional, solid white arrow is depicted pointing downwards and to the right. The arrow has a smooth, slightly rounded appearance and casts a subtle shadow on the white surface beneath it. This isolated graphic element is presented against a plain white background, making it suitable for various design applications
Free with trial Bitcoin price drop concept with red falling arrow and gold BTC coin isolated on light background. Cryptocurrency market crash symbol showing bearish trend, decline chart and digital asset depreciation. Modern finance icon ideal for trading articles, investment blogs, blockchain presentations, fintech apps and economic reports. Isolated decrease vectors Bitcoin price drop concept with red falling arrow and gold BTC coin isolated on light background.
Free with trial A striking red 3D arrow is constructed from a series of connected cubes that gradually decrease in size as they form the arrow's shaft. The arrow points downwards and to the right, suggesting a trend or decline. The entire object is rendered in sharp detail against a clean white background. Isolated decrease illustrations Red 3D Arrow Composed of Cubes Progressing Downward on White Background blocks. A striking red 3D arrow is constructed from a series of connected cubes that gradually decrease in size as they form the arrow's shaft. The arrow points downwards and to the right, suggesting a trend or decline. The entire object is rendered in sharp detail against a clean white background
Free with trial A circular pattern of gray dots that gradually decrease in size and density from the center outwards, set against a clean white background. Isolated decrease illustrations Halftone Dot Pattern Circle on White Background dots. A circular pattern of gray dots that gradually decrease in size and density from the center outwards, set against a clean white background
Free with trial A 3D rendered image of a sharp, blue glass arrow pointing directly downwards. The arrow has a glossy, reflective surface with highlights and shadows that emphasize its three-dimensional form. It is isolated on a clean white background, making it suitable for use as a directional symbol or icon. Isolated decrease illustrations 3D Rendered Blue Glass Arrow Pointing Downwards on a White Background direction. A 3D rendered image of a sharp, blue glass arrow pointing directly downwards. The arrow has a glossy, reflective surface with highlights and shadows that emphasize its three-dimensional form. It is isolated on a clean white background, making it suitable for use as a directional symbol or icon
Free with trial A 3D bar chart rendered in a vibrant pink color illustrates a downward trend. The bars decrease in height from left to right, representing a decline in data or performance. A thick pink arrow with a sharp point follows the descending path of the bars, reinforcing the concept of a decrease. The chart is presented in isolation against a clean white background, making the visual elements stand out. Isolated decrease illustrations Pink Bar Chart with a Downward Trending Arrow Symbolizing Decline graph magenta. A 3D bar chart rendered in a vibrant pink color illustrates a downward trend. The bars decrease in height from left to right, representing a decline in data or performance. A thick pink arrow with a sharp point follows the descending path of the bars, reinforcing the concept of a decrease. The chart is presented in isolation against a clean white background, making the visual elements stand out
Free with trial An isolated minimalist flat style illustration of a red circle with a horizontal line inside representing a minus or negative symbol. Perfect for use in web design, user interface elements, or educational materials. Isolated decrease vectors Simple Flat Circle Minus Sign Button Shape Icon Graphic. An isolated minimalist flat style illustration of a red circle with a horizontal line inside representing a minus or negative symbol. Perfect for use in web design, user interface elements, or educational materials.
Free with trial A professional 3D rendering of a bar chart representing a negative trend or financial loss. The illustration features three textured blue metallic columns with a prominent, jagged red arrow pointing downwards across them. This graphic symbolizes economic recession, market crashes, or decreasing sales figures. It is mounted on a sleek grey base and isolated on a white background, making it perfect for business presentations, investment risk analysis, and economic reports. Isolated decrease vectors 3D Downward Bar Chart with Red Arrow - Financial Loss & Recession Concept. A professional 3D rendering of a bar chart representing a negative trend or financial loss. The illustration features three textured blue metallic columns with a prominent, jagged red arrow pointing downwards across them. This graphic symbolizes economic recession, market crashes, or decreasing sales figures. It is mounted on a sleek grey base and isolated on a white background, making it perfect for business presentations, investment risk analysis, and economic reports.
Free with trial Line Graph Chart Line And Solid Icon Set. Data Analysis, Trend Visualization, And Business Growth Symbol Collection. Statistical Representation And Performance Tracking. Isolated Vector Illustration. Isolated decrease vectors Line Graph Chart Line And Solid Icon Set. Data Analysis, Trend Visualization, And Business Growth Symbol Collection
Free with trial A circular golden coin with a black glossy face. On the black surface, a golden bar graph shows a downward trend, with the bars decreasing in height from left to right. A golden arrow points downwards, emphasizing the decline. The coin is isolated on a white background. Isolated decrease illustrations Golden Coin with Black Background Featuring a Falling Bar Graph and Downward Arrow falling graph. A circular golden coin with a black glossy face. On the black surface, a golden bar graph shows a downward trend, with the bars decreasing in height from left to right. A golden arrow points downwards, emphasizing the decline. The coin is isolated on a white background
Free with trial Vector Illustration of red blood cells. Erythrocytes isolated on white background. Isolated decrease vectors Vector Illustration of red blood cells. Erythrocytes isolated on white background
Free with trial Simple outline icon of hand offering money and downward arrow. Represents decrease, loss, recession, and financial challenge. Isolated decrease vectors Outline Simple Hand Offering Money Down Arrow Icon Symbol. Simple outline icon of hand offering money and downward arrow. Represents decrease, loss, recession, and financial challenge.
Free with trial Image Compression Outline Icon Vector Linear File Shrink Symbol for Web Optimization Isolated on White Background. Image Compression Outline Icon Vector Linear. Isolated decrease vectors Image Compression Outline Icon Vector Linear File Shrink Symbol for Web Optimization Isolated on White Background. Image Compression Outline Icon Vector Linear
Free with trial Image Compression Outline Icon Vector Linear File Shrink Symbol for Web Optimization Isolated on White Background. Isolated decrease vectors Image Compression Outline Icon Vector Linear File Shrink Symbol for Web Optimization Isolated on White Background
Free with trial Set line Employee dismissal, Money bag, Pie chart infographic and Dollar rate decrease icon. Vector. Isolated decrease illustrations Set line Employee dismissal, Money bag, Pie chart infographic and Dollar rate decrease icon. Vector
Free with trial GDP decline with red arrow. Economic decline or recession, concept. 3d rendering isolated on white background. Isolated decrease illustrations GDP decline with red arrow. Economic decline or recession, concept. 3d rendering
Free with trial Water level icon. Water depth icon vector. Water level up, down icon sign vector. Water level increase, decrease icon sign vector. Isolated decrease vectors Water level icon. Water depth icon vector. Water level up, down icon sign vector. Water level increase, decrease icon sign vector
Free with trial A bold, red arrow with a zig-zag pattern points downwards, symbolizing a decline or negative trend. The arrow is rendered in a 3D style with subtle shading, giving it depth. It is isolated on a transparent background, making it versatile for various design applications. This graphic is ideal for representing financial losses, market downturns, declining performance, or any concept associated with a downward trajectory. Isolated decrease illustrations Red Downward Trend Arrow. A bold, red arrow with a zig-zag pattern points downwards, symbolizing a decline or negative trend. The arrow is rendered in a 3D style with subtle shading, giving it depth. It is isolated on a transparent background, making it versatile for various design applications. This graphic is ideal for representing financial losses, market downturns, declining performance, or any concept associated with a downward trajectory.
Free with trial A bold, three-dimensional red arrow forms a jagged downward trend, symbolizing decline, loss, or negative performance. The arrow's sharp angles and bright red color convey urgency and a significant downturn. Isolated on a clean white background, this graphic is versatile for illustrating financial losses, market crashes, declining statistics, or any concept related to a negative trajectory. Its minimalist design makes it suitable for presentations, reports, and digital media. Isolated decrease illustrations Red Downward Trend Arrow. A bold, three-dimensional red arrow forms a jagged downward trend, symbolizing decline, loss, or negative performance. The arrow's sharp angles and bright red color convey urgency and a significant downturn. Isolated on a clean white background, this graphic is versatile for illustrating financial losses, market crashes, declining statistics, or any concept related to a negative trajectory. Its minimalist design makes it suitable for presentations, reports, and digital media.
Free with trial Two bold, three-dimensional red arrows are positioned vertically side-by-side against a clean white background. The left arrow points upwards, signifying increase, progress, or ascent. The right arrow points downwards, representing decrease, decline, or descent. Their contrasting directions and vibrant color make them a strong visual metaphor for opposing forces, change, or directional choices. Isolated decrease illustrations Red Up and Down Arrows Symbolizing Direction and Contrast on White Background image photo. Two bold, three-dimensional red arrows are positioned vertically side-by-side against a clean white background. The left arrow points upwards, signifying increase, progress, or ascent. The right arrow points downwards, representing decrease, decline, or descent. Their contrasting directions and vibrant color make them a strong visual metaphor for opposing forces, change, or directional choices
Free with trial Blue Global economic crisis icon isolated on blue background. World finance crisis. Minimalism concept. 3D render illustration. Isolated decrease illustrations Blue Global economic crisis icon isolated on blue background. World finance crisis. Minimalism concept. 3D render
Free with trial A glossy, three-dimensional red percentage symbol stands prominently against a clean white background. The symbol casts a soft, subtle shadow, giving it a sense of depth and presence. Its smooth, reflective surface suggests a modern and impactful representation of financial concepts. Isolated decrease illustrations 3D Red Percentage Symbol Isolated on a White Background with Subtle Shadow image photo. A glossy, three-dimensional red percentage symbol stands prominently against a clean white background. The symbol casts a soft, subtle shadow, giving it a sense of depth and presence. Its smooth, reflective surface suggests a modern and impactful representation of financial concepts
Free with trial This image features a decreasing bar graph with a red downward arrow, isolated on a white background. The graph illustrates a downward trend in data, with blue bars progressively getting shorter. The white background provides a clean and clear contrast, emphasizing the visual elements of the graph. Isolated decrease illustrations Decreasing bar graph arrow down isolated on white background. This image features a decreasing bar graph with a red downward arrow, isolated on a white background. The graph illustrates a downward trend in data, with blue bars progressively getting shorter. The white background provides a clean and clear contrast, emphasizing the visual elements of the graph
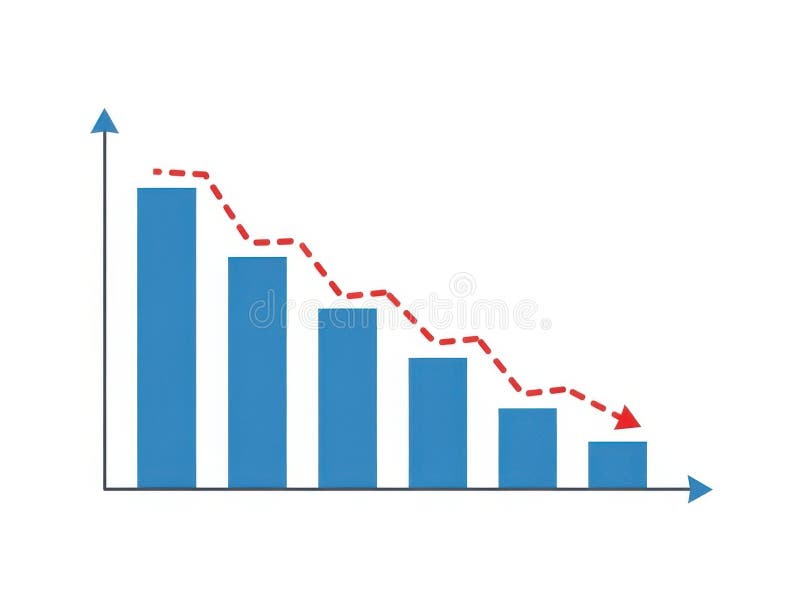
Free with trial This image features a bar chart with a decreasing trend isolated on a white background. The chart displays blue bars that progressively decrease in height from left to right, with a red dashed line indicating the downward trend. The horizontal axis represents different categories, while the vertical axis shows the corresponding values. The image is clear and SEO-friendly, highlighting data. Isolated decrease illustrations Bar chart with decreasing trend isolated on white background. This image features a bar chart with a decreasing trend isolated on a white background. The chart displays blue bars that progressively decrease in height from left to right, with a red dashed line indicating the downward trend. The horizontal axis represents different categories, while the vertical axis shows the corresponding values. The image is clear and SEO-friendly, highlighting data
Free with trial Clean showing 3d icon of a pound sterling symbol with a downward arrow indicating decrease. Isolated decrease illustrations 3D Icon of a Pound Sterling Symbol with a Downward Arrow Indicating Decrease
Free with trial This image features a 3D bar graph with a downward trend isolated on a white background. The graph consists of green bars that decrease in height from left to right, with a red arrow pointing downward to emphasize the declining trend. The image is clean and visually appealing, suitable for business and financial contexts. Isolated decrease illustrations 3d bar graph with downward trend isolated on white background. This image features a 3D bar graph with a downward trend isolated on a white background. The graph consists of green bars that decrease in height from left to right, with a red arrow pointing downward to emphasize the declining trend. The image is clean and visually appealing, suitable for business and financial contexts
Free with trial A vibrant, hand-drawn doodle illustration centered around a large percentage sign. This creative sketch features various financial and business icons, including bar graphs, pie charts, stacks of coins, dollar signs, and arrows indicating growth and decline. The colorful, cartoonish style makes it perfect for illustrating concepts like interest rates, economic trends, business analytics, and financial reports. Ideal for use in presentations, infographics, websites, and educational materials, this vector art is isolated on a white background for versatile application. Isolated decrease illustrations Finance and Economy Doodle Illustration. A vibrant, hand-drawn doodle illustration centered around a large percentage sign. This creative sketch features various financial and business icons, including bar graphs, pie charts, stacks of coins, dollar signs, and arrows indicating growth and decline. The colorful, cartoonish style makes it perfect for illustrating concepts like interest rates, economic trends, business analytics, and financial reports. Ideal for use in presentations, infographics, websites, and educational materials, this vector art is isolated on a white background for versatile application.
Free with trial Businessman with decreasing dollar sign representing salary reduction, income loss, and financial decline. Suitable for payroll, HR, and economic downturn concepts. Isolated decrease vectors Salary reduction concept with businessman and falling dollar symbol showing income decrease and pay cut. Businessman with decreasing dollar sign representing salary reduction, income loss, and financial decline. Suitable for payroll, HR, and economic downturn concepts
Free with trial A pair of three-dimensional arrows, rendered in shades of gray, are presented against a white background. One arrow points upwards, signifying growth or progress, while the other points downwards, indicating decline or a decrease. The arrows are constructed from layered chevron shapes, creating a textured and modern appearance. Isolated decrease illustrations 3D rendering of an upward and downward pointing chevron arrow pair on a white background. A pair of three-dimensional arrows, rendered in shades of gray, are presented against a white background. One arrow points upwards, signifying growth or progress, while the other points downwards, indicating decline or a decrease. The arrows are constructed from layered chevron shapes, creating a textured and modern appearance
Free with trial Purple Global economic crisis icon isolated on purple background. World finance crisis. Minimalism concept. 3D render illustration. Isolated decrease illustrations Purple Global economic crisis icon isolated on purple background. World finance crisis. Minimalism concept. 3D render
Free with trial A vibrant, pixelated pink arrow points downwards, set against a dark, textured background with subtle horizontal grey lines. This retro 8-bit style graphic symbolizes decrease, decline, download, or a negative trend. Ideal for illustrating financial data, market downturns, digital alerts, gaming interfaces, or any concept requiring a clear downward direction indicator. Its bold color and distinct pixel art aesthetic make it a versatile design element for technology, business, or creative projects. Isolated decrease illustrations Pixel Art Down Arrow on Dark Background. A vibrant, pixelated pink arrow points downwards, set against a dark, textured background with subtle horizontal grey lines. This retro 8-bit style graphic symbolizes decrease, decline, download, or a negative trend. Ideal for illustrating financial data, market downturns, digital alerts, gaming interfaces, or any concept requiring a clear downward direction indicator. Its bold color and distinct pixel art aesthetic make it a versatile design element for technology, business, or creative projects.
Free with trial A single golden coin is presented with a magnifying glass symbol indicating a zoom-out function embossed on its surface. The coin has a ribbed edge and a polished, metallic sheen. It is set against a dark gradient background with a subtle shadow, highlighting its isolated, conceptual nature. Isolated decrease illustrations Golden Coin with Zoom Out Magnifying Glass Symbol on Dark Gradient Background image photo. A single golden coin is presented with a magnifying glass symbol indicating a zoom-out function embossed on its surface. The coin has a ribbed edge and a polished, metallic sheen. It is set against a dark gradient background with a subtle shadow, highlighting its isolated, conceptual nature
Free with trial A striking 3D rendering illustrates a significant decline in consumer spending or retail sales. The image features a large green shopping bag followed by three progressively smaller white shopping bags, visually representing a reduction. A prominent red arrow, shaped like a downward trend graph, effectively symbolizes a market downturn, economic recession, or decrease in purchasing power. Set against a clean white background, this conceptual image is ideal for financial reports, business presentations, and articles discussing economic challenges, retail struggles, or market analysis. Isolated decrease illustrations Retail Sales Decline and Economic Downturn. A striking 3D rendering illustrates a significant decline in consumer spending or retail sales. The image features a large green shopping bag followed by three progressively smaller white shopping bags, visually representing a reduction. A prominent red arrow, shaped like a downward trend graph, effectively symbolizes a market downturn, economic recession, or decrease in purchasing power. Set against a clean white background, this conceptual image is ideal for financial reports, business presentations, and articles discussing economic challenges, retail struggles, or market analysis.
Free with trial A series of golden, metallic bars are arranged in a descending order, forming a bar chart that clearly illustrates a downward trend. The bars decrease in height from left to right, with the leftmost bar being the tallest and the rightmost bar being the shortest and widest. The reflective golden surface of the bars catches the light, highlighting their three-dimensional form. The chart is presented. Isolated decrease illustrations Golden Bar Chart Showing A Downward Trend On A White Background graph financial. A series of golden, metallic bars are arranged in a descending order, forming a bar chart that clearly illustrates a downward trend. The bars decrease in height from left to right, with the leftmost bar being the tallest and the rightmost bar being the shortest and widest. The reflective golden surface of the bars catches the light, highlighting their three-dimensional form. The chart is presented
Free with trial Decrease showing abstract composition of white 3d geometric shapes representing percentage and plus symbols. Isolated decrease illustrations Abstract Composition of White 3D Geometric Shapes Representing Percentage and Plus Symbols
Free with trial A clean and minimalist black outline icon of a percentage symbol, isolated on a pure white background. This versatile graphic represents discounts, sales, interest rates, financial calculations, and statistical data. Ideal for web design, mobile applications, business presentations, marketing materials, infographics, and educational content. Its simple, modern aesthetic makes it perfect for conveying concepts of proportion, growth, and change in a clear and concise manner. Isolated decrease illustrations Minimalist Percentage Symbol Outline Icon. A clean and minimalist black outline icon of a percentage symbol, isolated on a pure white background. This versatile graphic represents discounts, sales, interest rates, financial calculations, and statistical data. Ideal for web design, mobile applications, business presentations, marketing materials, infographics, and educational content. Its simple, modern aesthetic makes it perfect for conveying concepts of proportion, growth, and change in a clear and concise manner.
Free with trial This image features two bar graphs isolated on a white background. The left graph, labeled 'PROFIT,' shows increasing bars indicating rising profit levels. The right graph, labeled 'LOSS,' displays decreasing bars, illustrating increasing loss levels. The image is clear, concise, and SEO-friendly, highlighting financial concepts. Isolated decrease illustrations Profit and loss graphs isolated on white background. This image features two bar graphs isolated on a white background. The left graph, labeled 'PROFIT,' shows increasing bars indicating rising profit levels. The right graph, labeled 'LOSS,' displays decreasing bars, illustrating increasing loss levels. The image is clear, concise, and SEO-friendly, highlighting financial concepts
Free with trial A 3D rendered image features two glossy, red arrows in a dynamic, circular arrangement. One arrow points upwards, signifying growth or increase, while the other points downwards, representing decline or decrease. The arrows are highly reflective and are presented against a clean white background, emphasizing their form and the concept of opposing directions or change. Isolated decrease illustrations Glossy Red Arrows Pointing Up and Down in a Circular Motion on a White Background image photo. A 3D rendered image features two glossy, red arrows in a dynamic, circular arrangement. One arrow points upwards, signifying growth or increase, while the other points downwards, representing decline or decrease. The arrows are highly reflective and are presented against a clean white background, emphasizing their form and the concept of opposing directions or change
Free with trial A 3D rendered icon depicting a blue document with a raised bar graph. The bar graph features alternating blue, orange, and yellow bars of varying heights. White lines and a circular orange and white element are also present on the blue document surface. The icon is isolated on a white background. Isolated decrease vectors 3 D blue document icon with orange and blue bar graph and white lines image. A 3D rendered icon depicting a blue document with a raised bar graph. The bar graph features alternating blue, orange, and yellow bars of varying heights. White lines and a circular orange and white element are also present on the blue document surface. The icon is isolated on a white background
Free with trial A 3D render illustrating a concept of financial decline and economic recession. The image features a red bar chart with progressively shorter bars, indicating a downward trend. A bold, red arrow follows this negative trajectory, pointing sharply downwards. Set against a clean, neutral gray background, this graphic powerfully symbolizes concepts like business failure, stock market crash, investment loss, sales decrease, and economic crisis. It's a perfect visual for presentations, reports, and articles discussing financial downturns, poor performance, and negative growth. Isolated decrease illustrations Financial Decline Graph with Red Arrow Down. A 3D render illustrating a concept of financial decline and economic recession. The image features a red bar chart with progressively shorter bars, indicating a downward trend. A bold, red arrow follows this negative trajectory, pointing sharply downwards. Set against a clean, neutral gray background, this graphic powerfully symbolizes concepts like business failure, stock market crash, investment loss, sales decrease, and economic crisis. It's a perfect visual for presentations, reports, and articles discussing financial downturns, poor performance, and negative growth.
Free with trial This image features two circular arrows on a white background. The left circle has a green upward arrow with a dollar sign at the bottom, indicating an increase or profit. The right circle has a red downward arrow with a dollar sign at the bottom, indicating a decrease or loss. The image is simple and uses contrasting colors to clearly convey its message. Isolated decrease illustrations Up and down arrows with dollar signs isolated on white background. This image features two circular arrows on a white background. The left circle has a green upward arrow with a dollar sign at the bottom, indicating an increase or profit. The right circle has a red downward arrow with a dollar sign at the bottom, indicating a decrease or loss. The image is simple and uses contrasting colors to clearly convey its message
Free with trial Black fair value icon with downward arrow pointing to two horizontal lines. Clear details and vibrant colors e. Isolated decrease illustrations Fair Value Downward Arrow Icon Indicating Decrease In Value image photo. Black fair value icon with downward arrow pointing to two horizontal lines. Clear details and vibrant colors e
Free with trial A 3D render of a shiny red arrow curving downwards, indicating a negative trend or decline. Isolated on a clean white background for clarity. Isolated decrease illustrations A glossy red arrow pointing downwards, isolated on white background. A 3D render of a shiny red arrow curving downwards, indicating a negative trend or decline. Isolated on a clean white background for clarity
Free with trial A 3D bar chart illustrates a downward trend against a white background. The bars, colored red, yellow, green, and blue, decrease in height from left to right. A thick black arrow curves downwards, pointing towards the shortest bar, visually reinforcing the concept of decline or loss. Isolated decrease illustrations Downward Trend Bar Chart with Red Yellow Green Blue Bars and Black Arrow on White Background. A 3D bar chart illustrates a downward trend against a white background. The bars, colored red, yellow, green, and blue, decrease in height from left to right. A thick black arrow curves downwards, pointing towards the shortest bar, visually reinforcing the concept of decline or loss
Free with trial An isolated vector illustration featuring two prominent, stylized arrows on a clean white background. One arrow, colored in shades of red and pink, points diagonally upwards and to the right, symbolizing growth, increase, or positive trends. The other arrow, rendered in blue and cyan tones, points diagonally downwards and to the left, representing decline, decrease, or negative movement. Both arrows have a modern, slightly textured or sketchy appearance, making them ideal for infographics, business presentations, financial reports, or conceptual designs illustrating contrasting directions, market changes, or comparative data. Isolated decrease illustrations Growth and Decline Arrows with Sketchy Style. An isolated vector illustration featuring two prominent, stylized arrows on a clean white background. One arrow, colored in shades of red and pink, points diagonally upwards and to the right, symbolizing growth, increase, or positive trends. The other arrow, rendered in blue and cyan tones, points diagonally downwards and to the left, representing decline, decrease, or negative movement. Both arrows have a modern, slightly textured or sketchy appearance, making them ideal for infographics, business presentations, financial reports, or conceptual designs illustrating contrasting directions, market changes, or comparative data.
Free with trial A set of simple and clean line art icons representing various financial and business concepts, including growth, decrease, profit, and loss. These icons are suitable for use in presentations, websites, and mobile applications. Isolated decrease vectors Simple Line Art Financial Chart Symbol Icon Set for Business Concept. A set of simple and clean line art icons representing various financial and business concepts, including growth, decrease, profit, and loss. These icons are suitable for use in presentations, websites, and mobile applications.
Free with trial Stack of books with red downward arrow. Decline in education or reading, concept. 3D rendering isolated on white background. Isolated decrease illustrations Stack of books with red downward arrow. Decline in education or reading, concept. 3D rendering
Free with trial Business go bankruptcy color line icon, economic crisis and money loss, downturn symbol. Closed store, kiosk, or shop building. Isolated vector linear sign of financial distress, fail and bankruptcy. Isolated decrease illustrations Business go bankruptcy color icon, economic crisis. Business go bankruptcy color line icon, economic crisis and money loss, downturn symbol. Closed store, kiosk, or shop building. Isolated vector linear sign of financial distress, fail and bankruptcy
Free with trial Business go bankruptcy color line icon, economic crisis and money loss, downturn symbol. Closed store, kiosk, or shop building. Isolated vector linear sign of financial distress, fail and bankruptcy. Isolated decrease vectors Business go bankruptcy color icon, economic crisis. Business go bankruptcy color line icon, economic crisis and money loss, downturn symbol. Closed store, kiosk, or shop building. Isolated vector linear sign of financial distress, fail and bankruptcy
Free with trial Business go bankruptcy color line icon, economic crisis and money loss, downturn symbol. Closed store, kiosk, or shop building. Isolated vector linear sign of financial distress, fail and bankruptcy. Isolated decrease vectors Business go bankruptcy color icon, economic crisis. Business go bankruptcy color line icon, economic crisis and money loss, downturn symbol. Closed store, kiosk, or shop building. Isolated vector linear sign of financial distress, fail and bankruptcy
Free with trial Design anemia blood with few blood cells medical line icon red blood cell volume decrease. Isolated decrease illustrations Anemia blood with few blood cells medical line icon red blood cell volume decrease
Free with trial A 3D golden bar chart illustrates a declining trend, with a sharp downward arrow indicating a significant decrease in performance or value. Isolated on a white background. Isolated decrease illustrations Golden downward trending bar chart with arrow. A 3D golden bar chart illustrates a declining trend, with a sharp downward arrow indicating a significant decrease in performance or value. Isolated on a white background
Free with trial This 3D rendered image features two distinct icons on a clean white background. On the left is a blue thermometer with a white column indicating a low temperature, marked with Celsius degrees. To its right is an orange rounded square icon containing a white downward-pointing arrow, signifying a decrease or reduction. The overall design is simple, modern, and visually clear, suitable for. Isolated decrease illustrations 3D Icon of a Thermometer Showing Low Temperature Next to a Down Arrow Symbol on White Background. This 3D rendered image features two distinct icons on a clean white background. On the left is a blue thermometer with a white column indicating a low temperature, marked with Celsius degrees. To its right is an orange rounded square icon containing a white downward-pointing arrow, signifying a decrease or reduction. The overall design is simple, modern, and visually clear, suitable for
Free with trial Two glossy, 3D arrows are presented against a white background. The left arrow is red and curves downwards, indicating a decrease or negative direction. The right arrow is orange and curves upwards, signifying an increase or positive direction. The arrows have rounded edges and a smooth, reflective surface. Isolated decrease illustrations Red downward arrow and orange upward arrow on a white background direction. Two glossy, 3D arrows are presented against a white background. The left arrow is red and curves downwards, indicating a decrease or negative direction. The right arrow is orange and curves upwards, signifying an increase or positive direction. The arrows have rounded edges and a smooth, reflective surface
Free with trial Pink Searching for food in trash can on streets outdoors icon isolated on pink background. Homelessness and poverty concept. Minimalism concept. 3D render illustration. Isolated decrease illustrations Pink Searching for food in trash can on streets outdoors icon isolated on pink background. Homelessness and poverty
Free with trial Two rounded square buttons, one green with a white up arrow and one red with a white down arrow, isolated on a transparent background. Isolated decrease vectors Green up arrow and red down arrow icons isolated on transparent background. Two rounded square buttons, one green with a white up arrow and one red with a white down arrow, isolated on a transparent background
Free with trial This image features a minimalist and modern vector icon of a jagged downward trending line graph, sharply declining from left to right, symbolizing financial loss, economic downturn, or market decline, set against a clean and uncluttered white background suitable for use in presentations, reports, infographics, or digital media to visually communicate negative trends or decreasing performance. Isolated decrease illustrations Sharp downward trending line graph icon isolated on white background representing financial loss or market decline vector. This image features a minimalist and modern vector icon of a jagged downward trending line graph, sharply declining from left to right, symbolizing financial loss, economic downturn, or market decline, set against a clean and uncluttered white background suitable for use in presentations, reports, infographics, or digital media to visually communicate negative trends or decreasing performance
Free with trial This image features a collection of stacked coins with a downward trend arrow above them, set against a transparent background. The coins are arranged in varying heights, and the arrow indicates a decline in value or quantity. Isolated decrease illustrations Stacked coins with downward trend arrow isolated on white background. This image features a collection of stacked coins with a downward trend arrow above them, set against a transparent background. The coins are arranged in varying heights, and the arrow indicates a decline in value or quantity
Free with trial Set Browser window Graph chart infographic Cloud technology data transfer upload Mobile phone incognito and Financial growth decrease icon. Vector. Isolated decrease illustrations Set Browser window, Graph chart infographic, Cloud technology data transfer, upload, Mobile phone, incognito and. Set Browser window Graph chart infographic Cloud technology data transfer upload Mobile phone incognito and Financial growth decrease icon. Vector.
Free with trial A collection of nine simple black icons on a white background depicting concepts of decrease loss and downward trends using graphs charts and arrows. Isolated decrease vectors Set of black decline icons showing business failure and data reduction. A collection of nine simple black icons on a white background depicting concepts of decrease loss and downward trends using graphs charts and arrows
Free with trial A bar graph showing a downward trend with a red arrow indicating a decline. Isolated decrease illustrations Decreasing bar graph with downward arrow isolated on white background. A bar graph showing a downward trend with a red arrow indicating a decline
Free with trial A comprehensive collection of hand-drawn business and data visualization icons. This doodle-style set features a variety of essential elements, including different types of arrows, bar graphs, line charts, and pie charts. The sketchy, black and white illustrations are perfect for infographics, presentations, financial reports, and marketing materials. Each icon is isolated on a white background, representing concepts like growth, statistics, process flow, and direction. This versatile vector set is ideal for adding a creative, hand-made touch to any project related to analytics, finance, or strategy. Isolated decrease illustrations Hand Drawn Business and Finance Doodle Icon Set. A comprehensive collection of hand-drawn business and data visualization icons. This doodle-style set features a variety of essential elements, including different types of arrows, bar graphs, line charts, and pie charts. The sketchy, black and white illustrations are perfect for infographics, presentations, financial reports, and marketing materials. Each icon is isolated on a white background, representing concepts like growth, statistics, process flow, and direction. This versatile vector set is ideal for adding a creative, hand-made touch to any project related to analytics, finance, or strategy.
Free with trial Set line Gold bars Glass money jar with coin Employee dismissal Drop crude oil price Bank building Pie chart infographic Briefcase and Dollar rate decrease icon. Vector. Isolated decrease illustrations Set line Gold bars, Glass money jar with coin, Employee dismissal, Drop crude oil price, Bank building, Pie chart. Set line Gold bars Glass money jar with coin Employee dismissal Drop crude oil price Bank building Pie chart infographic Briefcase and Dollar rate decrease icon. Vector.
Free with trial Set Pie chart infographic, Dollar rate decrease, Shutdown of factory and Glass money jar with coin icon. Vector. Isolated decrease illustrations Set Pie chart infographic, Dollar rate decrease, Shutdown of factory and Glass money jar with coin icon. Vector
Free with trial Financial crisis, economic downturn, bankruptcy concept. 3D blue glass bar chart icon with arrow down, recession graph. Falling price, decline profit or asset value, decrease in sales. 3D illustration. Isolated decrease illustrations Financial crisis, economic downturn, bankruptcy concept. 3D blue glass bar chart icon with arrow down, recession graph. Falling