Free with trial Three large percentage signs are displayed on a white background. From left to right, the symbols are black, red, and light gray. Each percentage sign consists of two circles and a diagonal line, representing different emphasis or status, possibly indicating varied discount rates. Isolated decrease vectors Icon set percent sign, simple vector design. Three large percentage signs are displayed on a white background. From left to right, the symbols are black, red, and light gray. Each percentage sign consists of two circles and a diagonal line, representing different emphasis or status, possibly indicating varied discount rates.
Free with trial Green up and red down 3d arrow graph showing rising, descending trend, business result, profit or loss symbol symbol. Business arrow, goals concept. 3d world money symbols. Financial growth. Isolated decrease illustrations Green up and red down 3d arrow graph showing rising, descending trend, business result, 3d world money symbols. Financial growth. Green up and red down 3d arrow graph showing rising, descending trend, business result, profit or loss symbol symbol. Business arrow, goals concept. 3d world money symbols. Financial growth
Free with trial This image showcases a comprehensive collection of blue bar graphs and line graphs, presented in a grid format. Each graph depicts various data trends, including upward and downward movements, fluctuating patterns, and steady growth. The clean, modern design makes these icons ideal for representing financial data, market analysis, performance metrics, and business growth in presentations, reports, and websites. Isolated decrease illustrations Collection of Blue Bar and Line Graphs for Business Analytics. This image showcases a comprehensive collection of blue bar graphs and line graphs, presented in a grid format. Each graph depicts various data trends, including upward and downward movements, fluctuating patterns, and steady growth. The clean, modern design makes these icons ideal for representing financial data, market analysis, performance metrics, and business growth in presentations, reports, and websites.
Free with trial Four vector icons of the percent sign are displayed on a white background. The designs include: a solid black percent sign, a percent sign with outlined circles, one with a bold diagonal line and circular elements, and one with a thin outline. Isolated decrease vectors Icon set percent sign, simple vector design. Four vector icons of the percent sign are displayed on a white background. The designs include: a solid black percent sign, a percent sign with outlined circles, one with a bold diagonal line and circular elements, and one with a thin outline.
Free with trial Set Online sports betting Casino chip with dollar Horseshoe poker table game Lottery ticket Stacks paper money cash and Lucky player icon. Vector. Isolated decrease vectors Set Online sports betting, Casino chip with dollar, Horseshoe, poker table game, Lottery ticket, Stacks paper money cash. Set Online sports betting Casino chip with dollar Horseshoe poker table game Lottery ticket Stacks paper money cash and Lucky player icon. Vector.
Free with trial A black silhouette of a bar chart with three bars of decreasing height, representing a downward trend on a white background. Isolated decrease illustrations Black Bar Chart Icon Showing Decreasing Values on White Background graph data. A black silhouette of a bar chart with three bars of decreasing height, representing a downward trend on a white background
Free with trial Black icon of an upward arrow and a downward arrow on a white background Clear details and vibrant colors enha. Isolated decrease illustrations Up and down arrows icon on a white background direction movement. Black icon of an upward arrow and a downward arrow on a white background Clear details and vibrant colors enha
Free with trial Downward showing black downward pointing arrow at an angle on a white background keywords: arrow, down. Isolated decrease illustrations Black downward pointing arrow at an angle on a white background Keywords: arrow, down, downward. Downward showing black downward pointing arrow at an angle on a white background keywords: arrow, down
Free with trial A thick black curved arrow points downwards and to the right on a white background. Isolated decrease illustrations Black Curved Arrow Pointing Down and to the Right on White downward direction. A thick black curved arrow points downwards and to the right on a white background
Free with trial A clean 3D render featuring a bright blue arrow pointing upwards and a vibrant red arrow pointing downwards, positioned side-by-side. The arrows have rounded edges and a smooth, matte finish, casting subtle shadows on the white background. This imagery represents opposing directions, choices, or trends. Isolated decrease illustrations 3D Rendered Blue Up Arrow and Red Down Arrow Side by Side on White Background image photo. A clean 3D render featuring a bright blue arrow pointing upwards and a vibrant red arrow pointing downwards, positioned side-by-side. The arrows have rounded edges and a smooth, matte finish, casting subtle shadows on the white background. This imagery represents opposing directions, choices, or trends
Free with trial A realistic 3D render of a polished silver arrow pointing directly downwards, casting a subtle shadow. Isolated decrease illustrations Shiny metallic downward arrow icon on white background. A realistic 3D render of a polished silver arrow pointing directly downwards, casting a subtle shadow
Free with trial A black downward arrow with a percentage symbol and a jagged line inside it on a white background. Isolated decrease illustrations Black downward arrow with percentage sign and jagged line on white image photo. A black downward arrow with a percentage symbol and a jagged line inside it on a white background
Free with trial Mathematical showing black curve graph showing exponential decay on white background keywords: graph, chart. Isolated decrease illustrations Black curve graph showing exponential decay on white background Keywords: graph, chart, curve. Mathematical showing black curve graph showing exponential decay on white background keywords: graph, chart
Free with trial A graph with a curved line labeled "SOFT LANDING" shows a gradual decline on white. Isolated decrease illustrations Graph showing a soft landing curve with text on white background chart decline. A graph with a curved line labeled "SOFT LANDING" shows a gradual decline on white
Free with trial An troubled stock market investor holds the downward pointing arrow from a market chart in this 3-d illustration about investing. Isolated decrease illustrations An troubled stock market investor holds the downward pointing arrow from a market chart
Free with trial Hand drawn arrow black mark set. Isolated Hand-drawn arrows icons on white background. Different pointer collection. Simple drawing arrow pen. Vector illustration. Isolated decrease vectors Colection of black hand drawn arrow signs. Vector illustration. Hand drawn arrow black mark set. Isolated Hand-drawn arrows icons on white background. Different pointer collection. Simple drawing arrow pen. Vector illustration.
Free with trial Yellow Circle Minus Sign Symbol Icon Simple Minimalist Modern Flat Design Concept. Isolated decrease vectors Yellow Circle Minus Sign Symbol Icon Simple Minimalist Modern Flat Design Concept
Free with trial 3D rendered sticker of a red downturn arrow, with a transparent background. Isolated decrease illustrations 3D rendered sticker of a red downturn arrow, with a transparent background.
Free with trial A black arrow points downwards towards two horizontal steps on a white background. Isolated decrease illustrations Black Arrow Pointing Down Towards Steps Icon on White Background stairs decline. A black arrow points downwards towards two horizontal steps on a white background
Free with trial Up Down Arrowhead Icon North South Pointer Upload Download Pathway Path Location Navigation Position Sign Symbol Choice Movement Slide Swipe Gesture. Isolated decrease vectors Up Down Arrowhead Icon North South Pointer Upload Download Pathway Path Location Navigation Position Sign Symbol Choice
Free with trial A crisp, minimalist black percentage sign icon enclosed within a bold black circle, set against a clean white background. This flat vector illustration represents concepts such as discounts, sales, interest rates, statistics, and proportions. Its simple, modern design makes it highly versatile for various applications, including web and app interfaces, marketing materials, financial reports, e-commerce promotions, and infographics. Ideal for conveying numerical data, special offers, or mathematical concepts with clarity and impact. Isolated decrease illustrations Percentage Sign Icon in Circle. A crisp, minimalist black percentage sign icon enclosed within a bold black circle, set against a clean white background. This flat vector illustration represents concepts such as discounts, sales, interest rates, statistics, and proportions. Its simple, modern design makes it highly versatile for various applications, including web and app interfaces, marketing materials, financial reports, e-commerce promotions, and infographics. Ideal for conveying numerical data, special offers, or mathematical concepts with clarity and impact.
Free with trial A glossy red down arrow symbol is centered within a circular red border. The arrow has a bright light emanating from its tip, suggesting a glow or focus. The entire graphic is rendered in 3D and sits on a clean white background with a subtle shadow cast beneath it. Isolated decrease illustrations Red Down Arrow Symbol Inside a Circular Border on White Background red arrow download icon. A glossy red down arrow symbol is centered within a circular red border. The arrow has a bright light emanating from its tip, suggesting a glow or focus. The entire graphic is rendered in 3D and sits on a clean white background with a subtle shadow cast beneath it
Free with trial A minimalist, flat design icon depicting a speaker emitting sound waves. The graphic features a stylized speaker in dark purple black with prominent red sound wave arcs extending to the right, all set against a clean white background. This versatile vector illustration represents audio, volume, broadcast, or notification concepts. Ideal for modern user interfaces, mobile applications, websites, presentations, and any digital or print media requiring a clear and recognizable symbol for sound control or communication. Isolated decrease illustrations Speaker Volume Sound Waves Icon. A minimalist, flat design icon depicting a speaker emitting sound waves. The graphic features a stylized speaker in dark purple black with prominent red sound wave arcs extending to the right, all set against a clean white background. This versatile vector illustration represents audio, volume, broadcast, or notification concepts. Ideal for modern user interfaces, mobile applications, websites, presentations, and any digital or print media requiring a clear and recognizable symbol for sound control or communication.
Free with trial Subtract Symbol in Circular Shape with Shadow Effect in Gray and White Design Element. Isolated decrease vectors Subtract Symbol in Circular Shape with Shadow Effect in Gray and White Design Element
Free with trial Green Circle with White Minus Sign Illustrating Subtraction and Removal Operations. Isolated decrease illustrations Green Circle with White Minus Sign Illustrating Subtraction and Removal Operations
Free with trial A 3D cloud icon displays a downward trending graph and falling dollar coins, symbolizing financial decline or loss. Isolated decrease illustrations 3D Cloud Icon with Downward Trend Graph and Falling Dollar Coins finance economy. A 3D cloud icon displays a downward trending graph and falling dollar coins, symbolizing financial decline or loss
Free with trial A black bar graph icon with a downward arrow and trend line indicates a decline. Clear details and vibrant col. Isolated decrease illustrations Black Bar Graph Icon with Downward Arrow and Trend Line on White Background data. A black bar graph icon with a downward arrow and trend line indicates a decline. Clear details and vibrant col
Free with trial A black downward pointing arrow with the white word LOS inside it on a white background. Isolated decrease illustrations Downward pointing arrow with the word LOS in white on black background direction. A black downward pointing arrow with the white word LOS inside it on a white background
Free with trial A minimalist black geometric design featuring segmented rectangles stacked vertically to create a tapering effect against a plain white background. Isolated decrease vectors Hand-drawn minimalist black geometric stack of rectangles forming a vertical tapering progression on white illustration. A minimalist black geometric design. A minimalist black geometric design featuring segmented rectangles stacked vertically to create a tapering effect against a plain white background
Free with trial Red 3D zigzag arrow is trending downward on plain white background, casting faint shadow. Business decline, financial analysis, data visualization, modern design, digital marketing, growth reduction, minimalistic style. Isolated decrease illustrations Red 3D zigzag arrow is trending downward on plain white background, casting faint shadow
Free with trial Black bars decreasing in height diagonally on a white background, representing a downward trend or decline. Isolated decrease illustrations Black bars decreasing in height diagonally on a white background bar chart graph. Black bars decreasing in height diagonally on a white background, representing a downward trend or decline
Free with trial A minimalist set of hand-drawn icons featuring a dynamic arrow indicating movement or progress and a line graph displaying data trends, perfect for illustrating concepts of growth, analysis, and chang. Isolated decrease vectors Arrow and graph icons set isolated on transparent background. A minimalist set of hand-drawn icons featuring a dynamic arrow indicating movement or progress and a line graph displaying data trends, perfect for illustrating concepts of growth, analysis, and chang
Free with trial An illustration depicts the concepts of inflation and deflation with contrasting visual elements. The left side showcases a chaotic arrangement of currency and objects, representing inflation. Conversely, the right presents a structured, geometric composition associated with deflation. The design utilizes vibrant colors and a central arrow, symbolizing economic shifts, suitable for commercial and. Isolated decrease illustrations Inflation versus deflation economic concepts illustrated with currency and shapes. An illustration depicts the concepts of inflation and deflation with contrasting visual elements. The left side showcases a chaotic arrangement of currency and objects, representing inflation. Conversely, the right presents a structured, geometric composition associated with deflation. The design utilizes vibrant colors and a central arrow, symbolizing economic shifts, suitable for commercial and
Free with trial Declining graph with bar chart and down arrow, vector graphic. Isolated decrease vectors Declining graph with bar chart and down arrow, vector graphic
Free with trial Cartoon Style Zoom Out Icon with Crosshairs and Minus Symbol. Isolated decrease vectors Cartoon Style Zoom Out Icon with Crosshairs and Minus Symbol
Free with trial A set of twelve black icons representing business and data analysis concepts, presented on a white background. The icons include various types of charts and graphs such as bar charts, a pie chart, and line graphs showing trends and fluctuations. There are also icons for data visualization, progress indicators, and reports. The collection is organized in a 3x4 grid. Isolated decrease vectors Business and data analytics icons bar chart pie chart AI-Generated. A set of twelve black icons representing business and data analysis concepts, presented on a white background. The icons include various types of charts and graphs such as bar charts, a pie chart, and line graphs showing trends and fluctuations. There are also icons for data visualization, progress indicators, and reports. The collection is organized in a 3x4 grid
Free with trial This set contains business chart, magnifying glass. Good for market research and investment data collection concept design. Isolated decrease vectors Set of business chart statistic icon vector illustration on transparent background. This set contains business chart, magnifying glass. Good for market research and investment data collection concept design
Free with trial A 3D bar graph illustrating a downward trend with a green arrow, featuring a heart icon with a minus sign, on a white background. Isolated decrease illustrations 3D bar graph with a downward trending green arrow and a heart icon with a minus sign chart. A 3D bar graph illustrating a downward trend with a green arrow, featuring a heart icon with a minus sign, on a white background
Free with trial A black downward trending arrow composed of segmented pieces points diagonally down on a white background. Isolated decrease illustrations Black downward trending arrow with segmented segments on white background decline. A black downward trending arrow composed of segmented pieces points diagonally down on a white background
Free with trial Red 3D zigzag arrow line is rising then falling on white backdrop with shadow, copy space. Abstract, data visualization, minimalistic, motion, progress, decline, digital. Isolated decrease illustrations Red 3D zigzag arrow line is rising then falling on white backdrop with shadow, copy space
Free with trial A solid black arrow points diagonally downwards on a plain white background. Clear details and vibrant colors. Isolated decrease illustrations Black arrow pointing diagonally down on a white background direction. A solid black arrow points diagonally downwards on a plain white background. Clear details and vibrant colors
Free with trial Money Transfer Icons Set, Currency Exchange Logo, Crypto Financial Services. Vector illustration. Isolated decrease vectors Money Transfer Icons Set, Currency Exchange Logo, Crypto Financial Services. Vector
Free with trial A smooth, round 3D icon rendered in a neutral grey tone, featuring a centered horizontal white or light grey minus sign. The circular shape has subtle beveling and soft shadows, giving it a raised, tactile appearance. The minimalist design conveys a clean, intentional action�'perfect for representing removal, reduction, subtraction, or minimizing elements in user interfaces, financial tools, or. Isolated decrease vectors 3D grey round icon with minus sign representing remove decrease or deduct function. A smooth, round 3D icon rendered in a neutral grey tone, featuring a centered horizontal white or light grey minus sign. The circular shape has subtle beveling and soft shadows, giving it a raised, tactile appearance. The minimalist design conveys a clean, intentional action�'perfect for representing removal, reduction, subtraction, or minimizing elements in user interfaces, financial tools, or
Free with trial Three geometric ruby crystal rings are positioned concentrically on a white background. The crystals are faceted and red, with black outlines. The rings decrease in size toward the center. Isolated decrease illustrations Shiny Geometric Red Ruby Crystal Rings on White Background. Three geometric ruby crystal rings are positioned concentrically on a white background. The crystals are faceted and red, with black outlines. The rings decrease in size toward the center.
Free with trial Minus sign icon in gray circle with shadow. Button interface application round vector. Isolated decrease illustrations Minus sign icon in gray circle with shadow. Button interface application round vector
Free with trial Black percentage sign with a downward arrow and swirling lines, indicating a price reduction or economic. Isolated decrease illustrations Black percentage sign with a downward arrow and swirling lines on white background. Black percentage sign with a downward arrow and swirling lines, indicating a price reduction or economic
Free with trial Black triangular warning sign displaying a downward trending bar graph on a white background. Isolated decrease illustrations Warning sign with a downward trending bar graph on a white background danger caution. Black triangular warning sign displaying a downward trending bar graph on a white background
Free with trial A black line graph with two curves showing a downward trend on a white background. Isolated decrease illustrations Black line graph showing a downward trend with two lines on white background chart. A black line graph with two curves showing a downward trend on a white background
Free with trial Large icon group, inflation sign set, Profit, loss, purchasing power, successful and unsuccessful investments. Vector illustration. Isolated decrease vectors Large icon group, inflation sign set. Profit, loss, purchasing power, successful and unsuccessful investments. Vector illustration
Free with trial Green up and red down 3d arrow graph showing rising, descending trend, business result, profit or loss symbol symbol. Business arrow, goals concept. 3d world money symbols. Financial growth. Isolated decrease illustrations Green up and red down 3d arrow graph showing rising, descending trend, business result, 3d world money symbols. Financial growth. Green up and red down 3d arrow graph showing rising, descending trend, business result, profit or loss symbol symbol. Business arrow, goals concept. 3d world money symbols. Financial growth
Free with trial Green up and red down 3d arrow graph showing rising, descending trend, business result, profit or loss symbol symbol. Business arrow, goals concept. 3d world money symbols. Financial growth. Isolated decrease illustrations Green up and red down 3d arrow graph showing rising, descending trend, business result, 3d world money symbols. Financial growth. Green up and red down 3d arrow graph showing rising, descending trend, business result, profit or loss symbol symbol. Business arrow, goals concept. 3d world money symbols. Financial growth
Free with trial Green up and red down 3d arrow graph showing rising, descending trend, business result, profit or loss symbol symbol. Business arrow, goals concept. 3d world money symbols. Financial growth. Isolated decrease illustrations Green up and red down 3d arrow graph showing rising, descending trend, business result, 3d world money symbols. Financial growth. Green up and red down 3d arrow graph showing rising, descending trend, business result, profit or loss symbol symbol. Business arrow, goals concept. 3d world money symbols. Financial growth
Free with trial Green up and red down 3d arrow graph showing rising, descending trend, business result, profit or loss symbol symbol. Business arrow, goals concept. 3d world money symbols. Financial growth. Isolated decrease illustrations Green up and red down 3d arrow graph showing rising, descending trend, business result, 3d world money symbols. Financial growth. Green up and red down 3d arrow graph showing rising, descending trend, business result, profit or loss symbol symbol. Business arrow, goals concept. 3d world money symbols. Financial growth
Free with trial Green up and red down 3d arrow graph showing rising, descending trend, business result, profit or loss symbol symbol. Business arrow, goals concept. 3d world money symbols. Financial growth. Isolated decrease illustrations Green up and red down 3d arrow graph showing rising, descending trend, business result, 3d world money symbols. Financial growth. Green up and red down 3d arrow graph showing rising, descending trend, business result, profit or loss symbol symbol. Business arrow, goals concept. 3d world money symbols. Financial growth
Free with trial Black and White Vector Illustration. Sugar Cubes and Candy. Healthy Eating. Healthy Lifestyle. Weight Loss Concept. Isolated decrease vectors Sugar Reduction Icons. Black and White Vector Illustration. Sugar Cubes and Candy. Healthy Eating. Healthy Lifestyle. Weight Loss Concept
Free with trial Woman suffers from slow internet and pushes loading bar with snail, needing to connect to 5G network. Problems with internet causing decrease in productivity for completing work tasks. Isolated decrease vectors Woman suffers from slow internet and pushes loading bar with snail, needing to connect to 5G network
Free with trial Hair thinning is hair problems for men illustration. The man with thin hair, that can from genetics, hormonal changes, medical conditions, stress, poor nutrition and can be temporary or permanent. Isolated decrease vectors The man with hair thinning vector illustration isolated on white background. Hair thinning is hair problems for men illustration. The man with thin hair, that can from genetics, hormonal changes, medical conditions, stress, poor nutrition and can be temporary or permanent.
Free with trial Black line graph showing a downward trend on a white background with grid lines chart. Isolated decrease illustrations Black line graph showing a downward trend on a white background with grid lines chart
Free with trial A black graph shows a market normalization flat trend with a downward arrow on a white background. Isolated decrease illustrations Market normalization flat trend graph with downward arrow on white background image. A black graph shows a market normalization flat trend with a downward arrow on a white background
Free with trial A black icon showing a bar graph with a downward trending arrow indicating a decline. Isolated decrease illustrations Black bar graph with downward trending arrow icon on white background chart decline. A black icon showing a bar graph with a downward trending arrow indicating a decline
Free with trial Black silhouette of a downward pointing arrow with horizontal lines and dotted line Macro view of bright green moss covered with numerous clear water droplets reflecting light, creating a sparkling texture. Isolated decrease illustrations Black silhouette of a downward pointing arrow with horizontal lines and dotted line
Free with trial A black silhouette of a bar chart with a vertical scale and grid lines, representing data analysis. Isolated decrease illustrations Black bar chart icon with grid lines and scale on white background graph statistics. A black silhouette of a bar chart with a vertical scale and grid lines, representing data analysis
Free with trial A large, bold, three-dimensional red number six followed by a red percent symbol, isolated on a clean white background. Isolated decrease illustrations Bold red six percent symbol on white background. A large, bold, three-dimensional red number six followed by a red percent symbol, isolated on a clean white background
Free with trial Up or down line icon on white, eps 10 file, easy to edit. Isolated decrease vectors Up or down line icon on white
Free with trial Carbon footprint erasing vector icon. Hand drawn doodle illustration of eraser removing CO2 pollution cloud. Concept of emissions reduction, climate change mitigation, and environmental responsibility for a clean future. Vector illustration. Isolated decrease vectors Carbon footprint erasing vector icon. Hand drawn doodle illustration of eraser removing CO2 pollution cloud. Emissions reduction. Carbon footprint erasing vector icon. Hand drawn doodle illustration of eraser removing CO2 pollution cloud. Concept of emissions reduction, climate change mitigation, and environmental responsibility for a clean future. Vector illustration
Free with trial Black icon of a rising line graph with arrow pointing down on white background chart. Isolated decrease illustrations Black icon of a rising line graph with arrow pointing down on white background chart
Free with trial A black downward arrow points to a black euro coin icon on a white background. Clear details and vibrant color. Isolated decrease illustrations Black downward arrow pointing to a euro coin icon on white background currency money. A black downward arrow points to a black euro coin icon on a white background. Clear details and vibrant color
Free with trial A downward arrow points to a stack of coins with a dollar sign on white. Clear details and vibrant colors enha. Isolated decrease illustrations Downward arrow pointing to stack of coins with dollar sign on white background money. A downward arrow points to a stack of coins with a dollar sign on white. Clear details and vibrant colors enha
Free with trial Simple black bar graph icon with bars of varying heights on a white background Clear details and vibrant color. Isolated decrease illustrations Simple black bar graph icon showing varying heights on a white background chart data. Simple black bar graph icon with bars of varying heights on a white background Clear details and vibrant color
Free with trial A flat design illustration of two bar charts, one green and one red, both showing a downward trend with arrows, representing financial or business decline. Isolated decrease illustrations Bar chart showing declining trend isolated on white background. A flat design illustration of two bar charts, one green and one red, both showing a downward trend with arrows, representing financial or business decline
Free with trial Gray circle with minus sign, mathematical symbol or negative icon, simple design element. Isolated decrease illustrations Gray circle with minus sign, mathematical symbol or negative icon, simple design element
Free with trial A stack of coins with a dollar sign and a downward arrow are depicted on a white background. Isolated decrease illustrations Stack of coins with dollar sign and downward arrow on white background money currency. A stack of coins with a dollar sign and a downward arrow are depicted on a white background
Free with trial Three black arrows pointing down connected by horizontal lines on a white background. Isolated decrease illustrations Three Black Arrows Pointing Downward Connected by Horizontal Lines direction movement. Three black arrows pointing down connected by horizontal lines on a white background
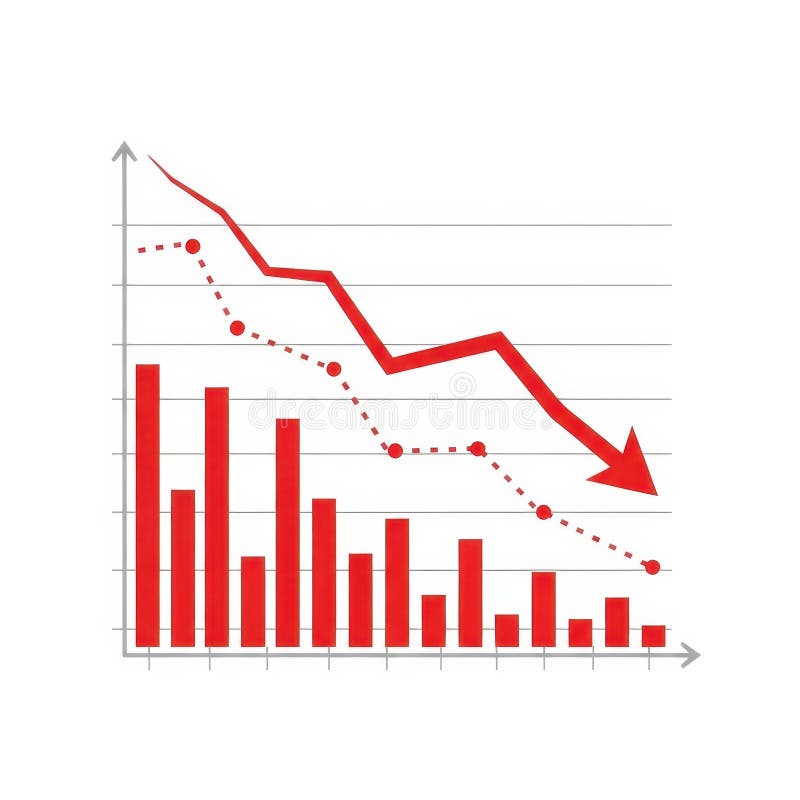
Free with trial A visual representation of negative financial performance, illustrating a significant downward trend with a red arrow pointing downwards, indicating a loss or decline in value. Isolated decrease illustrations Red graph showing a downward trend isolated on white background. A visual representation of negative financial performance, illustrating a significant downward trend with a red arrow pointing downwards, indicating a loss or decline in value
Free with trial Minus Sign in Round Icon, Emphasizing Subtraction, Deduction, Reduction or Negative Concept. Isolated decrease vectors Minus Sign in Round Icon, Emphasizing Subtraction, Deduction, Reduction or Negative Concept
Free with trial A halftone dotted pattern with a white background. The black dots are arranged in a gradient, varying in size to create a wave-like effect. The dots are more concentrated at the edges and gradually decrease towards the center, creating an illusion of depth and movement. The design is symmetrical and visually balanced, emphasizing the contrast between the black dots and the white space. Isolated decrease vectors Halftone dotted background pattern Halftone texture isolated on the white background. A halftone dotted pattern with a white background. The black dots are arranged in a gradient, varying in size to create a wave-like effect. The dots are more concentrated at the edges and gradually decrease towards the center, creating an illusion of depth and movement. The design is symmetrical and visually balanced, emphasizing the contrast between the black dots and the white space.
Free with trial Stock Market Loss 3D Icon, Isolated on White Background. Isolated decrease illustrations Stock Market Loss 3D Icon
Free with trial Business bar graph icon vector with upward and downward arrow. Trend analysis symbol with long shadow. Isolated decrease vectors Business bar graph icon with upward and downward arrow. Trend analysis symbol with long shadow