Free with trial A black downward trending arrow with a jagged line graph on a white background. Clear details and vibrant colo. Isolated decrease illustrations Black downward trending arrow with jagged line graph on white background decline. A black downward trending arrow with a jagged line graph on a white background. Clear details and vibrant colo
Free with trial Black icon showing a declining graph with a falling arrow and ice cube. Clear details and vibrant colors enhan. Isolated decrease illustrations Black icon of a downward trending graph with a falling arrow and ice cube chart decline. Black icon showing a declining graph with a falling arrow and ice cube. Clear details and vibrant colors enhan
Free with trial Line chart decreae icon linear vector graphics sign or symbol set for web app ui. Isolated decrease vectors Line chart decreae icon Flat line illustration. Line chart decreae icon linear vector graphics sign or symbol set for web app ui
Free with trial A black bar graph showing a downward trend with an arrow pointing down. Clear details and vibrant colors enhan. Isolated decrease illustrations Black bar graph with a downward trending arrow on white background chart decline. A black bar graph showing a downward trend with an arrow pointing down. Clear details and vibrant colors enhan
Free with trial Clean and simple downward arrow symbol in bold black on a plain white background, ideal for web design, user interfaces, infographics, and business presentations. Isolated decrease vectors Minimalist black downward arrow icon on white background for business and design. Clean and simple downward arrow symbol in bold black on a plain white background, ideal for web design, user interfaces, infographics, and business presentations
Free with trial Carbon management icon, reducing co2 gas emission, eps 10 file, easy to edit. Isolated decrease vectors Carbon management icon, reducing co2 gas emission
Free with trial Minus icon Black line art vector in black and white outline set collection sign. Isolated decrease vectors Minus icon Thin line flat illustration. Minus icon Black line art vector in black and white outline set collection sign
Free with trial Zoom out icon Flat fill set collection vector outline logo. Isolated decrease vectors Zoom out icon Flat fill set collection
Free with trial Up down arrow icon in rounded corner. Upward downward arrows sign symbol vector. Isolated decrease vectors Up down arrow icon in rounded corner. Upward downward arrows sign symbol
Free with trial Simple black icon of a declining bar chart with a downward arrow showing financial loss. Isolated decrease vectors Simple black icon of a declining bar chart with a downward arrow showing financial loss
Free with trial A 3D rendering depicting a financial chart with a downward arrow, detailed statistics, and digital effects on a white. Isolated decrease illustrations A 3D rendering depicting a financial chart with a downward arrow, detailed statistics, and digital effects on a white
Free with trial Hand is holding a stack of coins with a percentage symbol next to it, representing the concept of interest rate growth. Isolated decrease illustrations Hand holding stack of coins representing interest rate growth. Hand is holding a stack of coins with a percentage symbol next to it, representing the concept of interest rate growth
Free with trial A black downward trending graph inside a warning triangle on a white background Clear details and vibrant colo. Isolated decrease illustrations Black downward trending graph inside a warning triangle on white background chart. A black downward trending graph inside a warning triangle on a white background Clear details and vibrant colo
Free with trial A black downward pointing arrow positioned above a thick horizontal line on white. Isolated decrease illustrations Black downward arrow above a horizontal line on white background direction symbol. A black downward pointing arrow positioned above a thick horizontal line on white
Free with trial A black bar graph illustrates margin compression with text on a white background. Clear details and vibrant co. Isolated decrease illustrations Black bar graph with MARGINCOMPRESION text on white background margin compression. A black bar graph illustrates margin compression with text on a white background. Clear details and vibrant co
Free with trial Metallic 3D text 'Reduce' with downward arrow. Isolated decrease illustrations Reduce concept with metallic 3d text and arrow isolated on transparent background. Metallic 3D text 'Reduce' with downward arrow
Free with trial A vibrant 3D rendering of a percentage symbol, highlighting financial concepts, sales, discounts, and offers. Isolated decrease illustrations Dynamic 3d glossy percentage symbol with red textured material and golden outline. A vibrant 3D rendering of a percentage symbol, highlighting financial concepts, sales, discounts, and offers
Free with trial Black silhouette icon of a light bulb falling on a declining graph, representing a bad idea. Isolated decrease illustrations Light bulb falling on declining graph icon. Black silhouette icon of a light bulb falling on a declining graph, representing a bad idea
Free with trial Carbon management line icon, reducing co2 gas emission vector. Isolated decrease vectors Carbon management icon, reducing co2 gas emission. carbon management line icon, reducing co2 gas emission vector
Free with trial Abstract white block chart representing data or business decline on light background. Isolated decrease illustrations Abstract white block chart representing data or business decline on light background
Free with trial Money bag with a dollar sign is losing value, as indicated by the red minus sign. Isolated decrease illustrations Money bag losing value with minus sign showing negative trend. Money bag with a dollar sign is losing value, as indicated by the red minus sign
Free with trial Reduce waste icon, vector pictogram, eps 10 file, easy to edit. Isolated decrease vectors Reduce waste icon, vector pictogram
Free with trial A minimalist black line graph with circular data points and vertical bars is depicted on a white background. Isolated decrease illustrations Simple black line graph with bars and circles on white background chart statistics. A minimalist black line graph with circular data points and vertical bars is depicted on a white background
Free with trial Horizontal showing black horizontal line with downward pointing triangle on white background keywords: line. Isolated decrease illustrations Black horizontal line with downward pointing triangle on white background Keywords: line
Free with trial A vibrant, 3D rendered percentage symbol in a glossy purple hue. The symbol floats in a studio setting against a clean, light gray background with subtle shadowing. Its smooth, reflective surface and bold form suggest concepts of finance, sales, and discounts. Isolated decrease illustrations A3D Rendered Purple Percentage Symbol Floating on a White Background sign discount. A vibrant, 3D rendered percentage symbol in a glossy purple hue. The symbol floats in a studio setting against a clean, light gray background with subtle shadowing. Its smooth, reflective surface and bold form suggest concepts of finance, sales, and discounts
Free with trial A 3D bar chart composed of four colored bars (orange, green, white, and blue) stands on a black base. A line graph with red dots connects the tops of the bars, showing a fluctuating trend that culminates in a sharp downward movement indicated by a red arrow. This visual represents a negative financial trend or economic decline. Isolated decrease illustrations 3D Bar Chart with Downward Trend Line and Arrow Indicating Financial Decline graph. A 3D bar chart composed of four colored bars (orange, green, white, and blue) stands on a black base. A line graph with red dots connects the tops of the bars, showing a fluctuating trend that culminates in a sharp downward movement indicated by a red arrow. This visual represents a negative financial trend or economic decline
Free with trial A 3D rendered icon features a bold white arrow pointing downwards, curved slightly as it descends. This arrow is centrally placed within a solid, bright blue circle. The entire icon is presented on a clean, white background, making it stand out clearly. The design is simple and modern, suitable for digital interfaces or informational graphics. Isolated decrease illustrations 3D icon of a white downward pointing arrow inside a blue circle on a white background symbol. A 3D rendered icon features a bold white arrow pointing downwards, curved slightly as it descends. This arrow is centrally placed within a solid, bright blue circle. The entire icon is presented on a clean, white background, making it stand out clearly. The design is simple and modern, suitable for digital interfaces or informational graphics
Free with trial Hand drawn isometric arrow set featuring up and down directions for business and navigation. Isolated decrease vectors Hand drawn isometric arrow set featuring up and down directions for business and navigation
Free with trial Up down arrow icon vector on black circle. Isolated decrease vectors Up down arrow icon on black circle. Up down arrow icon vector on black circle
Free with trial Collagen production in women based on age. Medical, healthcare infographics. Important information. Menopause problem. Editable vector illustration isolated on a white background. Horizontal banner. Isolated decrease vectors Collagen production in women based on age.
Free with trial Business Strategy and Analysis: Lightbulb, Magnifying Glass, Briefcases, and Data Illustration. Isolated decrease vectors Business Strategy and Analysis Lightbulb Magnifying Glass Briefcases and Data Illustration.
Free with trial Cartoon Blue Subtract Button or Icon for Minus Symbol Depiction, with Lines Illustration. Isolated decrease vectors Cartoon Blue Subtract Button or Icon for Minus Symbol Depiction, with Lines Illustration
Free with trial Volume down icon linear vector graphics sign or symbol set for web app ui. Isolated decrease vectors Volume down icon Flat line illustration. Volume down icon linear vector graphics sign or symbol set for web app ui
Free with trial Volume down icon linear vector graphics sign or symbol set for web app ui. Isolated decrease vectors Volume down icon Flat line illustration. Volume down icon linear vector graphics sign or symbol set for web app ui
Free with trial Up down arrow icon vector on black square. Isolated decrease vectors Up down arrow icon on black square. Up down arrow icon vector on black square
Free with trial Reduce CO2 gas emissions, carbon footprint, stop climate changes on Earth. Vector isolated hand holding sign, taking part in nature protection and preservation, strike or ecoactivists people. Isolated decrease vectors Ecological changes and care for nature. Reduce CO2 gas emissions, carbon footprint, stop climate changes on Earth. Vector isolated hand holding sign, taking part in nature protection and preservation, strike or ecoactivists people
Free with trial Black candlestick chart with downward trend and arrow on white. Clear details and vibrant colors enhance visua. Isolated decrease illustrations Black candlestick chart with downward trend and arrow on white stock market trading. Black candlestick chart with downward trend and arrow on white. Clear details and vibrant colors enhance visua
Free with trial A whimsical 3D illustration featuring a bright yellow alarm clock with a blue face and black numbers. The clock is positioned next to a cheerful, smiling cartoon sun with radiating rays. A prominent blue downward arrow is placed in front of the clock and sun, suggesting a concept related to time change or a decrease. The entire composition is set against a clean white background. Isolated decrease illustrations A Yellow Alarm Clock with a Blue Face Next to a Smiling Sun and a Down Arrow time morning. A whimsical 3D illustration featuring a bright yellow alarm clock with a blue face and black numbers. The clock is positioned next to a cheerful, smiling cartoon sun with radiating rays. A prominent blue downward arrow is placed in front of the clock and sun, suggesting a concept related to time change or a decrease. The entire composition is set against a clean white background
Free with trial A solid blue arrow graphic indicates a downward and leftward direction against a plain white backdrop. Isolated decrease vectors Blue Arrow Pointing Down-Left on White Background, Simple Graphic, Directional Symbol. A solid blue arrow graphic indicates a downward and leftward direction against a plain white backdrop
Free with trial Circular Download Arrow Symbol Vector Graphic for Data Transfer and Upload Operations. Isolated decrease vectors Circular Download Arrow Symbol Vector Graphic for Data Transfer and Upload Operations
Free with trial Stack of gold coins crossed out depicting financial loss, bankruptcy, or economic downturn. Isolated decrease illustrations Stack of gold coins being crossed out depicting financial loss. Stack of gold coins crossed out depicting financial loss, bankruptcy, or economic downturn
Free with trial Glossy blue minus sign icon with white border and subtle shadow on gradient background. Isolated decrease illustrations Glossy blue minus sign icon with white border and subtle shadow on gradient background
Free with trial Lower cost icon Vector symbol or sign set collection in black and white outline. Isolated decrease vectors Lower cost icon mark in filled style. Lower cost icon Vector symbol or sign set collection in black and white outline
Free with trial Interest rate changes on timber cubes. Green arrow up and red arrow down symbols. Finance concept for investment growth and decline. Business metaphor icons. Isolated decrease illustrations Wooden blocks with percentage sign and arrows represent financial market fluctuation. Interest rate changes on timber cubes. Green arrow up and red arrow down. Interest rate changes on timber cubes. Green arrow up and red arrow down symbols. Finance concept for investment growth and decline. Business metaphor icons
Free with trial A 3D green funnel diagram is presented against a white background. The funnel is composed of four distinct, stacked square layers that decrease in size as they descend, creating a tapering effect. The interior of the funnel is hollow, revealing the layered structure. This visual represents a process, such as sales or marketing, where elements are filtered or narrowed down through stages. Isolated decrease illustrations 3D Green Funnel Diagram with Multiple Layers on a White Background process marketing. A 3D green funnel diagram is presented against a white background. The funnel is composed of four distinct, stacked square layers that decrease in size as they descend, creating a tapering effect. The interior of the funnel is hollow, revealing the layered structure. This visual represents a process, such as sales or marketing, where elements are filtered or narrowed down through stages
Free with trial Line art bar graph icon set featuring upward and downward trend arrows for business analysis. Isolated decrease vectors Line art bar graph icon set featuring upward and downward trend arrows for business analysis
Free with trial Illustration of a descending arrow with shading, outlining, and a shadow, showing direction. Isolated decrease vectors Illustration of a descending arrow with shading, outlining, and a shadow, showing direction
Free with trial Two bright yellow 3D arrows are positioned vertically on a light gray background. The top arrow points upwards, and the bottom arrow points downwards, creating a clear visual representation of opposite directions. The arrows have a smooth, rounded appearance and are slightly separated. This graphic symbolizes movement, change, and opposing forces. Isolated decrease illustrations Yellow Up and Down Arrows 3D Rendered on a Light Gray Background direction movement. Two bright yellow 3D arrows are positioned vertically on a light gray background. The top arrow points upwards, and the bottom arrow points downwards, creating a clear visual representation of opposite directions. The arrows have a smooth, rounded appearance and are slightly separated. This graphic symbolizes movement, change, and opposing forces
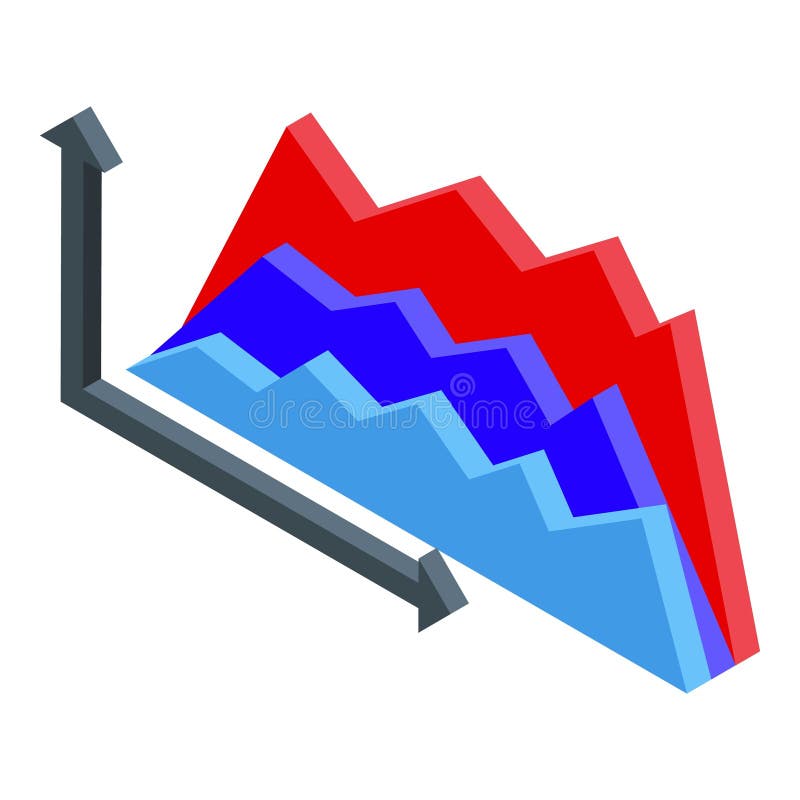
Free with trial Isometric graph showing different trends with ups and downs, concept of trading and business analysis. Isolated decrease illustrations Isometric graph showing different trends with ups and downs
Free with trial Cartoon icon of the thai baht currency symbol dropping on a green candlestick chart. Isolated decrease vectors Thai baht currency symbol dropping on candlestick chart icon. Cartoon icon of the thai baht currency symbol dropping on a green candlestick chart
Free with trial Simple black bar chart with two bars of different heights on a white background graph. Isolated decrease illustrations Simple black bar chart with two bars of different heights on a white background graph
Free with trial A black bar graph icon illustrating a downward trend with a down arrow on a white background. Isolated decrease illustrations Black bar graph icon showing a downward trend with an arrow on white background chart. A black bar graph icon illustrating a downward trend with a down arrow on a white background
Free with trial Black silhouette graph depicting a downward trend with the text "Early Accumulation Zone" below. Isolated decrease illustrations Black Silhouette Graph Showing Downward Trend with Text Early Accumulation Zone chart. Black silhouette graph depicting a downward trend with the text "Early Accumulation Zone" below
Free with trial A black outline arrow icon curving downwards on a white background. Clear details and vibrant colors enhance v. Isolated decrease illustrations Black outline arrow icon curving downwards on white background Keywords: arrow, down, downward. A black outline arrow icon curving downwards on a white background. Clear details and vibrant colors enhance v
Free with trial A line graph with a blue arrow pointing downwards, indicating a decline in value over time. the graph has a white background and features a series of colored sections, gradating from blue to green to yellow. Isolated decrease illustrations A graph showing a downward trend over time with a blue arrow isolated on white background. a line graph with a blue arrow pointing downwards, indicating a decline in value over time. the graph has a white background and features a series of colored sections, gradating from blue to green to yellow
Free with trial This 3D illustration illustrates the decline of a financial stock market chart, with a red arrow pointing downwards. The. Isolated decrease illustrations This 3D illustration illustrates the decline of a financial stock market chart, with a red arrow pointing downwards. The
Free with trial Up down arrow line icon on black circle. Upward downward arrows sign symbol vector. Isolated decrease vectors Up down arrow line icon on black circle. Upward downward arrows sign symbol
Free with trial Uptrend and downtrend arrow icon on black square. Rise and fall sign symbol. Isolated decrease vectors Uptrend and downtrend arrow icon on black square
Free with trial A blue arrow pointing up and down on a dark blue background with a gradient light effect above it. Generative AI. Isolated decrease illustrations A blue arrow pointing up and down on a dark blue background with a gradient light effect above it
Free with trial Bar chart with decreasing arrow icon symbolizing recession downturn and business failure. Isolated decrease vectors Bar chart with decreasing arrow icon symbolizing recession downturn and business failure
Free with trial A black line graph with an arrow indicating a downward trend on a white background. Isolated decrease illustrations Black line graph showing a downward trend with arrow on white background chart decline. A black line graph with an arrow indicating a downward trend on a white background
Free with trial A black line graph depicts a sharp downward trend with the text Drawdown Phase below. Isolated decrease illustrations Black line graph showing a sharp downward trend with text Drawdown Phase chart decline. A black line graph depicts a sharp downward trend with the text Drawdown Phase below
Free with trial A black graph illustrating a steep downward trend with multiple curved lines and an arrow. Isolated decrease illustrations Black graph showing a steep downward trend with multiple lines and arrow chart decline. A black graph illustrating a steep downward trend with multiple curved lines and an arrow
Free with trial Minimalist black and white circular sign featuring a bold downward arrow, ideal for financial reports, market trends, business decline, or reduction concepts in presentations and infographics. Isolated decrease vectors Bold downward arrow in black and white circular sign for business decline or reduction. Minimalist black and white circular sign featuring a bold downward arrow, ideal for financial reports, market trends, business decline, or reduction concepts in presentations and infographics
Free with trial Simple graphic illustration of a bar chart depicting a downward trend for business and finance. Isolated decrease vectors Simple graphic illustration of a bar chart depicting a downward trend for business and finance
Free with trial Carbon credit concept to reduce carbon emissions, net zero greenhouse gas emissions target isolated on clean white background, plants and urban areas on lush green land, Generative Ai. Isolated decrease illustrations Generative Ai, carbon credit concept to reduce carbon emissions, net zero greenhouse gas emissions target. carbon credit concept to reduce carbon emissions, net zero greenhouse gas emissions target isolated on clean white background, plants and urban areas on lush green land, Generative Ai
Free with trial Carbon credit concept to reduce carbon emissions, net zero greenhouse gas emissions target isolated on clean white background, plants and urban areas on lush green land, Generative Ai. Isolated decrease illustrations Generative Ai, carbon credit concept to reduce carbon emissions, net zero greenhouse gas emissions target. carbon credit concept to reduce carbon emissions, net zero greenhouse gas emissions target isolated on clean white background, plants and urban areas on lush green land, Generative Ai
Free with trial Carbon credit concept to reduce carbon emissions, net zero greenhouse gas emissions target isolated on clean white background, plants and urban areas on lush green land, Generative Ai. Isolated decrease illustrations Generative Ai, carbon credit concept to reduce carbon emissions, net zero greenhouse gas emissions target. carbon credit concept to reduce carbon emissions, net zero greenhouse gas emissions target isolated on clean white background, plants and urban areas on lush green land, Generative Ai
Free with trial Carbon credit concept to reduce carbon emissions, net zero greenhouse gas emissions target isolated on clean white background, plants and urban areas on lush green land, Generative Ai. Isolated decrease illustrations Generative Ai, carbon credit concept to reduce carbon emissions, net zero greenhouse gas emissions target. carbon credit concept to reduce carbon emissions, net zero greenhouse gas emissions target isolated on clean white background, plants and urban areas on lush green land, Generative Ai
Free with trial Wooden blocks arranged as a declining graph on a red background, representing financial loss. Isolated decrease illustrations Wooden blocks arranged as a declining graph on a red background, representing financial loss
Free with trial A 3D render of a gold coin with a textured edge. The coin's face features a black circular inlay displaying a golden bar graph with bars decreasing in height from left to right, symbolizing a financial decline or loss. The coin is presented against a clean white background. Isolated decrease illustrations Gold Coin with Falling Bar Graph Symbol on Black Circle Against White Background chart. A 3D render of a gold coin with a textured edge. The coin's face features a black circular inlay displaying a golden bar graph with bars decreasing in height from left to right, symbolizing a financial decline or loss. The coin is presented against a clean white background
Free with trial Ban carbon emissions line icon on white, eps 10 file, easy to edit. Isolated decrease vectors Ban carbon emissions line icon on white
Free with trial A black horizontal line with a black downward pointing arrow below it on a white background. Isolated decrease illustrations Black horizontal line with downward pointing arrow on white background direction symbol. A black horizontal line with a black downward pointing arrow below it on a white background
Free with trial Black line graph showing a downward trend with an arrow on a white background Clear details and vibrant colors. Isolated decrease illustrations Black line graph showing a downward trend with arrow on white background Keywords: graph, chart. Black line graph showing a downward trend with an arrow on a white background Clear details and vibrant colors
Free with trial The image showcases a collection of visual representations of various business performance metrics, such as growth percentages, market shares, and financial gains. Each cube features different types of charts and graphs, including bar graphs, line graphs, pie charts, and target indicators, illustrating growth rates like 5%, 8%, 15%, and market share percentages. The visuals emphasize positive and. Isolated decrease illustrations Diverse business performance metrics and growth indicators isolated on white background. The image showcases a collection of visual representations of various business performance metrics, such as growth percentages, market shares, and financial gains. Each cube features different types of charts and graphs, including bar graphs, line graphs, pie charts, and target indicators, illustrating growth rates like 5%, 8%, 15%, and market share percentages. The visuals emphasize positive and
Free with trial The image illustrates a conceptual representation of economic growth juxtaposed with central bank monetary policy. Stacks of gold coins symbolize economic prosperity and wealth, while a green upward arrow indicates growth. In contrast, a red percentage symbol with a slash signifies a reduction in interest rates, often implemented by central banks to stimulate economic activity. The classical. Isolated decrease illustrations Economic growth and central bank interest rate adjustments isolated on white background. The image illustrates a conceptual representation of economic growth juxtaposed with central bank monetary policy. Stacks of gold coins symbolize economic prosperity and wealth, while a green upward arrow indicates growth. In contrast, a red percentage symbol with a slash signifies a reduction in interest rates, often implemented by central banks to stimulate economic activity. The classical
Free with trial Resize down icon Flat outline Collection in Black and white background. Isolated decrease vectors Resize down icon flat and simple set design. Resize down icon Flat outline Collection in Black and white background
Free with trial Percent down icon set in black and white filled and outlined stroke style. Isolated decrease vectors Percent down icon
Free with trial Line art and solid drop icon set featuring a down arrow inside for water level and download concepts. Isolated decrease vectors Line art and solid drop icon set featuring a down arrow inside for water level and download concepts