Free with trial Up and down direction arrow icon set on circle line. Upward and downward concept. Isolated decrease vectors Up and down direction arrow icon set on circle line
Free with trial A bright yellow arrow pointing downwards, presented clearly against a pure white background, signifying direction or a downward trend in a simple, clean graphic. Isolated decrease illustrations Yellow down arrow isolated on white background. A bright yellow arrow pointing downwards, presented clearly against a pure white background, signifying direction or a downward trend in a simple, clean graphic
Free with trial A bright red balloon hovers above a bold blue percentage sign against a stark white background. Isolated decrease illustrations Red balloon floats above blue percentage symbol. A bright red balloon hovers above a bold blue percentage sign against a stark white background
Free with trial Alignment icon Flat set in black and white color outline vector. Isolated decrease vectors Alignment icon Flat set in black and white color
Free with trial Statistic Up icon outline collection or set in black and white. Isolated decrease vectors Statistic Up icon Line Art Logo set. Statistic Up icon outline collection or set in black and white
Free with trial Downward zigzag arrow icon on black circle. Market crash sign symbol vector. Isolated decrease vectors Downward zigzag arrow icon on black circle. Market crash sign symbol
Free with trial Simple vector icon representing a bar graph with a big arrow pointing down. Isolated decrease illustrations Big arrow pointing down on a decreasing bar graph icon. Simple vector icon representing a bar graph with a big arrow pointing down
Free with trial Line graph is representing a market trend with decreasing values. Isolated decrease vectors Line graph showing market trend with decreasing values. Line graph is representing a market trend with decreasing values
Free with trial Bitcoin chart icons set outline vector. Benefit fintech. Cash coin thin line color flat on white. Isolated decrease vectors Bitcoin chart icons set vector color line. Bitcoin chart icons set outline vector. Benefit fintech. Cash coin thin line color flat on white
Free with trial A red arrow is showing the trend of the market to a downtrend. Background for the economy and data analysis. Isolated decrease vectors Red Downtrend Arrow Object Abstract Background. A red arrow is showing the trend of the market to a downtrend. Background for the economy and data analysis.
Free with trial Line icon illustration representing a global wheat crisis with a downward arrow symbolizing decreasing production. Isolated decrease illustrations Global wheat crisis icon showing decreasing production. Line icon illustration representing a global wheat crisis with a downward arrow symbolizing decreasing production
Free with trial Scalability multi colored flat icons on plain square backgrounds. Included white and darker icon variations for hover or active effects. Isolated decrease vectors Scalability square flat multi colored icons. Scalability multi colored flat icons on plain square backgrounds. Included white and darker icon variations for hover or active effects
Free with trial A conceptual 3D illustration depicting a white growth arrow on a collapsing bar chart. The crumbling blocks and debris symbolize a dramatic failure or downturn. This powerful metaphor represents concepts such as financial crisis, economic recession, stock market crash, business bankruptcy, or unsustainable growth built on a fragile foundation. The minimalist gray background focuses attention on the central theme of collapse and risk, making it ideal for financial reports, business presentations, and articles about economic instability. Isolated decrease illustrations Economic Crisis and Crumbling Growth Chart. A conceptual 3D illustration depicting a white growth arrow on a collapsing bar chart. The crumbling blocks and debris symbolize a dramatic failure or downturn. This powerful metaphor represents concepts such as financial crisis, economic recession, stock market crash, business bankruptcy, or unsustainable growth built on a fragile foundation. The minimalist gray background focuses attention on the central theme of collapse and risk, making it ideal for financial reports, business presentations, and articles about economic instability.
Free with trial Financial loss icon design vector illustration. Isolated decrease vectors Financial loss icon design vector illustration
Free with trial A family of traditional Russian matryoshka dolls stands in a neat row, arranged by size from largest to smallest. Each hand-painted wooden figure represents a layer of a whole, symbolizing generations, growth, and the hidden depths within a unified structure. Isolated decrease illustrations Colorful Russian Matryoshka Dolls in a Row. A family of traditional Russian matryoshka dolls stands in a neat row, arranged by size from largest to smallest. Each hand-painted wooden figure represents a layer of a whole, symbolizing generations, growth, and the hidden depths within a unified structure
Free with trial A bold white percentage symbol displayed centrally on a solid black background, representing discounts, statistics, or general numerical proportions. Isolated decrease illustrations White percentage symbol on black background. A bold white percentage symbol displayed centrally on a solid black background, representing discounts, statistics. A bold white percentage symbol displayed centrally on a solid black background, representing discounts, statistics, or general numerical proportions
Free with trial Coupon with discount showing graph going down, simple black line vector icon. Isolated decrease illustrations Coupon with discount showing graph going down line icon. Coupon with discount showing graph going down, simple black line vector icon
Free with trial Green arrow pointing down representing negative trend in business. Isolated decrease illustrations Long green arrow is pointing down on a white background. Green arrow pointing down representing negative trend in business
Free with trial Blue three dimensional arrow pointing down on a white background. Isolated decrease illustrations Blue 3d arrow pointing down representing negative trend. Blue three dimensional arrow pointing down on a white background
Free with trial Black and white icon depicting a global wheat crisis with a downward arrow symbolizing decreasing food supply. Isolated decrease illustrations Global wheat crisis icon showing decreasing food supply. Black and white icon depicting a global wheat crisis with a downward arrow symbolizing decreasing food supply
Free with trial A vibrant, glossy red 3D percentage symbol stands prominently on a clean white background, casting a subtle shadow. This eye-catching graphic is perfect for conveying concepts of discounts, sales, interest rates, financial growth, or statistical data. Its bold, modern design makes it ideal for marketing campaigns, business presentations, retail promotions, economic reports, or any project requiring a clear and impactful representation of percentages, savings, or performance metrics. Isolated decrease illustrations Red 3D Percentage Symbol on White Background. A vibrant, glossy red 3D percentage symbol stands prominently on a clean white background, casting a subtle shadow. This eye-catching graphic is perfect for conveying concepts of discounts, sales, interest rates, financial growth, or statistical data. Its bold, modern design makes it ideal for marketing campaigns, business presentations, retail promotions, economic reports, or any project requiring a clear and impactful representation of percentages, savings, or performance metrics.
Free with trial A bright blue, glossy, three-dimensional arrow curves downwards, pointing towards the bottom right of the frame. The arrow has a smooth, reflective surface and is presented against a stark white background, casting a subtle shadow. The image focuses on the directional and dynamic nature of the arrow. Isolated decrease illustrations Bright Blue Glossy Arrow Pointing Downwards on White Background shiny. A bright blue, glossy, three-dimensional arrow curves downwards, pointing towards the bottom right of the frame. The arrow has a smooth, reflective surface and is presented against a stark white background, casting a subtle shadow. The image focuses on the directional and dynamic nature of the arrow
Free with trial Reduction chart icon Black line art vector in black and white outline set collection sign. Isolated decrease vectors Reduction chart icon Thin line flat illustration. Reduction chart icon Black line art vector in black and white outline set collection sign
Free with trial Dollar arrow up and down icon vector. USD growth and decline concept. Isolated decrease vectors Dollar arrow up and down icon. USD growth and decline concept
Free with trial Golden Ring with Minus Symbol and Subtle Glow. Isolated decrease vectors Golden Ring with Minus Symbol and Subtle Glow
Free with trial Mail cashback icon is representing the concept of refund payment. Isolated decrease vectors Mail cashback icon, refund payment envelope outline style. Mail cashback icon is representing the concept of refund payment
Free with trial Hourglass measuring fluctuating interest rates with arrows going up and down. Isolated decrease vectors Hourglass measuring fluctuating interest rates over time. Hourglass measuring fluctuating interest rates with arrows going up and down
Free with trial Yellow briefcase showing loss of capital with three red downward arrows and long shadow. Isolated decrease vectors Yellow briefcase losing money with three downward arrows. Yellow briefcase showing loss of capital with three red downward arrows and long shadow
Free with trial Statistics icon set, bar diagram illustration, business graph logo icon vector. Isolated decrease vectors Statistics icon set, bar diagram illustration, business graph logo icon vector
Free with trial Four red and blue arrows are pointing down, illustrating a negative trend. Isolated decrease vectors Red and blue arrows pointing down showing negative trend. Four red and blue arrows are pointing down, illustrating a negative trend
Free with trial A high-quality 3D rendering of a dark gray calculator with a large, red percentage symbol resting on the plus button. The image is clean, modern, and perfect for illustrating concepts related to finance, discounts, interest rates, sales, and percentage calculations. The isolated white background makes it easy to incorporate into various designs. Isolated decrease vectors 3D Render of Calculator with Percentage Sign. A high-quality 3D rendering of a dark gray calculator with a large, red percentage symbol resting on the plus button. The image is clean, modern, and perfect for illustrating concepts related to finance, discounts, interest rates, sales, and percentage calculations. The isolated white background makes it easy to incorporate into various designs.
Free with trial A minimalist line drawing of a bar chart, representing data, statistics and growth. Simple, bold and clean graphic icon. Isolated decrease vectors Simple Line Chart Bar Statistic Graphic Icon. A minimalist line drawing of a bar chart, representing data, statistics and growth. Simple, bold and clean graphic icon.
Free with trial Minus icon web design logo set collection in flat vector. Isolated decrease vectors Minus icon Outline vector for web ui. Minus icon web design logo set collection in flat vector
Free with trial Upward rightward, downward leftward, upward leftward, and downward rightward arrow icon vector on circle background. Isolated decrease vectors Upward rightward, downward leftward, upward leftward, and downward rightward arrow icon on circle background
Free with trial Upward rightward, downward leftward, upward leftward, and downward rightward arrow line icon vector on black circle. Isolated decrease vectors Upward rightward, downward leftward, upward leftward, and downward rightward arrow line icon on black circle
Free with trial Inequality icon vector line logo mark or symbol set collection outline style. Isolated decrease vectors Inequality icon black and white vector outline sign. Inequality icon vector line logo mark or symbol set collection outline style
Free with trial Carbon dioxide co2 reducing decreasing lowering emitting pollution icon. Isolated decrease illustrations Line style icon of carbon dioxide emissions being reduced. Carbon dioxide co2 reducing decreasing lowering emitting pollution icon
Free with trial Black outline icon of a stack of papers with a downward arrow, representing data loss or reduction. Isolated decrease illustrations Arrow pointing down at decreasing stack of documents icon. Black outline icon of a stack of papers with a downward arrow, representing data loss or reduction
Free with trial Dark gray arrow is pointing down, which can represent a negative trend. Isolated decrease illustrations Dark gray arrow pointing down representing negative trend. Dark gray arrow is pointing down, which can represent a negative trend
Free with trial Smartphone is showing a red graph going down which represents financial loss. Isolated decrease vectors Smartphone showing red graph going down depicting financial loss. Smartphone is showing a red graph going down which represents financial loss
Free with trial Black and white icon of a dollar coin with a downward arrow, representing decreasing market value. Isolated decrease illustrations Dollar currency coin decreasing value with downward arrow. Black and white icon of a dollar coin with a downward arrow, representing decreasing market value
Free with trial Co2 neutral icons set outline vector. Carbon zero emission. Climate eco. Isolated decrease illustrations Co2 neutral icons set outline vector. Carbon zero emission
Free with trial Red arrow graph going down illustrating the concept of economic recession. Isolated decrease vectors Red arrow graph going down and showing economic recession. Red arrow graph going down illustrating the concept of economic recession
Free with trial Red bar chart with a gray arrow pointing down representing financial loss. Isolated decrease vectors Red chart arrow pointing down representing financial loss. Red bar chart with a gray arrow pointing down representing financial loss
Free with trial Dollar arrow up and down icon on circle line. USD growth and decline concept vector. Isolated decrease vectors Dollar arrow up and down icon on circle line. USD growth and decline concept
Free with trial A bold, stylized arrow rendered in shades of blue with a smooth gradient, curving downwards and to the right. The arrow features a thick black outline, giving it a graphic and modern appearance. Its dynamic shape suggests movement, direction, or a downward trend. This versatile graphic is perfect for illustrating concepts like decline, progress, navigation, or data flow in presentations, websites, and marketing materials. Isolated decrease vectors Dynamic Blue Downward Arrow with Gradient Effect. A bold, stylized arrow rendered in shades of blue with a smooth gradient, curving downwards and to the right. The arrow features a thick black outline, giving it a graphic and modern appearance. Its dynamic shape suggests movement, direction, or a downward trend. This versatile graphic is perfect for illustrating concepts like decline, progress, navigation, or data flow in presentations, websites, and marketing materials.
Free with trial Co2 gas carbon dioxide icon logo sign vector outline in black and white color. Isolated decrease vectors Co2 gas carbon dioxide icon Flat fill set collection. co2 gas carbon dioxide icon logo sign vector outline in black and white color
Free with trial A clear and prominent red arrow indicating a downward and rightward direction. Its stark contrast against a clean white backdrop makes it suitable for various data visualization and directional communication needs. Isolated decrease illustrations Bold red arrow points downward and to the right with a white background. A clear and prominent red arrow indicating a downward and rightward direction. Its stark contrast against a clean white backdrop makes it suitable for various data visualization and directional communication needs
Free with trial Shrink database icon vector logo set collection or bundle pack group. Isolated decrease vectors Shrink database icon Isolated flat vector in outline. Shrink database icon vector logo set collection or bundle pack group
Free with trial Line chart going down on a website, showing a negative trend in statistics. Isolated decrease illustrations Website showing a graph representing decreasing statistics. Line chart going down on a website, showing a negative trend in statistics
Free with trial 100 cryptocurrency icons set. Color line set of cryptocurrency vector icons thin line color flat on white. Isolated decrease illustrations 100 cryptocurrency icons set, color line style. 100 cryptocurrency icons set. Color line set of cryptocurrency vector icons thin line color flat on white
Free with trial Black and white icon of a flip chart presenting a negative trend. Isolated decrease vectors Flip chart presenting negative trend on a white background. Black and white icon of a flip chart presenting a negative trend
Free with trial Isometric illustration of a marketing team analyzing a falling financial chart on a tablet. Isolated decrease illustrations Marketing team analyzing falling financial chart on tablet. Isometric illustration of a marketing team analyzing a falling financial chart on a tablet
Free with trial Minus Icon Black line art vector in black and white outline set collection sign. Isolated decrease vectors Minus Icon Thin line flat illustration. Minus Icon Black line art vector in black and white outline set collection sign
Free with trial Baby height chart with clouds measuring from zero to one hundred and fifty centimeters. Isolated decrease vectors Cartoon height chart measuring tool for kids with a cute sky theme. Baby height chart with clouds measuring from zero to one hundred and fifty centimeters
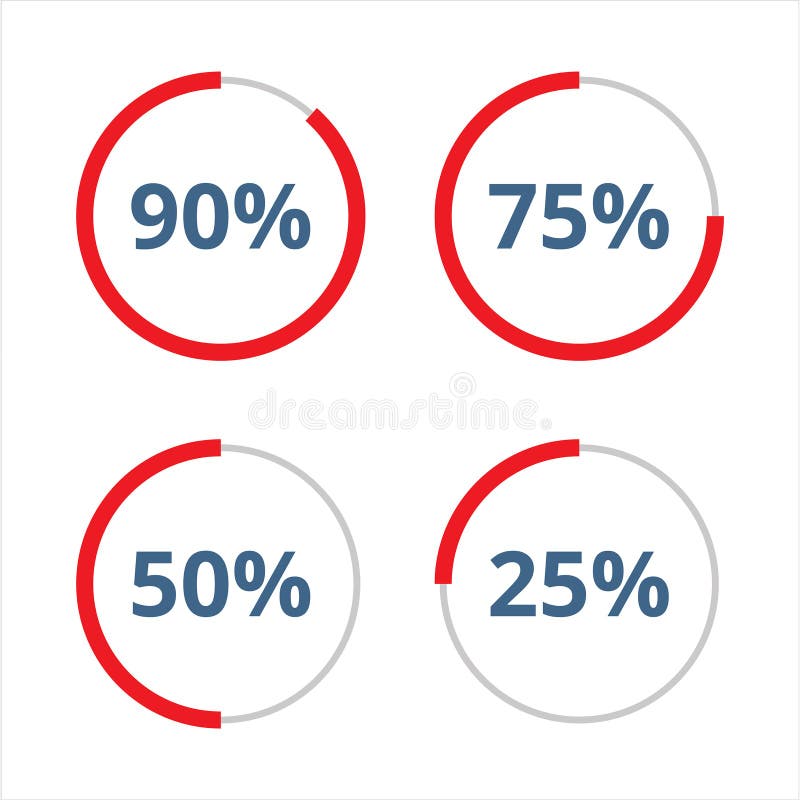
Free with trial Four round percentage signs in blue and red on a white background. Isolated decrease vectors Round percentage signs in blue and red on a white background
Free with trial Line icon concept of expensive travel ticket with three coins falling representing high cost of travel and tourism. Isolated decrease vectors Concept of expensive travel ticket with three coins falling
Free with trial Three blue arrows are pointing down, symbolizing a negative trend or decline. Isolated decrease vectors Three blue arrows pointing down representing negative trend. Three blue arrows are pointing down, symbolizing a negative trend or decline
Free with trial A colorful family of traditional Russian Matryoshka nesting dolls stands in a neat row, arranged by size from largest to smallest. Set against a vibrant green background, this image represents concepts of family, generations, growth, and the beauty of ordered progression. Isolated decrease illustrations Progression of Russian Matryoshka Nesting Dolls. A colorful family of traditional Russian Matryoshka nesting dolls stands in a neat row, arranged by size from largest to smallest. Set against a vibrant green background, this image represents concepts of family, generations, growth, and the beauty of ordered progression
Free with trial A vibrant collection of hand-drawn business charts and graphs, rendered in shades of blue with a sketch-like aesthetic. The set includes various types of visualizations like bar charts, line graphs, pie charts, and donut charts, representing data, growth, and analysis. This versatile illustration is perfect for presentations, reports, infographics, and any project requiring a visual representation of financial or statistical information with a creative, hand-crafted feel. Isolated decrease illustrations Hand-Drawn Business Charts and Graphs Collection. A vibrant collection of hand-drawn business charts and graphs, rendered in shades of blue with a sketch-like aesthetic. The set includes various types of visualizations like bar charts, line graphs, pie charts, and donut charts, representing data, growth, and analysis. This versatile illustration is perfect for presentations, reports, infographics, and any project requiring a visual representation of financial or statistical information with a creative, hand-crafted feel.
Free with trial Simple vector icon of a thermometer with the mercury level decreasing. Isolated decrease illustrations Thermometer showing decreasing temperature icon. Simple vector icon of a thermometer with the mercury level decreasing
Free with trial Stacked coins with a curved arrow pointing down representing money loss. Isolated decrease illustrations Money loss cash back refund finance arrow stacked coins icon. Stacked coins with a curved arrow pointing down representing money loss
Free with trial Simple graphic design showing interconnected circles, one with a plus sign and the other with a minus sign. Useful for website design, apps, and presentations. Isolated decrease vectors Plus and Minus Circle Icons: Add and Subtract Symbols. Simple graphic design showing interconnected circles, one with a plus sign and the other with a minus sign. Useful for website design, apps, and presentations.
Free with trial Round pocket watch with co2 formula inside representing carbon dioxide reducing with time passing. Isolated decrease vectors Pocket watch showing co2 emission reducing with time passing. Round pocket watch with co2 formula inside representing carbon dioxide reducing with time passing
Free with trial Interactive touchscreen is showing a graph declining, which can be used for business or financial presentations. Isolated decrease vectors Interactive touchscreen showing graph declining icon cartoon vector. Interactive touchscreen is showing a graph declining, which can be used for business or financial presentations
Free with trial Shopping basket icon with red arrow pointing down representing falling sales. Isolated decrease illustrations Red arrow pointing down on shopping basket icon. Shopping basket icon with red arrow pointing down representing falling sales
Free with trial A red down arrow on a transparent white background. Isolated decrease vectors A red down arrow on a transparent white background
Free with trial This vector illustration features a black silhouette of a cloud, symbolizing CO2 emissions and carbon dioxide pollution. The icon represents the environmental impact of greenhouse gases, highlighting issues related to ecology and climate change. The design is straightforward, making it an effective visual tool for discussing topics related to environmental conservation, pollution, and carbon footprint. Ideal for use in ecological projects, educational materials, or advocacy campaigns, this icon helps convey the significance of addressing CO2 emissions and promoting sustainability. Isolated decrease vectors CO2 emissions icon. Ecology and environment symbol. Sign vector carbon dioxide pollution. Black cloud silhouette. This vector illustration features a black silhouette of a cloud, symbolizing CO2 emissions and carbon dioxide pollution. The icon represents the environmental impact of greenhouse gases, highlighting issues related to ecology and climate change. The design is straightforward, making it an effective visual tool for discussing topics related to environmental conservation, pollution, and carbon footprint. Ideal for use in ecological projects, educational materials, or advocacy campaigns, this icon helps convey the significance of addressing CO2 emissions and promoting sustainability.
Free with trial Simple line chart is showing a critical error with an exclamation point symbol. Isolated decrease vectors Business chart showing critical error with exclamation point. Simple line chart is showing a critical error with an exclamation point symbol
Free with trial Subtract symbol icon in a black circle, minus button. Isolated decrease vectors Subtract symbol icon in a black circle, minus button
Free with trial A bright blue, three-dimensional percentage symbol rendered in glossy glass material. The symbol is floating and casting a subtle shadow on a clean white background. Its transparent quality allows light to pass through, highlighting its smooth, rounded edges and the sharp diagonal line. Isolated decrease illustrations 3D Blue Glass Percentage Symbol Floating on White Background sign discount. A bright blue, three-dimensional percentage symbol rendered in glossy glass material. The symbol is floating and casting a subtle shadow on a clean white background. Its transparent quality allows light to pass through, highlighting its smooth, rounded edges and the sharp diagonal line
Free with trial Zoom out Flat set in black and white color outline vector mark. Isolated decrease vectors Zoom out Flat set in black and white color
Free with trial Cost reduction icon linear logo mark set collection in black and white for web. Isolated decrease vectors Cost reduction icon linear logo mark in black and white. Cost reduction icon linear logo mark set collection in black and white for web
Free with trial A collection of financial chart icons, showcasing data analysis and business growth concepts. The image features multiple variations of a line graph and bar chart combination, presented in both grayscale and beige color schemes. These icons are ideal for illustrating financial reports, business presentations, market trends, and data visualization projects. The clean, modern design makes them suitable for a wide range of applications. Isolated decrease vectors Financial Chart Icons: Business and Data Analysis. A collection of financial chart icons, showcasing data analysis and business growth concepts. The image features multiple variations of a line graph and bar chart combination, presented in both grayscale and beige color schemes. These icons are ideal for illustrating financial reports, business presentations, market trends, and data visualization projects. The clean, modern design makes them suitable for a wide range of applications.
Free with trial Cost reduction icon vector line logo mark or symbol set collection outline style. Isolated decrease vectors Cost reduction icon black and white vector outline sign. Cost reduction icon vector line logo mark or symbol set collection outline style
Free with trial Colorful graph chart is showing and comparing different data results with lines and dots. Isolated decrease vectors Colorful graph chart showing different data comparing results. Colorful graph chart is showing and comparing different data results with lines and dots
Free with trial Purple gradient bar graph is showing a negative trend with a downward arrow. Isolated decrease vectors Purple gradient bar graph showing negative trend with downward arrow
Free with trial Thick arrow is pointing down next to a dollar coin, representing devaluation or inflation. Isolated decrease vectors Dollar coin with arrow pointing down representing devaluation. Thick arrow is pointing down next to a dollar coin, representing devaluation or inflation
Free with trial 3d illustration of four blue arrows pointing down representing a negative trend. Isolated decrease illustrations Blue arrows pointing down showing negative trend. 3d illustration of four blue arrows pointing down representing a negative trend
Free with trial Loss icon vector image. Suitable for mobile application web application and print media. Isolated decrease vectors Loss icon vector image.