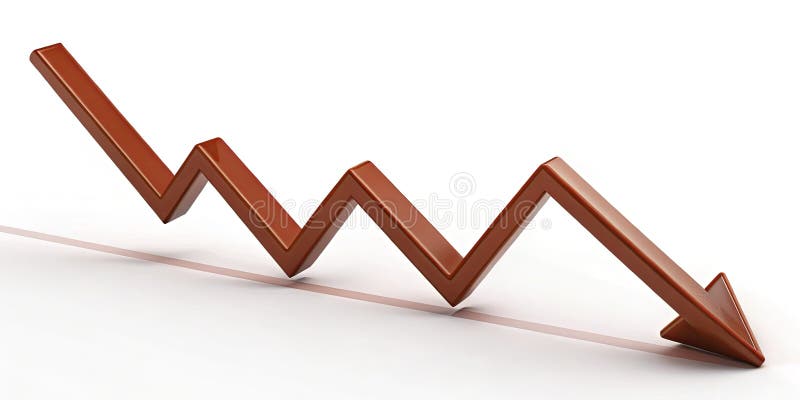
Free with trial This compelling red zigzag line graph vividly illustrates a downward market trend, offering a concise yet insightful representation of declining stock prices. The dynamic zigzag pattern clearly highlights fluctuations and sharp drops in the data, making it an ideal tool for visualizing market analysis and economic indicators. The falling red line graph effectively communicates the negative. Isolated decrease illustrations Analyzing a Declining Market Trend Visualizing Falling Stock Prices with a Red Zigzag Line Graph. This compelling red zigzag line graph vividly illustrates a downward market trend, offering a concise yet insightful representation of declining stock prices. The dynamic zigzag pattern clearly highlights fluctuations and sharp drops in the data, making it an ideal tool for visualizing market analysis and economic indicators. The falling red line graph effectively communicates the negative
Free with trial Bankruptcy of business woman falling apart into banknotes is caused by high credit obligations. Upset woman became victim of bankruptcy due to financial crisis and decrease in personal income. Isolated decrease vectors Bankruptcy of business woman falling apart into banknotes is caused by high credit obligations
Free with trial 3d White Euro And Yen Symbol On Rounded Blue Icons With 3d Balance Weight Seesaw, 3d illustration. Isolated decrease illustrations 3d White Euro And Yen Symbol On Rounded Blue Icons With 3d Balance Weight Seesaw, 3d illustration
Free with trial A red bar chart illustrating a downward trend, with bars decreasing in height and a red arrow pointing downwards, signifying decline and loss. Isolated decrease illustrations Bar chart with downward trending arrow isolated on white background. A red bar chart illustrating a downward trend, with bars decreasing in height and a red arrow pointing downwards, signifying decline and loss
Free with trial A sharp red arrow, indicating a downward trend, is superimposed over a thick stack of green dollar bills. The dollar bills are depicted with a subtle texture and the dollar sign. The image is set against a clean white background, emphasizing the concept of financial decline or loss. Isolated decrease illustrations Red Downward Arrow Graph Over a Stack of Green Dollar Bills on White Background money finance. A sharp red arrow, indicating a downward trend, is superimposed over a thick stack of green dollar bills. The dollar bills are depicted with a subtle texture and the dollar sign. The image is set against a clean white background, emphasizing the concept of financial decline or loss
Free with trial A 3D rendering of a simple bar graph featuring two green and one orange cylinder. This image is perfect for illustrating business concepts, data representation, or as an infographic element. The clean design makes it versatile for various applications. This image was generated with the assistance of artificial intelligence. Isolated decrease illustrations 3D Bar Graph, Green and Orange Cylinders, Business Chart, Data Visualization, Infographic Element. A 3D rendering of a simple bar graph featuring two green and one orange cylinder. This image is perfect for illustrating business concepts, data representation, or as an infographic element. The clean design makes it versatile for various applications.This image was generated with the assistance of artificial intelligence.
Free with trial The image shows a candlestick stock chart on a black background, depicting price movements with green and red candlesticks. Suitable for finance and business concepts. Generative AI. Isolated decrease illustrations Stock market candlestick chart isolated on black background for financial and business concepts. The image shows a candlestick stock chart on a black background, depicting price movements with green and red candlesticks. Suitable for finance and business concepts. Generative AI
Free with trial Reduction chart icon vector logo set collection for web app ui. Isolated decrease vectors Reduction chart icon set depicting data reduction symbols, ideal for business analytics and performance visuals. Reduction chart icon vector logo set collection for web app ui
Free with trial Discount tag displays a percentage symbol with arrows pointing up and down indicating fluctuating prices representing sales promotions and marketing offers for retail businesses. Isolated decrease illustrations Blue discount tag with percentage sign and arrows indicating price changes on white background. Discount tag displays a percentage symbol with arrows pointing up. Discount tag displays a percentage symbol with arrows pointing up and down indicating fluctuating prices representing sales promotions and marketing offers for retail businesses
Free with trial 3d Golden Dollar And Won Symbol Icons With 3d Black Balance Weight Seesaw, 3d illustration. Isolated decrease illustrations 3d Golden Dollar And Won Symbol Icons With 3d Black Balance Weight Seesaw, 3d illustration
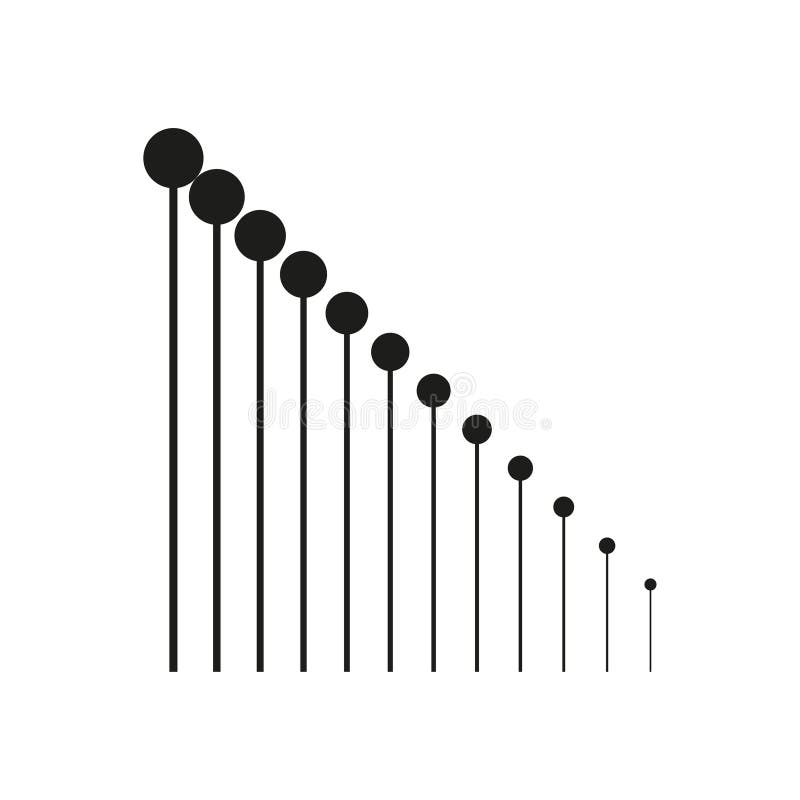
Free with trial Decreasing line graphic. Circle point Vector. Minimalist growth chart. Data progression illustration. EPS 10. Isolated decrease vectors Decreasing line graphic. Circle point Vector. Minimalist growth chart. Data progression illustration.
Free with trial Bar graph with circles and lines darker flat icons on color round background. Isolated decrease vectors Bar graph with circles and lines color darker flat icons. Bar graph with circles and lines darker flat icons on color round background
Free with trial Red cube with arrow up. Business and market growth concept. Close-up. Isolated decrease illustrations Red cube with arrow up. Business and market growth concept
Free with trial Red cube with arrow up. Business and market growth concept. Close-up. Isolated decrease illustrations Red cube with arrow up. Business and market growth concept
Free with trial Red cube with arrow up. Business and market growth concept. Close-up. Isolated decrease illustrations Red cube with arrow up. Business and market growth concept
Free with trial Red cube with arrow up. Business and market growth concept. Close-up. Isolated decrease illustrations Red cube with arrow up. Business and market growth concept
Free with trial Red cube with arrow up. Business and market growth concept. Close-up. Isolated decrease illustrations Red cube with arrow up. Business and market growth concept
Free with trial Red cube with arrow up. Business and market growth concept. Close-up. Isolated decrease illustrations Red cube with arrow up. Business and market growth concept
Free with trial Red cube with arrow up. Business and market growth concept. Close-up. Isolated decrease illustrations Red cube with arrow up. Business and market growth concept
Free with trial Red cube with arrow up. Business and market growth concept. Close-up. Isolated decrease illustrations Red cube with arrow up. Business and market growth concept
Free with trial Set line Old hourglass with sand, Arrow, Location, Layers, Clock, Intersection point and icon. Vector. Isolated decrease illustrations Set line Old hourglass with sand, Arrow, Location, Layers, Clock, Intersection point and icon. Vector
Free with trial 3d Golden Dollar And Euro Symbol Icons With 3d Black Balance Weight Seesaw, 3d illustration. Isolated decrease illustrations 3d Golden Dollar And Euro Symbol Icons With 3d Black Balance Weight Seesaw, 3d illustration
Free with trial Young women calculate rising monthly expenses and decreasing income. Financial Instability concept. trend modern vector flat illustration. Isolated decrease vectors Young women calculate rising monthly expenses and decreasing income. Financial Instability concept.
Free with trial A detailed financial chart showing business data analysis and market trend with upward arrow sign. Isolated decrease illustrations Financial chart business data analysis and market trend view isolated on transparent background. a detailed financial chart showing business data analysis and market trend with upward arrow sign
Free with trial A straightforward black and white vector design showcasing its simplicity with clear-cut lines and a captivating interplay of contrasting colors - Artificial intelligence crafted illustration. Isolated decrease vectors Fall - minimalist and simple silhouette - vector illustration. A straightforward black and white vector design showcasing its simplicity with clear-cut lines and a captivating interplay of contrasting colors - Artificial intelligence crafted illustration
Free with trial A basic black-and-white vector artwork exhibiting a clarity of form through its sharp lines and a striking blend of contrasting tones - Artificial intelligence crafted illustration. Isolated decrease vectors Fall - minimalist and simple silhouette - vector illustration. A basic black-and-white vector artwork exhibiting a clarity of form through its sharp lines and a striking blend of contrasting tones - Artificial intelligence crafted illustration
Free with trial A simple black and white vector illustration showcasing clean lines and contrasting shades - Artificial intelligence crafted illustration. Isolated decrease vectors Fall - minimalist and simple silhouette - vector illustration. A simple black and white vector illustration showcasing clean lines and contrasting shades - Artificial intelligence crafted illustration
Free with trial Declining bar chart with downward arrow graphic representing economic downturn and financial loss. Isolated decrease vectors Declining bar chart with downward arrow graphic representing economic downturn and financial loss
Free with trial Hand holding ripped money bag and losing money bundle with coins spilling out for bankruptcy, financial crisis and recession concept illustration clip art. Isolated decrease vectors Hand Holding Ripped Money Bag and Losing Money Bundle with Coins for Bankruptcy, Financial Crisis Concept Illustration. Hand holding ripped money bag and losing money bundle with coins spilling out for bankruptcy, financial crisis and recession concept illustration clip art
Free with trial Export-import entrepreneurs check the demand for goods to be sent. Demand for goods decreases. Cost Reduction concept. trend modern vector flat illustration. Isolated decrease vectors Export-import entrepreneurs check the demand for goods to be sent. Demand for goods decreases. Cost Reduction concept.
Free with trial Sad businessman with graphs. Young guy evaluates statistics and infographics. Economic depression and recession. Entrepreneur with bankruptcy. Cartoon vector illustration isolated on white background. Isolated decrease vectors Sad businessman with graphs. Young guy evaluates statistics and infographics. Economic depression and recession
Free with trial Three-dimensional rectangular bars stand side-by-side on a white background. The bars are of different heights, with the shortest on the left, a medium-height bar in the middle, and the tallest bar on the right. The bars are colored blue, pink, and orange, respectively. This arrangement visually represents a bar chart or graph, suggesting concepts of growth, data comparison, or progress. Isolated decrease illustrations Three 3D Rendered Rectangular Bars of Varying Heights and Colors on a White Background bar chart. Three-dimensional rectangular bars stand side-by-side on a white background. The bars are of different heights, with the shortest on the left, a medium-height bar in the middle, and the tallest bar on the right. The bars are colored blue, pink, and orange, respectively. This arrangement visually represents a bar chart or graph, suggesting concepts of growth, data comparison, or progress
Free with trial Three black, rounded, vertical bars of progressively increasing height are displayed against a clean white background. The bars are smooth and have a matte finish. This visual representation suggests concepts of growth, progress, data analysis, or a simple bar graph. Isolated decrease illustrations Three black rounded bars of increasing height on a white background bar chart graph. Three black, rounded, vertical bars of progressively increasing height are displayed against a clean white background. The bars are smooth and have a matte finish. This visual representation suggests concepts of growth, progress, data analysis, or a simple bar graph
Free with trial Green cube with arrow up. Business and market growth concept. Close-up. Isolated decrease illustrations Green cube with arrow up. Business and market growth concept
Free with trial Green cube with arrow up. Business and market growth concept. Close-up. Isolated decrease illustrations Green cube with arrow up. Business and market growth concept
Free with trial Green cube with arrow up. Business and market growth concept. Close-up. Isolated decrease illustrations Green cube with arrow up. Business and market growth concept
Free with trial Green cube with arrow up. Business and market growth concept. Close-up. Isolated decrease illustrations Green cube with arrow up. Business and market growth concept
Free with trial Set Server, Data, Web Hosting, security with key, Cloud computing lock and Cost reduction icon. Vector. Isolated decrease illustrations Set Server, Data, Web Hosting, security with key, Cloud computing lock and Cost reduction icon. Vector
Free with trial Businessman hand turn cost dial to low position. Cost reduction management concept. flat vector modern illustration. Isolated decrease vectors Businessman hand turn cost dial to low position. Cost reduction management concept.
Free with trial Stylized house roof and chimney with a large downward arrow indicating reduced home value or costs. Isolated decrease vectors Stylized house roof and chimney with a large downward arrow indicating reduced home value or costs
Free with trial 3d Blue Euro And Yen Symbol Icons With 3d Blue Balance Weight Seesaw, 3d illustration. Isolated decrease illustrations 3d Blue Euro And Yen Symbol Icons With 3d Blue Balance Weight Seesaw, 3d illustration
Free with trial 3d White Lira And Indian Rupee Symbol On Rounded Blue Icons With 3d Balance Weight Seesaw, 3d illustration. Isolated decrease illustrations 3d White Lira And Indian Rupee Symbol On Rounded Blue Icons With 3d Balance Weight Seesaw, 3d illustration
Free with trial 3d Blue Baht And Yen Symbol Icons With 3d Blue Balance Weight Seesaw, 3d illustration. Isolated decrease illustrations 3d Blue Baht And Yen Symbol Icons With 3d Blue Balance Weight Seesaw, 3d illustration
Free with trial A Vector Set of Black Curved Arrow Icons with Different Directions is a collection of graphic elements designed to represent movement and direction in a visually engaging way. Isolated decrease vectors Vector Set Of Black Curved Arrow Icons With Different Direction
Free with trial A Vector Set of Black Curved Arrow Icons with Different Directions is a collection of graphic elements designed to represent movement and direction in a visually engaging way. Isolated decrease vectors Vector Set Of Black Curved Arrow Icons With Different Direction
Free with trial A Vector Set of Black Curved Arrow Icons with Different Directions is a collection of graphic elements designed to represent movement and direction in a visually engaging way. Isolated decrease vectors Vector Set Of Black Curved Arrow Icons With Different Direction
Free with trial A visual representation of a declining financial trend. Stacks of coins diminish in height, mirroring a downward-sloping red arrow. A man stands atop the highest stack, symbolizing concern over financial downturn. Isolated decrease illustrations Decreasing graph with coins and a man isolated on white background. for finance and business use cases. A visual representation of a declining financial trend. Stacks of coins diminish in height, mirroring a downward-sloping red arrow. A man stands atop the highest stack, symbolizing concern over financial downturn
Free with trial A vivid red arrow plunges diagonally downwards against a white grid. This image symbolizes economic downturn, financial loss, or a negative trend. It's ideal for illustrating market decline or recession. Isolated decrease illustrations Red arrow pointing down isolated on white background, for financial and economic decline use cases. A vivid red arrow plunges diagonally downwards against a white grid. This image symbolizes economic downturn, financial loss, or a negative trend. It's ideal for illustrating market decline or recession
Free with trial Hand drawn doodle minus sign icon within a circle. Sketchy graphic symbol for subtraction or removal. Isolated decrease vectors Hand drawn doodle minus sign icon within a circle. Sketchy graphic symbol for subtraction or removal
Free with trial 3D red percentage symbol with 0 and O pointing down on white For Social Media Post Size. Isolated decrease illustrations 3D red percentage symbol with 0 and O pointing down on white
Free with trial 3D red percentage symbol with 0 and O pointing down on white For Social Media Post Size. Isolated decrease illustrations 3D red percentage symbol with 0 and O pointing down on white
Free with trial 3D red percentage symbol with 0 and O pointing down on white For Social Media Post Size. Isolated decrease illustrations 3D red percentage symbol with 0 and O pointing down on white
Free with trial Set line Global economic crisis, and Calculation of expenses on seamless pattern. Vector. Isolated decrease illustrations Set line Global economic crisis, and Calculation of expenses on seamless pattern. Vector
Free with trial 3d Golden Indian Rupee And Lira Symbol On Rounded Black Icons With 3d Balance Weight Seesaw 3d illustration. Isolated decrease illustrations 3d Golden Indian Rupee And Lira Symbol On Rounded Black Icons With 3d Balance Weight Seesaw 3d illustration
Free with trial A mesmerizing spiral of glowing, transparent bubbles set against a stark black background. The bubbles decrease in size toward the center, creating a dynamic sense of depth and intricate pattern. Each bubble has a bluish tint and appears illuminated, enhancing their contrast with the dark backdrop. The formation radiates from the center outward, contributing to an optical illusion effect and drawing the eye along the spiral pathway, emphasizing harmony and movement. Isolated decrease illustrations Abstract spiral of glowing bubbles against a stark black background, creating a sense of depth and pattern. A mesmerizing spiral of glowing, transparent bubbles set against a stark black background. The bubbles decrease in size toward the center, creating a dynamic sense of depth and intricate pattern. Each bubble has a bluish tint and appears illuminated, enhancing their contrast with the dark backdrop. The formation radiates from the center outward, contributing to an optical illusion effect and drawing the eye along the spiral pathway, emphasizing harmony and movement.
Free with trial A vivid image displays a bold red arrow sharply descending against a graph. This symbolizes financial downturn, economic recession, or business decline. The arrow's downward trajectory conveys loss and crisis. Isolated decrease illustrations Red arrow pointing down isolated on white background, use cases: finance, economy, business, stock market. A vivid image displays a bold red arrow sharply descending against a graph. This symbolizes financial downturn, economic recession, or business decline. The arrow's downward trajectory conveys loss and crisis
Free with trial Set Isometric line Global economic crisis, Mobile stock trading, and Briefcase icon. Vector. Isolated decrease illustrations Set Isometric line Global economic crisis, Mobile stock trading, and Briefcase icon. Vector
Free with trial 3d Golden Euro And Indian Rupee Symbol Icons With 3d Black Balance Weight Seesaw, 3d illustration. Isolated decrease illustrations 3d Golden Euro And Indian Rupee Symbol Icons With 3d Black Balance Weight Seesaw, 3d illustration
Free with trial 3d Golden Indian Rupee And Lira Symbol Icons With 3d Black Balance Weight Seesaw, 3d illustration. Isolated decrease illustrations 3d Golden Indian Rupee And Lira Symbol Icons With 3d Black Balance Weight Seesaw, 3d illustration
Free with trial Set line Casino win, Slot machine, chips, Online sports betting, with dollar, and Hand holding casino icon. Vector. Isolated decrease vectors Set line Casino win, Slot machine, chips, Online sports betting, with dollar, and Hand holding casino icon. Vector
Free with trial Inequality icon web design logo set collection in flat vector. Isolated decrease vectors Social Inequality Icon for Diversity and Social Justice Graphics Ideal for Representing Social Inequality and Equality Campaigns. Inequality icon web design logo set collection in flat vector
Free with trial A flat vector illustration depicting a business or financial crisis. A worried man and a concerned woman stand beside a large bar chart. A bold red arrow trends downwards across the graph, symbolizing a market crash, loss, failure, or recession. The modern composition is isolated on a white background with decorative plant elements. This image was created with AI. Isolated decrease vectors Conceptual illustration of a financial crisis with concerned people looking at a falling red arrow chart. A flat vector illustration depicting a business or financial crisis. A worried man and a concerned woman stand beside a large bar chart. A bold red arrow trends downwards across the graph, symbolizing a market crash, loss, failure, or recession. The modern composition is isolated on a white background with decorative plant elements. This image was created with AI.
Free with trial Hand drawn cartoon style red 3D arrow pointing down. Vector illustration of a directional symbol or icon. Isolated decrease vectors Hand drawn cartoon style red 3D arrow pointing down. Vector illustration of a directional symbol or icon
Free with trial Woman with bankruptcy. Young girl falls next to downward arrow and banknotes. Financial crisis and recession. Problems in business. Linear flat vector illustration isolated on white background. Isolated decrease vectors Woman with bankruptcy. Young girl falls next to downward arrow and banknotes. Financial crisis and recession. Problems
Free with trial Fall of the economy, reduction of capital. Bankruptcy and stock decline. Recession sign on economic background. Economic Recession concept. set modern vector flat illustration. Isolated decrease vectors Fall of the economy, reduction of capital. Bankruptcy and stock decline. Recession sign on economic background. Economic Recession
Free with trial Businessman analyzes the stock exchange market, which is declining because the prices of goods are increasing. Desperate to lose money due to crisis, recession, inflation. Inflation concept. trend modern vector flat illustration. Isolated decrease vectors Businessman analyzes the stock exchange market, which is declining because the prices of goods are increasing.
Free with trial Set line Bank building, Global economic crisis, Pie chart infographic and Shutdown of factory icon. Vector. Isolated decrease vectors Set line Bank building, Global economic crisis, Pie chart infographic and Shutdown of factory icon. Vector
Free with trial 3d White Pound And Lira Symbol On Rounded Blue Icons With 3d Balance Weight Seesaw, 3d illustration. Isolated decrease illustrations 3d White Pound And Lira Symbol On Rounded Blue Icons With 3d Balance Weight Seesaw, 3d illustration
Free with trial 3d Golden Euro And Yen Symbol On Rounded Black Icons With 3d Balance Weight Seesaw 3d illustration. Isolated decrease illustrations 3d Golden Euro And Yen Symbol On Rounded Black Icons With 3d Balance Weight Seesaw 3d illustration
Free with trial Businessman holding ripped money bag and losing money bundle with coins for bankruptcy, financial crisis concept illustration clip art. Isolated decrease vectors Businessman Holding Ripped Money Bag and Losing Money Bundle with Coins for Bankruptcy, Financial Crisis Concept Illustration
Free with trial Set of audio-related icons on a white background, featuring symbols like volume controls, music notes, headphones, audio settings, bell, USB connector, microphone, and playback buttons. Icons include simple line art with different configurations indicating various audio functions, such as volume increase and decrease, mute, sound levels, and play pause functions. These icons are commonly used in audio applications and interfaces for intuitive control and navigation. Isolated decrease vectors Set of Music and Sound Line Icons Including Volume, Notes, Headphones, Microphone, and Playback Controls Isolated. Set of audio-related icons on a white background, featuring symbols like volume controls, music notes, headphones, audio settings, bell, USB connector, microphone, and playback buttons. Icons include simple line art with different configurations indicating various audio functions, such as volume increase and decrease, mute, sound levels, and play pause functions. These icons are commonly used in audio applications and interfaces for intuitive control and navigation.
Free with trial Set line Server, Data, Web Hosting, Cost reduction, Location with sales funnel and security lock icon. Vector. Isolated decrease vectors Set line Server, Data, Web Hosting, Cost reduction, Location with sales funnel and security lock icon. Vector
Free with trial Three light-blue cylindrical shapes, vertically arranged, forming a bar graph, against a pale teal background. Isolated decrease illustrations Three light-blue cylindrical shapes, vertically arranged, forming a bar graph, against a pale teal background
Free with trial Bold, hand-drawn arrow pointing down and right, conveying a sense of direction, decline, or a negative trend. This versatile graphic is perfect for presentations, infographics, or charts needing a simple, impactful visual cue. Isolated decrease illustrations Drawn arrow pointing down and to the right, symbolizing direction or decline in a simple, bold graphic style. Bold, hand-drawn arrow pointing down and right, conveying a sense of direction, decline, or a negative trend. This versatile graphic is perfect for presentations, infographics, or charts needing a simple, impactful visual cue.
Free with trial 3d Golden Baht And Dollar Symbol On Rounded Black Icon With 3d Balance Weight Seesaw 3d illustration. Isolated decrease illustrations 3d Golden Baht And Dollar Symbol On Rounded Black Icon With 3d Balance Weight Seesaw 3d illustration
Free with trial 3d Golden Pound And Lira Symbol On Rounded Black Icons With 3d Balance Weight Seesaw 3d illustration. Isolated decrease illustrations 3d Golden Pound And Lira Symbol On Rounded Black Icons With 3d Balance Weight Seesaw 3d illustration
Free with trial Young businessman analyzing a descending financial candlestick chart on a computer screen. Financial Instability concept. trend modern vector flat illustration. Isolated decrease vectors Young businessman analyzing a descending financial candlestick chart on a computer screen. Financial Instability concept.
Free with trial Bitcoin coins with red arrow down and with green growth arrow. Falling and growing price of cryptocurrency, concept. 3D rendering isolated on white background. Isolated decrease illustrations Bitcoin coins with red arrow down and with green growth arrow. Falling and growing price of cryptocurrency, concept. 3D rendering
Free with trial This image features a glossy yellow arrow with a smooth, curved shape pointing downwards, symbolizing a decrease or negative trend in a visually striking manner. Isolated decrease illustrations A glossy yellow arrow curves downwards, indicating a downward trend or direction isolated on white background. This image features a glossy yellow arrow with a smooth, curved shape pointing downwards, symbolizing a decrease or negative trend in a visually striking manner
Free with trial A curious dog with perked ears and a wagging tail looks bewildered but joyful, capturing the essence of canine wonder. Isolated decrease illustrations A cheerful pup, its ears raised and tail wagging, conveys a sense of positive curiosity with its puzzled expression. A curious dog with perked ears and a wagging tail looks bewildered but joyful, capturing the essence of canine wonder