Free with trial Philippine business economy growth country with map and finance condition - vector illustration. Isometric financial growth decrease illustrations Philippine business economy growth country with map and finance condition - vector illustration
Free with trial Flat 3d isometric design of processing concept. Isometric financial growth decrease vectors Processing concept
Free with trial Malaysia business economy growth country with map and finance condition - vector illustration. Isometric financial growth decrease illustrations Malaysia business economy growth country with map and finance condition - vector illustration
Free with trial Morocco isometric financial economy condition concept for describe country growth expand - vector illustration. Isometric financial growth decrease illustrations Morocco isometric financial economy condition concept for describe country growth expand - vector
Free with trial Lima peru city isometric financial economy condition concept for describe cities growth expand - vector illustration. Isometric financial growth decrease illustrations Lima peru city isometric financial economy condition concept for describe cities growth expand - vector
Free with trial Dhaka bangladesh city isometric financial economy condition concept for describe cities growth expand - vector illustration. Isometric financial growth decrease illustrations Dhaka bangladesh city isometric financial economy condition concept for describe cities growth expand - vector
Free with trial Sierra leone isometric financial economy condition concept for describe country growth expand - vector illustration. Isometric financial growth decrease illustrations Sierra leone isometric financial economy condition concept for describe country growth expand - vector
Free with trial Landing page template of financial crisis. Modern flat design concept of web page design for website and mobile website. Easy to edit and customize, illustration, technology, people, vector, business, internet, infographic, icon, isometric, 3d, banner, finance, economy, crash, stock, loss, money, investment, depression, bankruptcy, failure, background, chart, currency, down, dollar, global, risk, decrease, stress, problem, businessman, banking, profit, bad, growth. Isometric financial growth decrease vectors Landing page template of financial crisis. Modern flat design concept of web page design for website and mobile website. Easy to
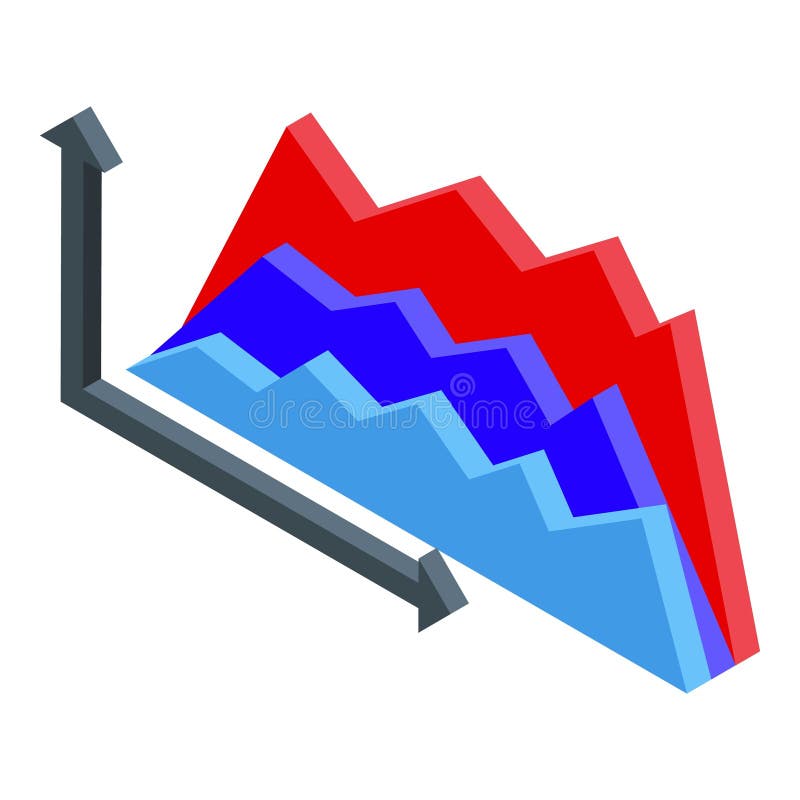
Free with trial Isometric Business on falling down the chart. Fail, Risk, Problem. Decline red arrow with businessman isolated on white background. Isometric financial growth decrease vectors Isometric Business on falling down the chart. Fail, Risk, Problem. Decline red arrow with businessman isolated on white
Free with trial Price low down icon concept. Interest low price 3d percent discount vector icon reduction arrow decrease. Isometric financial growth decrease vectors Price low down icon concept. Interest low price 3d percent discount vector icon reduction arrow decrease
Free with trial Flat 3d isometric falling red arrow piercing through oil barrel over businessman. Oil price crisis concept. Isometric financial growth decrease vectors Isometric falling red arrow piercing through oil barrel over businessman
Free with trial Searching low interest rate flat isometric vector. Business men using magnifying glass are searching capable locations in the Earth map for with lowest rates. Isometric financial growth decrease vectors Searching low interest rate flat isometric vector.
Free with trial India business economy growth country with map and finance condition - vector illustration. Isometric financial growth decrease illustrations India business economy growth country with map and finance condition - vector illustration
Free with trial Vietnam business economy growth country with map and finance condition - vector illustration. Isometric financial growth decrease illustrations Vietnam business economy growth country with map and finance condition - vector illustration
Free with trial Indonesia business economy growth country with map and finance condition - vector illustration. Isometric financial growth decrease illustrations Indonesia business economy growth country with map and finance condition - vector illustration
Free with trial Africa continent business economy growth country with map and finance condition - vector illustration. Isometric financial growth decrease illustrations Africa continent business economy growth country with map and finance condition - vector illustration
Free with trial Margin Trading, Risks and Profits Concept. Brokers Analysing Global Fund and Finance, Traders Opening a Deal With Leverage, Trade Forex And Crypto Assets. Isometric Cartoon 3d Vector Illustration. Isometric financial growth decrease vectors Margin Trading, Risks and Profits Concept. Brokers Analysing Global Fund and Finance, Traders Opening a Deal With
Free with trial Percentage with arrow up and down. Banking, credit, interest rate. Vector stock illustration. Isometric financial growth decrease vectors Percentage with arrow up and down. Banking, credit, interest rate. Vector stock illustration.
Free with trial Low rates. Percent down. Cost rate. Vector stock illustration. Isometric financial growth decrease vectors Low rates. Percent down. Cost rate. Vector stock illustration.
Free with trial Low rates. Percent down. Cost rate. Vector stock illustration. Isometric financial growth decrease vectors Low rates. Percent down. Cost rate. Vector stock illustration.
Free with trial Set Isometric Financial growth decrease Data analysis and Pie chart infographic icon. Vector. Isometric financial growth decrease vectors Set Isometric Financial growth decrease, Data analysis and Pie chart infographic icon. Vector
Free with trial Isometric line Financial growth decrease icon isolated on pink and blue background. Increasing revenue. Square button. Vector. Isometric financial growth decrease vectors Isometric line Financial growth decrease icon isolated on pink and blue background. Increasing revenue. Square button
Free with trial Set Isometric Financial growth increase Football betting money decrease and Casino dealer icon. Purple hexagon button. Vector. Isometric financial growth decrease vectors Set Isometric Financial growth increase, Football betting money, decrease and Casino dealer icon. Purple hexagon button
Free with trial Isometric Financial growth decrease icon isolated on orange and red background. Increasing revenue. Circle button. Vector. Isometric financial growth decrease vectors Isometric Financial growth decrease icon isolated on orange and red background. Increasing revenue. Circle button
Free with trial Set Isometric Financial growth decrease and Cloud and shield icon. Vector. Isometric financial growth decrease illustrations Set Isometric Financial growth, decrease and Cloud and shield icon. Vector
Free with trial Set Isometric line Financial growth decrease, Coal mine trolley, and Data analysis icon. Vector. Isometric financial growth decrease vectors Set Isometric line Financial growth decrease, Coal mine trolley, and Data analysis icon. Vector
Free with trial Set Isometric Financial growth decrease Coal mine trolley and Data analysis icon. Vector. Isometric financial growth decrease vectors Set Isometric Financial growth decrease, Coal mine trolley and Data analysis icon. Vector
Free with trial Set Isometric line Financial growth decrease Stacks paper money cash and Online poker table game icon. Vector. Isometric financial growth decrease vectors Set Isometric line Financial growth decrease, Stacks paper money cash and Online poker table game icon. Vector
Free with trial Isometric line Financial growth decrease icon isolated on yellow background. Increasing revenue. Black circle button. Vector. Isometric financial growth decrease vectors Isometric line Financial growth decrease icon isolated on yellow background. Increasing revenue. Black circle button
Free with trial Isometric line Financial growth decrease icon isolated on pink and green background. Increasing revenue. Silver square button. Vector. Isometric financial growth decrease vectors Isometric line Financial growth decrease icon isolated on pink and green background. Increasing revenue. Silver square
Free with trial Isometric Financial growth decrease icon isolated on pink, yellow and blue background. Increasing revenue. Square button. Vector. Isometric financial growth decrease vectors Isometric Financial growth decrease icon isolated on pink, yellow and blue background. Increasing revenue. Square button
Free with trial Set Isometric Server security with padlock, Financial growth decrease, and icon. Vector. Isometric financial growth decrease illustrations Set Isometric Server security with padlock, Financial growth decrease, and icon. Vector
Free with trial Set Isometric line Money bag Online sports betting and Financial growth decrease icon. Vector. Isometric financial growth decrease vectors Set Isometric line Money bag, Online sports betting and Financial growth decrease icon. Vector
Free with trial Set Isometric line Horseshoe, Financial growth decrease, Lottery ticket and Online sports betting icon. Vector. Isometric financial growth decrease vectors Set Isometric line Horseshoe, Financial growth decrease, Lottery ticket and Online sports betting icon. Vector
Free with trial Set Isometric line Binary code, Financial growth decrease, Processor CPU and Pie chart infographic icon. Vector. Isometric financial growth decrease illustrations Set Isometric line Binary code, Financial growth decrease, Processor CPU and Pie chart infographic icon. Vector
Free with trial Set Isometric Horseshoe Lottery ticket Online poker table game and Financial growth decrease icon. Purple hexagon button. Vector. Isometric financial growth decrease vectors Set Isometric Horseshoe, Lottery ticket, Online poker table game and Financial growth decrease icon. Purple hexagon
Free with trial Set Isometric line Online sports betting Hand holding casino chips Financial growth decrease and Slot machine icon. Vector. Isometric financial growth decrease vectors Set Isometric line Online sports betting, Hand holding casino chips, Financial growth decrease and Slot machine icon
Free with trial Set Isometric line Financial growth decrease Online sports betting Playing card with clubs symbol and Dart arrow icon. Vector. Isometric financial growth decrease vectors Set Isometric line Financial growth decrease, Online sports betting, Playing card with clubs symbol and Dart arrow icon
Free with trial Set Search data analysis, Pie chart infographic, Calculator, Financial growth decrease, with folder, and icon. Vector. Isometric financial growth decrease vectors Set Search data analysis, Pie chart infographic, Calculator, Financial growth decrease, with folder, and icon. Vector
Free with trial Set Isometric line American football betting money Online sports Lucky player and Financial growth decrease icon. Vector. Isometric financial growth decrease vectors Set Isometric line American football betting money, Online sports, Lucky player and Financial growth decrease icon
Free with trial Set line Data analysis, Financial growth, Calculator, Folder and lock, decrease and icon. Vector. Isometric financial growth decrease illustrations Set line Data analysis, Financial growth, Calculator, Folder and lock, decrease and icon. Vector
Free with trial Set Financial growth decrease Cloud computing lock Pie chart infographic Server Sales funnel with and Data analysis icon. Vector. Isometric financial growth decrease illustrations Set Financial growth decrease, Cloud computing lock, Pie chart infographic, Server, Sales funnel with, and Data analysis
Free with trial A minimalist, high-detail 8K icon showing an isometric 3D view of a growing coin stack next to a simple money bag. Represents investment, financial growth and modern finance on a clean background. Isometric financial growth decrease illustrations Isometric Coin Stack and Money Bag Icon for Investment and Growth. 8K Render. A minimalist, high-detail 8K icon showing an isometric 3D view of a growing coin stack next to a simple money bag. Represents investment, financial growth and modern finance on a clean background
Free with trial Set line Data analysis Search data Financial growth decrease Server security with padlock Pie chart infographic and icon. Vector. Isometric financial growth decrease vectors Set line Data analysis, Search data, Financial growth decrease, Server security with padlock, Pie chart infographic, and
Free with trial Set line Treasure chest Gold bars Chalkboard with diagram Stacks paper money cash ATM and Financial growth decrease and Price tag dollar icon. Vector. Isometric financial growth decrease vectors Set line Treasure chest, Gold bars, Chalkboard with diagram, Stacks paper money cash, ATM and, Financial growth decrease. Set line Treasure chest Gold bars Chalkboard with diagram Stacks paper money cash ATM and Financial growth decrease and Price tag dollar icon. Vector.
Free with trial Isometric banner template showing inflation concept. Vector illustration of financial crisis, rising prices, and money value decrease. Data analysis report with charts and upward arrow for web design. Isometric financial growth decrease vectors Inflation And Economic Crisis Data Analysis Isometric Banner Template Vector Illustration. Isometric banner template showing inflation concept. Vector illustration of financial crisis, rising prices, and money value decrease. Data analysis report with charts and upward arrow for web design
Free with trial Hand drawn 3d isometric illustration showing a blue Indian rupee currency coin next to a yellow decreasing bar chart and a downward pointing arrow on an alpha transparent background, depicting financial decline and economic recession. Isometric financial growth decrease vectors 3D isometric doodle of Indian rupee coin with negative growth bar chart alpha transparent. Hand drawn 3d isometric illustration showing a blue Indian rupee currency coin next to a yellow decreasing bar chart and a downward pointing arrow on an alpha transparent background, depicting financial decline and economic recession.
Free with trial Have a look at this trendy isometric illustration of financial loss. Isometric financial growth decrease vectors Have a look at this trendy isometric illustration of financial loss
Free with trial A magnifying glass focuses on a vibrant bar graph, symbolizing financial growth and investment opportunities. Stacks of gold coins rest on a financial report, enhancing the visual representation of wealth and prosperity. This 3D rendering, generated by AI, is ideal for illustrating financial concep. Isometric financial growth decrease illustrations Financial Growth Analysis. A magnifying glass focuses on a vibrant bar graph, symbolizing financial growth and investment opportunities. Stacks of gold coins rest on a financial report, enhancing the visual representation of wealth and prosperity. This 3D rendering, generated by AI, is ideal for illustrating financial concep
Free with trial This is an isometric 3D illustration depicting a dynamic data visualization. It features a combination of bar charts and a line graph, showcasing rising trends and fluctuating data points. The color palette includes shades of blue, teal, and coral, creating a modern and professional aesthetic. This graphic is ideal for representing financial reports, business analytics, market trends, growth, and performance metrics in a visually engaging and easy-to-understand format. Isometric financial growth decrease illustrations Isometric 3D Bar and Line Graph with Data Visualization. This is an isometric 3D illustration depicting a dynamic data visualization. It features a combination of bar charts and a line graph, showcasing rising trends and fluctuating data points. The color palette includes shades of blue, teal, and coral, creating a modern and professional aesthetic. This graphic is ideal for representing financial reports, business analytics, market trends, growth, and performance metrics in a visually engaging and easy-to-understand format.
Free with trial 3d isometric illustration of a brown paper shopping bag with a downward red arrow, symbolizing negative sales growth. Isometric financial growth decrease vectors Isometric brown shopping bag with negative growth arrow. 3d isometric illustration of a brown paper shopping bag with a downward red arrow, symbolizing negative sales growth
Free with trial Coins decrease isometric isolated on transparent background. Isometric financial growth decrease illustrations Coins decrease isometric isolated on transparent background
Free with trial This 3D rendering showcases stacks of coins alongside a positive growth chart, generated by AI. It visually represents financial success and investment growth, ideal for illustrating financial concepts. Isometric financial growth decrease illustrations AI-Generated Financial Growth. This 3D rendering showcases stacks of coins alongside a positive growth chart, generated by AI. It visually represents financial success and investment growth, ideal for illustrating financial concepts.
Free with trial This 3D rendering showcases stacks of Bitcoin-like coins alongside a rising bar graph, illustrating cryptocurrency market growth. The image is generated by AI and ideal for illustrating financial concepts related to digital currencies. Isometric financial growth decrease illustrations Cryptocurrency Growth Chart. This 3D rendering showcases stacks of Bitcoin-like coins alongside a rising bar graph, illustrating cryptocurrency market growth. The image is generated by AI and ideal for illustrating financial concepts related to digital currencies.
Free with trial White isometric icons representing various financial concepts, including money, transactions, and data management, are depicted against a black background. These clean, modern icons are ideal for financial applications, websites, or presentations. Isometric financial growth decrease illustrations Isometric Finance Icons. White isometric icons representing various financial concepts, including money, transactions, and data management, are depicted against a black background. These clean, modern icons are ideal for financial applications, websites, or presentations.
Free with trial A modern, clean isometric illustration showcasing various data visualizations. Multiple charts and graphs, including bar charts, line graphs, and pie charts, are displayed on floating screens, representing data analysis, business intelligence, or financial reporting. Ideal for presentations, reports, or website banners related to data-driven concepts. Isometric financial growth decrease illustrations Isometric 3D Data Visualization: Charts and Graphs on Floating Screens. A modern, clean isometric illustration showcasing various data visualizations. Multiple charts and graphs, including bar charts, line graphs, and pie charts, are displayed on floating screens, representing data analysis, business intelligence, or financial reporting. Ideal for presentations, reports, or website banners related to data-driven concepts.
Free with trial A 3D isometric bar chart with a gradient color scheme from blue to red and orange, depicting a downward trend. The bars are arranged in descending order of height, set against a clean white background. This visual represents data analysis, financial decline, or a negative trend. Isometric financial growth decrease illustrations Isometric Gradient Bar Chart Showing Decline on White Background graph data. A 3D isometric bar chart with a gradient color scheme from blue to red and orange. A 3D isometric bar chart with a gradient color scheme from blue to red and orange, depicting a downward trend. The bars are arranged in descending order of height, set against a clean white background. This visual represents data analysis, financial decline, or a negative trend
Free with trial Abstract isometric view of multiple red arrows moving downward on a dark grid texture with selective focus. Business and finance concept illustrating a market crash, economic downturn, negative growth, and decreasing investment value. Isometric financial growth decrease illustrations Red down arrows on grid background representing financial decline and stock market crash. Abstract isometric view of multiple red arrows moving downward on a dark grid texture with selective focus. Business and finance concept illustrating a market crash, economic downturn, negative growth, and decreasing investment value.
Free with trial Isometric business analyst professional composition with conceptual financial analysis icons and people vector illustration. Isometric financial growth decrease vectors Business Growth Arrows Composition. Isometric business analyst professional composition with conceptual financial analysis icons and people vector illustration
Free with trial An isometric 3D bar chart composed of blue, gray, and orange blocks of varying heights is arranged on a white background. Isometric financial growth decrease illustrations Isometric 3D bar chart with blue, gray, and orange blocks on a white background graph data. An isometric 3D bar chart composed of blue, gray, and orange blocks of varying heights is arranged on a white background
Free with trial Isometric graph showing different trends with ups and downs, concept of trading and business analysis. Isometric financial growth decrease illustrations Isometric graph showing different trends with ups and downs
Free with trial Visualize complex market trends and strategy using this metallic, AI-generated bar chart illustration. Perfect for financial reports, planning presentations, and investor materials that require a sophisticated, high-impact visual representation of business growth, decline, and future success. Isometric financial growth decrease illustrations Conceptual 3D business bar chart illustrating market performance, showing initial decline followed by upward growth. Visualize complex market trends and strategy using this metallic, AI-generated bar chart illustration. Perfect for financial reports, planning presentations, and investor materials that require a sophisticated, high-impact visual representation of business growth, decline, and future success.
Free with trial Isometric illustration of a chart board displaying upward and downward trend lines. Isometric financial growth decrease vectors Isometric graph chart with trends on display. Isometric illustration of a chart board displaying upward and downward trend lines
Free with trial Three isometric 3D bar chart columns with a gradient color fill on a light background. Isometric financial growth decrease illustrations Three Isometric 3D Bar Chart Columns with Gradient Colors. Three isometric 3D bar chart columns with a gradient color fill on a light background
Free with trial Isometric business analyst professional composition with conceptual financial analysis icons and people vector illustration. Isometric financial growth decrease vectors Business Analyst Woman Composition. Isometric business analyst professional composition with conceptual financial analysis icons and people vector illustration
Free with trial This isometric illustration shows a delicious breakfast plate alongside a stock market graph, representing the connection between food trends and market data. The visual, generated by AI, is perfect for illustrating articles about food market analysis or investment opportunities in the food industr. Isometric financial growth decrease illustrations Breakfast Market Trends. This isometric illustration shows a delicious breakfast plate alongside a stock market graph, representing the connection between food trends and market data. The visual, generated by AI, is perfect for illustrating articles about food market analysis or investment opportunities in the food industr
Free with trial This 3D illustration features a series of vertical bars arranged in a descending sequence, representing a decline in data. A smooth, continuous line graph follows the top of the bars, emphasizing the negative trajectory. The color palette uses shades of blue and light gray against a clean white background, creating a professional and minimalist aesthetic suitable for financial or analytical. Isometric financial growth decrease vectors A three dimensional bar chart showing a downward trend with a line graph overlay. This 3D illustration features a series of vertical bars arranged in a descending sequence, representing a decline in data. A smooth, continuous line graph follows the top of the bars, emphasizing the negative trajectory. The color palette uses shades of blue and light gray against a clean white background, creating a professional and minimalist aesthetic suitable for financial or analytical
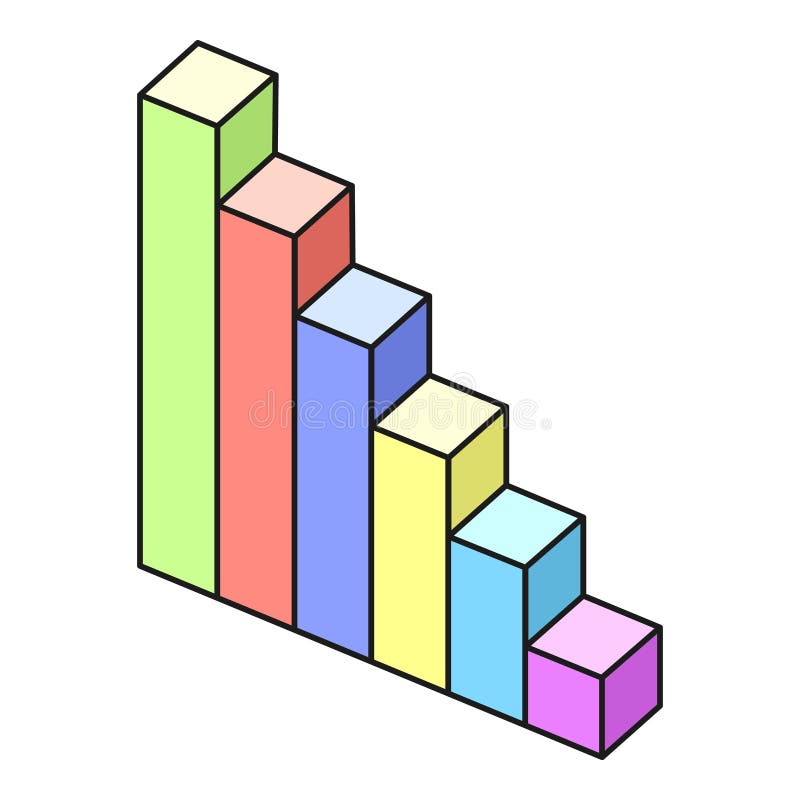
Free with trial A 3D rendered bar graph displays a series of six distinct bars, arranged in descending order of height from left to right. The bars are colored in a gradient from blue to orange, resting on a white, slightly angled platform. A subtle shadow is cast to the left, emphasizing the three-dimensional nature of the graphic. The visual represents a downward trend or decrease in data. Isometric financial growth decrease illustrations 3D rendered bar graph showing a downward trend with colorful bars on a white platform chart statistics. A 3D rendered bar graph displays a series of six distinct bars, arranged in descending order of height from left to right. The bars are colored in a gradient from blue to orange, resting on a white, slightly angled platform. A subtle shadow is cast to the left, emphasizing the three-dimensional nature of the graphic. The visual represents a downward trend or decrease in data
Free with trial Colorful bar graph showing decreasing trend, perfect for illustrating negative growth or decline. Isometric financial growth decrease illustrations Colorful bar graph showing decreasing trend over time. Colorful bar graph showing decreasing trend, perfect for illustrating negative growth or decline
Free with trial Isometric graph with dollar sign. The graph shows a downward trend. Vector. Isometric financial growth decrease vectors Isometric graphic icon with dollar. Isometric graph with dollar sign. The graph shows a downward trend. Vector
Free with trial An isometric illustration shows a computer screen displaying colorful data charts and graphs alongside related financial icons. Isometric financial growth decrease illustrations Colorful Data Analytics Displayed on Computer Screen. An isometric illustration shows a computer screen displaying colorful data charts and graphs alongside related financial icons
Free with trial This image showcases colorful 3D rendered charts and graphs displayed on a digital tablet, perfect for business presentations or reports illustrating growth and data analysis. The vibrant colors and clean design make it visually appealing and easy to understand. Isometric financial growth decrease illustrations Colorful 3D Charts and Graphs on Digital Tablet for Business Presentation. This image showcases colorful 3D rendered charts and graphs displayed on a digital tablet, perfect for business presentations or reports illustrating growth and data analysis. The vibrant colors and clean design make it visually appealing and easy to understand.
Free with trial Colorful isometric bar chart showing business data and growth with bars of different height, colored blue, yellow and green. Isolated on a transparent background, perfect for business presentations or infographics. Isometric financial growth decrease vectors Colorful business chart illustration on transparent background AI Generated. Colorful isometric bar chart showing business data and growth with bars of different height, colored blue, yellow and green. Isolated on a transparent background, perfect for business presentations or infographics.
Free with trial This illustration depicts upward and downward trending arrows on a grid, symbolizing market fluctuations, business trends, and financial performance analysis. Isometric financial growth decrease vectors Illustration of upward and downward trending arrows on a grid isolated on white background. This illustration depicts upward and downward trending arrows on a grid, symbolizing market fluctuations, business trends, and financial performance analysis
Free with trial Set Digital speed meter Location Delivery tracking Graph chart diagram Hierarchy organogram Infographic element and Financial growth decrease icon. Vector. Isometric financial growth decrease illustrations Set Digital speed meter, Location, Delivery tracking, Graph, chart, diagram, Hierarchy organogram, Infographic element. Set Digital speed meter Location Delivery tracking Graph chart diagram Hierarchy organogram Infographic element and Financial growth decrease icon. Vector.
Free with trial This 3D rendered image shows a computer screen displaying various charts and graphs, including bar charts, pie charts, and line graphs. The data visualization is colorful and easy to understand, generated by AI for quick data interpretation. The design is simple and modern, ideal for presentations. Isometric financial growth decrease illustrations AI-Generated Data Dashboard. This 3D rendered image shows a computer screen displaying various charts and graphs, including bar charts, pie charts, and line graphs. The data visualization is colorful and easy to understand, generated by AI for quick data interpretation. The design is simple and modern, ideal for presentations
Free with trial A woman analyzes stock market data using a magnifying glass, with a falling coin and downward trending charts indicating a potential loss. Isometric financial growth decrease vectors Woman analyzing stock market data with magnifying glass tool. a woman analyzes stock market data using a magnifying glass, with a falling coin and downward trending charts indicating a potential loss.
Free with trial A 3D rendered bar chart displays a series of bars decreasing in height from left to right. The bars are colored with a gradient transitioning from blue to orange, set against a plain white background. The visual represents a downward trend or decline. Isometric financial growth decrease illustrations Downward Trending Bar Chart with Gradient Colors on a White Background graph statistics. A 3D rendered bar chart displays a series of bars decreasing in height from left to right. The bars are colored with a gradient transitioning from blue to orange, set against a plain white background. The visual represents a downward trend or decline
Free with trial 3d illustration of a percentage symbol standing on a pyramid pointing down. Isometric financial growth decrease vectors Percentage symbol standing on a pyramid pointing down