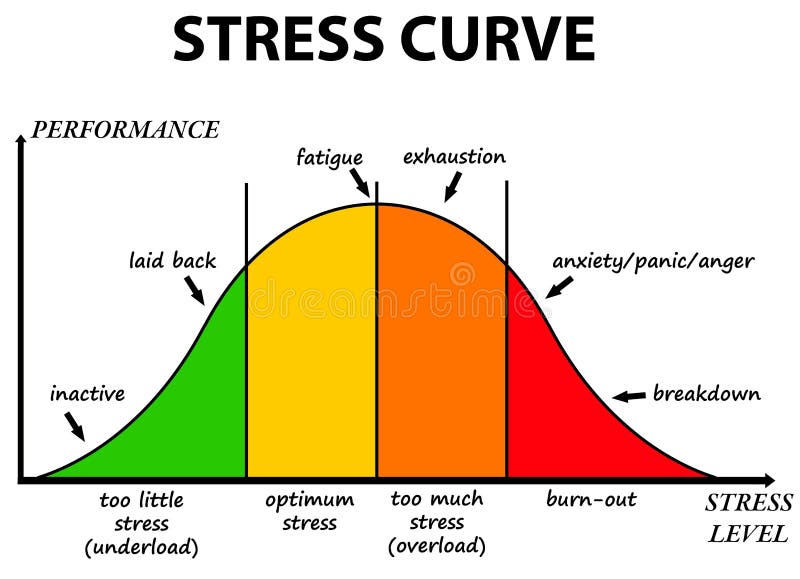
Free with trial Stress curve. Different stages of the stress curve ranging from underload to burn-out. Levels performance illustrations Stress curve. Different stages of the stress curve ranging from underload to burn-out
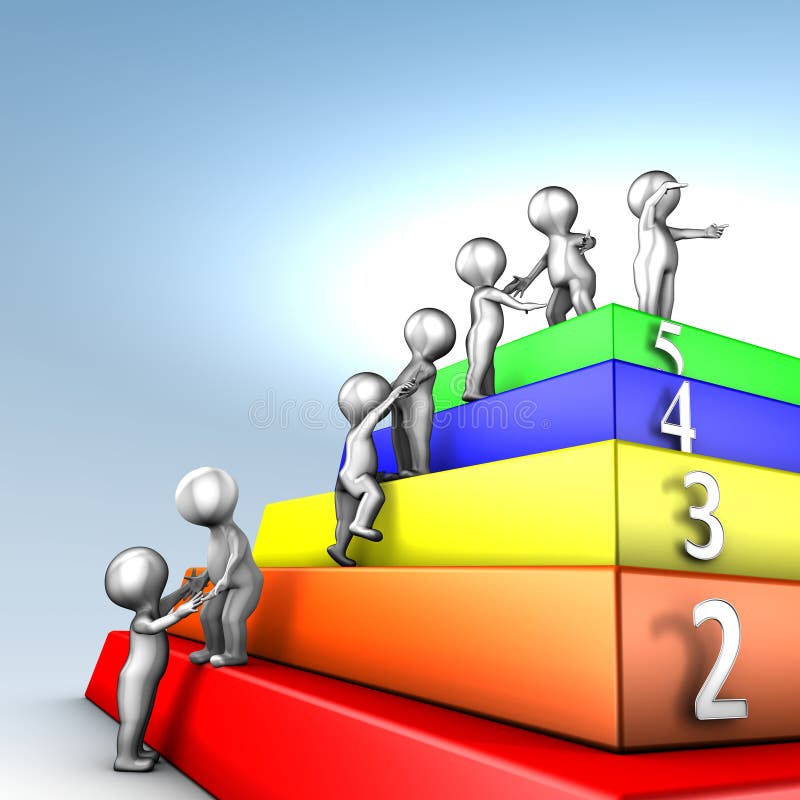
Free with trial Capability Maturity Model Integration is a process improvement approach that helps organizations to improve their performance. There are five maturity levels: 1-Initial, 2-Managed, 3-Defined, 4-Quantitatively Managed, 5-Optimizing. Levels performance illustrations Capability Maturity Model Integration maturity. Capability Maturity Model Integration is a process improvement approach that helps organizations to improve their. Capability Maturity Model Integration is a process improvement approach that helps organizations to improve their performance. There are five maturity levels: 1-Initial, 2-Managed, 3-Defined, 4-Quantitatively Managed, 5-Optimizing
Free with trial Three level pyramid. 3d rendered colorful layered pyramid chart with three levels in red, yellow and green isolated on white. Levels performance illustrations Three level pyramid. 3d rendered colorful layered pyramid chart with three levels in red, yellow and green isolated on white
Free with trial Thermometer scores. Scoring progress in different fields by using thermometer scores. Levels performance illustrations Thermometer scores. Scoring progress in different fields by using thermometer scores
Free with trial Jury. Showing their scores or points. Levels performance illustrations Jury. Showing their scores or points
Free with trial Filmstrip. 3d, filmstrip, film, strip transparent with reflection and glas. Levels performance illustrations Filmstrip. 3d, filmstrip, film, strip transparent with reflection and glas
Free with trial Amplifier. Vector illustration representing realistic detailed guitar Amplifier. Levels performance vectors Amplifier. Vector illustration representing realistic detailed guitar Amplifier
Free with trial Evaluation. Making decisions about scoring an evaluation. Levels performance illustrations Evaluation. Making decisions about scoring an evaluation
Free with trial Result evaluation. Evaluating result into different colorful categories. Levels performance illustrations Result evaluation. Evaluating result into different colorful categories
Free with trial Emotional scale. Mood indicator, customer satisfaction survey and colored emotions indication, emoji barometer indicators rating. Emotion levels measure isolated flat vector illustration. Levels performance vectors Emotional scale. Mood indicator, customer satisfaction survey and colored emotions emoji isolated flat vector. Emotional scale. Mood indicator, customer. Emotional scale. Mood indicator, customer satisfaction survey and colored emotions indication, emoji barometer indicators rating. Emotion levels measure isolated flat vector illustration
Free with trial Risk Gauge Scale Measure High, Medium and Low Risk Speedometer Icon from Green to Red Isolated. Vector. Levels performance vectors Risk Gauge Scale Measure High, Medium and Low Risk Speedometer Icon from Green to Red Isolated. Vector
Free with trial Pyramid 5 levels. Sliced pyramic, 5 levels over a white background. Levels performance illustrations Pyramid 5 levels. Sliced pyramic, 5 levels over a white background
Free with trial 6 levels pyramid structure environment concept. 6 levels pyramid structure red to green environment concept 3d illustration. Levels performance illustrations 6 levels pyramid structure environment concept. 6 levels pyramid structure red to green environment concept 3d illustration
Free with trial Red, Yellow and Green Equalizer. Digital sound beats through the equalizer at a music club and the levels pulse with the volume of the band. Levels performance illustrations Red, Yellow and Green Equalizer. Digital sound beats through the equalizer at a music club and the levels pulse with the volume of the band
Free with trial Sound studio. Microphone, headphones and control panel for management of levels of mixing and record sound studio. Levels performance illustrations Sound studio. Microphone, headphones and control panel for management of levels of mixing and record sound studio
Free with trial Speedometer icons with arrows. Dashboard with green, yellow, red indicators. Gauge elements of tachometer. Low, medium, high and risk levels. Scale score of speed, performance and rating power. Vector. Levels performance illustrations Speedometer icon with arrow. Dashboard with green, yellow, red indicators. Gauge elements of tachometer. Low, medium, high and. Speedometer icons with arrows. Speedometer icons with arrows. Dashboard with green, yellow, red indicators. Gauge elements of tachometer. Low, medium, high and risk levels. Scale score of speed, performance and rating power. Vector
Free with trial Scores. Jury with copy spaced notices to fill in scores. Levels performance illustrations Scores. Jury with copy spaced notices to fill in scores
Free with trial Evaluation. Clipboard with evaluation sheet and different results. Levels performance illustrations Evaluation. Clipboard with evaluation sheet and different results
Free with trial Imaginary Volume meter with set of useful buttons and knobs. Levels performance vectors Volume Meter. Imaginary Volume meter with set of useful buttons and knobs. Imaginary Volume meter with set of useful buttons and knobs.
Free with trial Impossible Circus. Circus performers in an impossible surreal circus. Levels performance illustrations Impossible Circus. Circus performers in an impossible surreal circus
Free with trial Blue Volume Meter. A vector illustration of a blue volume meter, likely part of your DJ project. Levels performance vectors Blue Volume Meter. A vector illustration of a blue volume meter, likely part of your DJ project
Free with trial Green Analog Meter. With scale and power written on it. Levels performance vectors Green Analog Meter. With scale and power written on it
Free with trial Green Volume Meter. A vector illustration of a green volume meter, likely part of your DJ project. Levels performance vectors Green Volume Meter. A vector illustration of a green volume meter, likely part of your DJ project
Free with trial Orange Analog Meter. An orange analog meter with output written on it. Levels performance vectors Orange Analog Meter. An orange analog meter with output written on it
Free with trial Expertise and vision. Going from data and information to expertise and vision. Levels performance illustrations Expertise and vision. Going from data and information to expertise and vision
Free with trial Chili Peppers Sharpness Scale Low Mild Medium Hot And Extreme - Speedometer Rating Icons - Vector Illustration. Levels performance vectors Chili Peppers Sharpness Scale Low Mild Medium Hot And Extreme - Speedometer Rating Icons - Vector Illustration
Free with trial Different team performance levels, with people figures on top of cylinders of different height, comparison of different teams and their performance. Levels performance illustrations Performance levels. Different team performance levels, with people figures on top of cylinders of different height, comparison of different teams and their. Different team performance levels, with people figures on top of cylinders of different height, comparison of different teams and their performance
Free with trial Pyramid 4 levels. Sliced pyramic, 4 levels over a white background. Levels performance illustrations Pyramid 4 levels. Sliced pyramic, 4 levels over a white background
Free with trial Blank pyramid 4 levels stack. White blank pyramid 4 levels stack chart whith shadow 3d illustration. Levels performance illustrations Blank pyramid 4 levels stack. White blank pyramid 4 levels stack chart whith shadow 3d illustration
Free with trial Steel pyramid with seven levels. 3D. Render illustration on white background. Levels performance illustrations Steel pyramid with seven levels. 3D. Render illustration on white background
Free with trial Business credit score. Customer satisfaction indicators levels. Credit score rating illustration. Colorful Info-graphic stock vector. Set of icons speedometers gauge dial for web design isolated. Levels performance vectors Business credit score. Customer satisfaction indicators levels. Credit score rating illustration. Colorful Info-graphic stock vect. Or. Set of icons speedometers. Business credit score. Customer satisfaction indicators levels. Credit score rating illustration. Colorful Info-graphic stock vector. Set of icons speedometers gauge dial for web design isolated
Free with trial Rainbow exploding Equalizer. Digital sound beats through the equalizer at a music club and the levels pulse with the volume of the band. Levels performance illustrations Rainbow exploding Equalizer. Digital sound beats through the equalizer at a music club and the levels pulse with the volume of the band
Free with trial Metallic control panel. For management of levels of sounding and record. Levels performance illustrations Metallic control panel. For management of levels of sounding and record
Free with trial Raise the bar. Rising arrow in blue, against a white background, with text saying raise the bar, concept of raising performance levels or quality standards. Levels performance illustrations Raise the bar. Rising arrow in blue, against a white background, with text saying raise the bar, concept of raising performance levels or quality standards
Free with trial Energy Efficiency Levels. Isolated on white background. 3D render. Levels performance illustrations Energy Efficiency Levels. Isolated on white background. 3D render
Free with trial Signal Meter. A vector meter with a red hand, retro-style. Levels performance vectors Signal Meter. A vector meter with a red hand, retro-style
Free with trial Data to vision. Developing a vision by getting the necessary expertise. Levels performance illustrations Data to vision. Developing a vision by getting the necessary expertise
Free with trial Pyramid with Colors. Illustration of a pyramid with four colored levels. Levels performance illustrations Pyramid with Colors. Illustration of a pyramid with four colored levels
Free with trial Analog Electrical Meter, realistic detailed vector. Levels performance vectors Analog Electrical Meter. Realistic detailed vector
Free with trial Blue Square Analog Meter. A blue electronic analog meter with peak on it. Levels performance vectors Blue Square Analog Meter. A blue electronic analog meter with peak on it
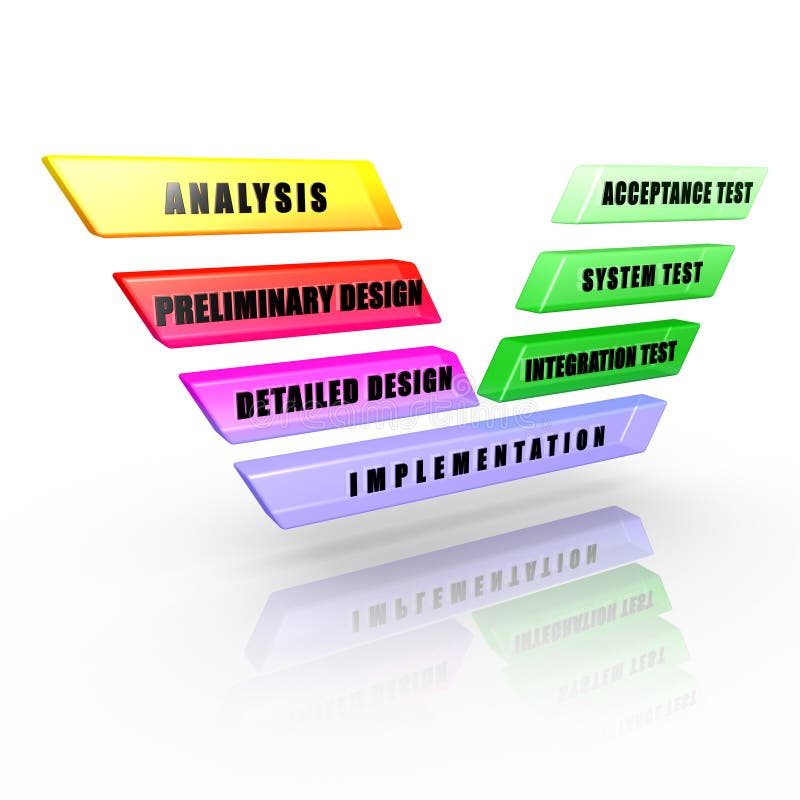
Free with trial Software development V-Model: Phases and levels of a software development life cycle. Levels performance illustrations Software development V-Model. Phases and levels of a software development life cycle
Free with trial Reality check. Lowering your expectations to a realistic level. Levels performance illustrations Reality check. Lowering your expectations to a realistic level
Free with trial Vector format is available. Easy to use and edit. Levels performance vectors Guitar Combo Amplifier Vector. Vector format is available. Easy to use and edit. Vector format is available. Easy to use and edit.
Free with trial Theater stage, audience. View of a theater audience hall from the stage through the curtains. Levels performance vectors Theater stage, audience. View of a theater audience hall from the stage through the curtains
Free with trial Procrastination styles. Several styles of procrastinating and postponing. Levels performance illustrations Procrastination styles. Several styles of procrastinating and postponing
Free with trial Vector format is available. Easy to use and edit. Levels performance illustrations Vector Guitar Amplifier. Vector format is available. Easy to use and edit. Vector format is available. Easy to use and edit.
Free with trial The word You on a thermometer measuring your good or great job performance, health, or other quality that is at very high levels. Levels performance illustrations You Thermometer Your Feedback Evaluation Assessment. The word You on a thermometer measuring your good or great job performance, health, or other quality that is. The word You on a thermometer measuring your good or great job performance, health, or other quality that is at very high levels
Free with trial Hand rotating a button and selecting the level of speed. This concept illustration is a metaphor for choosing the level of speed (internet, data, processor... ). Three levels are available: low, medium and high. Levels performance illustrations Hand rotating a button and selecting the level of speed. This concept illustration is a metaphor for choosing the level of speed (internet, data, processor
Free with trial Power meter. Abstract 3d illustration of power scale with reflections, dark background. Levels performance illustrations Power meter. Abstract 3d illustration of power scale with reflections, dark background
Free with trial Vector Guitar Amplifier. Isolated on a white background. Levels performance vectors Vector Guitar Amplifier. Isolated on a white background
Free with trial Analog Electrical Meter Red vector. Analog Electrical Meter Red, realistic detailed vector. Levels performance vectors Analog Electrical Meter Red vector. Analog Electrical Meter Red, realistic detailed vector
Free with trial Vector realistic risk meter on white background. Risk indicator radial gauge scale with different color low, moderate, high levels. Levels performance vectors Vector realistic risk meter on white background. Risk indicator radial gauge scale with different color low, moderate, high levels
Free with trial Low to High meter rate with colors from red to green. Vector illustration design from worst to best gauges. 3D style. Levels performance vectors Low to High meter rate with colors from red to green. Vector illustration design from worst to best gauges. 3D style
Free with trial Home energy efficiency ratings. House with energy efficiency levels graph, energetic consumption. Levels performance illustrations Home energy efficiency ratings. House with energy efficiency levels graph, energetic consumption
Free with trial Stress Curve shows the relationship between stress levels and performance, highlighting fatigue, exhaustion, and burnout. Doodle style diagram. Levels performance vectors Stress Curve shows the relationship between stress levels and performance, ... Stress Curve shows the relationship between stress levels and performance. Stress Curve shows the relationship between stress levels and performance, highlighting fatigue, exhaustion, and burnout. Doodle style diagram
Free with trial Set of Performance Indicator. Set of analog indicators showing the levels of PERFORMANCE in percentage. 3D illustration. Levels performance illustrations Set of Performance Indicator. Set of analog indicators showing the levels of PERFORMANCE in percentage. 3D illustration
Free with trial Speedometer gauge icon set. Performance or status levels vector illustration. Used for dashboards, monitoring, control and analytics symbol. Ideal for UI, apps and web interfaces sign. Levels performance vectors Speedometer gauge icon set. Performance or status levels vector illustration. Used for dashboards, monitoring, control and. Analytics symbol. Ideal for UI, apps
Free with trial Sales level thermometer. A thermometer style sales measurement tool in 3d. showing whole range of sales performance levels. Levels performance illustrations Sales level thermometer. A thermometer style sales measurement tool in 3d. showing whole range of sales performance levels
Free with trial Procrastination levels. Different levels of fearful procrastination. Levels performance illustrations Procrastination levels. Different levels of fearful procrastination
Free with trial Performance Level improvement Efficiency Review Concept. Levels performance illustrations Performance Level improvement Efficiency Review Concept
Free with trial A pyramid of several steps and levels with 1 percent at the top as the dominant minority in terms of most income or privilege, the rich class in a society. Levels performance illustrations Top 1% Percent Pyramid Levels Upper Class Dominant Minority. A pyramid of several steps and levels with 1 percent at the top as the dominant minority in terms of. A pyramid of several steps and levels with 1 percent at the top as the dominant minority in terms of most income or privilege, the rich class in a society
Free with trial Colorful pyramid 4 levels stack. Colorful blank pyramid 4 levels stack chart with shadow 3d illustration. Levels performance illustrations Colorful pyramid 4 levels stack. Colorful blank pyramid 4 levels stack chart with shadow 3d illustration
Free with trial Career levels and employee work progress in hierarchy tiny person concept. Company positions from entry level to senior and executive vector illustration. Effective collaboration and partnership. Levels performance vectors Career levels and employee work progress in hierarchy tiny person concept. Company positions from entry level to senior and executive vector illustration
Free with trial Credit score indicators. Limit indicators with color levels from poor to good. Gauges with measuring scale. Business credit score speedometers, indicators scale estimation of bank loan approval vector. Levels performance vectors Credit limit indicators with color levels from poor to good. Credit score indicators. Limit indicators with color levels from poor to good. Gauges with. Credit score indicators. Limit indicators with color levels from poor to good. Gauges with measuring scale. Business credit score speedometers, indicators scale estimation of bank loan approval vector
Free with trial Minimalist score indicators with color levels from low to max. Abstract concept graphic element of tachometer, speedometer. Gauges vector set. Levels performance vectors Minimalist score indicators with color levels. From low to max. Abstract concept graphic element of tachometer, speedometer. Gauges vector set
Free with trial Cartoon businessman stand on different levels of pie chart. Creative vector business illustration on market share in businesses isolated on blue background. Levels performance vectors Businessmen Stand on Different Levels of Pie Chart Vector Business Illustration. Cartoon businessman stand on different levels of pie chart. Creative vector. Cartoon businessman stand on different levels of pie chart. Creative vector business illustration on market share in businesses isolated on blue background.
Free with trial Skill levels vector. Vector illustration. Skill levels vector image. Levels performance vectors Skill levels vector. Vector illustration. Skill levels vector image. Vector illustration
Free with trial Skill levels vector. Vector illustration. Skill levels vector, control. Levels performance vectors Skill levels vector. Vector illustration. Skill levels vector, control. Vector illustration
Free with trial Skill levels vector. Vector illustration. Skill levels vector, icon. Levels performance vectors Skill levels vector. Vector illustration. Skill levels vector, icon. Vector illustration
Free with trial Skill levels vector. Vector illustration. Skill levels vector, education. Levels performance vectors Skill levels vector. Vector illustration. Skill levels vector, education. Vector illustration
Free with trial Pyramid chart, icon in line design. Pyramid, chart, hierarchy, levels, structure, data, layers on white background. Vector. Pyramid chart editable stroke icon. Levels performance vectors Pyramid chart, icon in line design. Pyramid, chart, hierarchy, levels, structure, data, layers on white background. Vector. Pyramid chart editable stroke icon
Free with trial Energy levels with house shaped bars. 3D illustration. Levels performance illustrations Energy levels with house shaped bars. 3D illustration.
Free with trial Skill levels vector. Vector illustration. Skill levels vector, control. Levels performance vectors Skill levels vector. Vector illustration. Skill levels vector, control. Vector illustration
Free with trial Seven levels of energetic efficiency. 3D render illustration isolated on white background. Levels performance illustrations Seven levels of energetic efficiency. 3D render illustration isolated on white background
Free with trial Profit levels knob button. Increasing Profit Level. Wireframe hand setting profit button on highest position. Finance concept illustration of profitability or return on investment. Vector illustration. Levels performance illustrations Profit levels knob button. Increasing Profit Level. Wireframe hand setting profit button on highest position. Finance concept. Illustration of profitability or. Profit levels knob button. Increasing Profit Level. Wireframe hand setting profit button on highest position. Finance concept illustration of profitability or return on investment. Vector illustration
Free with trial A supply chain manager analyzing stock levels. On a computer screen. Levels performance illustrations A supply chain manager analyzing stock levels. On a computer screen
Free with trial Holding bow and arrow aiming at targets of target at different levels. Levels performance vectors Holding bow and arrow aiming at targets of target at different levels
Free with trial Levels of Brand Equity pyramid Model or Customer Based Brand Equity Model or CBBE. Vector. Levels performance vectors Levels of Brand Equity pyramid Model or Customer Based Brand Equity Model or CBBE. Vector
Free with trial Skill levels knob button. Increasing Skills Level. Wireframe hand turning a skill test knob to the maximum position. Concept of professional or educational knowledge. Vector illustration. Levels performance illustrations Skill levels knob button. Increasing Skills Level. Wireframe hand turning a skill test knob to the maximum position. Concept of. Professional or educational. Skill levels knob button. Increasing Skills Level. Wireframe hand turning a skill test knob to the maximum position. Concept of professional or educational knowledge. Vector illustration
Free with trial Vector infographic three options, infographic 3 levels pricing plan banners, infographic template for Marketing presentation slide, Business labels concept, 3 options, parts, steps, processes. Levels performance vectors Vector infographic three options, infographic 3 levels. Pricing plan banners, infographic template for Marketing presentation slide, Business labels concept, 3. Vector infographic three options, infographic 3 levels pricing plan banners, infographic template for Marketing presentation slide, Business labels concept, 3 options, parts, steps, processes.
 Sign in