Free with trial Price and discount, cost reduction, profit growth financial strategy line icon set. Increase and decrease, optimization of price, competition thin black and red outline symbols vector illustration. Line decrease vectors Price and discount, cost reduction, profit growth financial strategy line icon set
Free with trial Isolated showing simple line graph showing downward trend on white background keywords: graph, chart, line graph, downward trend, decline, decrease. Line decrease illustrations Simple Line Graph Showing Downward Trend on White Background Keywords: graph, chart, line graph, downward trend
Free with trial A black percentage sign is followed by a horizontal line on a white background, suggesting a decrease. Line decrease illustrations Percentage sign and horizontal line on a white background symbol discount. A black percentage sign is followed by a horizontal line on a white background, suggesting a decrease
Free with trial Data melting line graph illustration trend analysis, visualization ice, decrease plot data melting line graph. Line decrease illustrations Data melting line graph
Free with trial Analysis spiraling line graph illustration curve plot, statistics diagram, increase decrease analysis spiraling line graph. Line decrease illustrations Analysis spiraling line graph
Free with trial Temperature melting line graph illustration data trend, analysis visualization, ice decrease temperature melting line graph. Line decrease illustrations Temperature melting line graph
Free with trial Analysis stretching line graph illustration chvisualization axis, points curve, increase decrease analysis stretching line graph. Line decrease illustrations Analysis stretching line graph
Free with trial Trend disintegrating line graph illustration dec decrease, fall analysis, visualization statistics trend disintegrating line graph. Line decrease illustrations Trend disintegrating line graph
Free with trial Set line Employee dismissal, Money bag, Pie chart infographic and Dollar rate decrease icon. Vector. Line decrease illustrations Set line Employee dismissal, Money bag, Pie chart infographic and Dollar rate decrease icon. Vector
Free with trial A simple line graph icon showing a downward trend with two arrows and the words "DECREASE DECLINE. Line decrease illustrations Downward Trend Graph Icon with Decrease Decline Text chart. A simple line graph icon showing a downward trend with two arrows and the words "DECREASE DECLINE
Free with trial Trend melting line graph illustration analysis visualization, ice decrease, plot statistics trend melting line graph. Line decrease illustrations Trend melting line graph
Free with trial A minimalist vector graphic showing a plus and minus symbol within a rounded rectangle. This UI element is used for functions like zoom in, zoom out, increase, or decrease. Line decrease vectors Plus and minus line icon for increase and decrease control button. A minimalist vector graphic showing a plus and minus symbol within a rounded rectangle. This UI element is used for functions like zoom in, zoom out, increase, or decrease
Free with trial Decrease indent text outline icon set designed for document editors, writing software, typography platforms, content management systems, and structured formatting tools. Line decrease vectors Decrease Indent Text Line Icon Minimal Outline Collection for Document Formatting and Editing Tools. Decrease indent text outline icon set designed for document editors, writing software, typography platforms, content management systems, and structured formatting tools
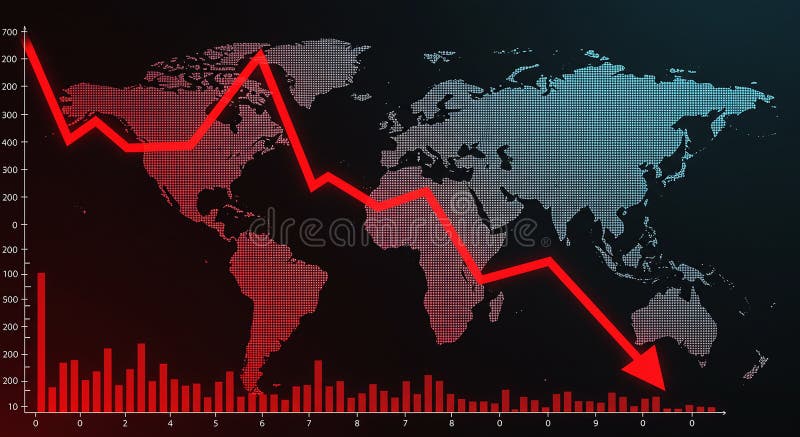
Free with trial World map with a red declining line graph overlay, illustrating a decrease or economic downturn. The graph features sharp declines across various data points, reflecting a downward trend. Red bar chart at the bottom represents additional numerical data against a black background. The map uses a dotted pattern for continents, highlighting regions globally. The image conveys financial analysis, market trends, or economic statistics. Line decrease illustrations World map with a red declining line graph overlay
Free with trial A simple down arrow positioned on a horizontal line, symbolizing decrease, lower, or downward movement. This vector illustration is ideal for data visualization, stock market trends, user interface elements, or statistical reports. It represents reduction and negative changes in various contexts, vector design Generative AI. Line decrease vectors Down Arrow Indicator, Decrease and Lower, vector design Generative AI. A simple down arrow positioned on a horizontal line, symbolizing decrease, lower, or downward movement. This vector illustration is ideal for data visualization, stock market trends, user interface elements, or statistical reports. It represents reduction and negative changes in various contexts, vector design Generative AI
Free with trial Design anemia blood with few blood cells medical line icon red blood cell volume decrease. Line decrease illustrations Anemia blood with few blood cells medical line icon red blood cell volume decrease
Free with trial An illustration of a simple line graph showing a decline or decrease, accompanied by an exclamation mark inside a triangle, indicating a warning, danger or risk. Suitable for topics like financial loss, market crash, or economic downturn. Line decrease vectors Simple Line Decline Graph with Exclamation Mark Attention Icon Design. An illustration of a simple line graph showing a decline or decrease, accompanied by an exclamation mark inside a triangle, indicating a warning, danger or risk. Suitable for topics like financial loss, market crash, or economic downturn.
Free with trial Set line Gold bars Glass money jar with coin Employee dismissal Drop crude oil price Bank building Pie chart infographic Briefcase and Dollar rate decrease icon. Vector. Line decrease illustrations Set line Gold bars, Glass money jar with coin, Employee dismissal, Drop crude oil price, Bank building, Pie chart. Set line Gold bars Glass money jar with coin. Set line Gold bars Glass money jar with coin Employee dismissal Drop crude oil price Bank building Pie chart infographic Briefcase and Dollar rate decrease icon. Vector.
Free with trial Speaker Volume Adjustment Up Down Radio Sound Adjust Dial Increase Decrease Plus Minus Black Outline Line Sign Symbol Audio Button Control Graphic. Line decrease vectors Speaker Volume Adjustment Up Down Radio Sound Adjust Dial Increase Decrease Plus Minus Black Outline Line Sign
Free with trial A clear vector illustration of a line graph showing a downward trend. Represents financial decline, negative performance, market downturns, or decreasing metrics. Ideal for business reports, financial analysis, economic indicators, or risk assessment. It visually communicates a decrease or a challenging period, vector design Generative AI. Line decrease vectors Downtrend Line Graph Financial Market Decline, vector design Generative AI. A clear vector illustration of a line graph showing a downward trend. Represents financial decline, negative performance, market downturns, or decreasing metrics. Ideal for business reports, financial analysis, economic indicators, or risk assessment. It visually communicates a decrease or a challenging period, vector design Generative AI
Free with trial Set line Secure your site with HTTPS SSL Browser window Cloud technology data transfer Online play video Photo retouching Financial growth decrease and Digital speed meter icon. Vector. Line decrease illustrations Set line Secure your site with HTTPS, SSL, Browser window, Cloud technology data transfer, Online play video, Photo. Set line Secure your site with HTTPS SSL Browser window Cloud technology data transfer Online play video Photo retouching Financial growth decrease and Digital speed meter icon. Vector.
Free with trial Set line Dollar rate decrease Mobile stock trading Shutdown of factory Falling property prices Global economic crisis Briefcase and Contract money and pen icon. Vector. Line decrease illustrations Set line Dollar rate decrease, Mobile stock trading, Shutdown of factory, Falling property prices, Global economic. Set line Dollar rate decrease Mobile stock trading Shutdown of factory Falling property prices Global economic crisis Briefcase and Contract money and pen icon. Vector.
Free with trial A 3D red bar chart shows a declining trend against a white grid background. The bars decrease in height from left to right, with a red line graph following the downward trajectory. Line decrease illustrations Red 3 D bar chart with downward trend line on white grid background graph line graph. A 3D red bar chart shows a declining trend against a white grid background. The bars decrease in height from left to right, with a red line graph following the downward trajectory
Free with trial Set line Casino chip with dollar Coin money win Automated teller machine and chips slot clover Financial growth decrease and Stacks paper cash icon. Vector. Line decrease illustrations Set line Casino chip with dollar, Coin money, win, Automated teller machine and, chips, slot clover, Financial growth. Set line Casino chip with dollar Coin money win Automated teller machine and chips slot clover Financial growth decrease and Stacks paper cash icon. Vector.
Free with trial Set line Global economic crisis Drop in crude oil price Briefcase Dollar rate decrease Calculation of expenses and Fire burning house icon. Vector. Line decrease illustrations Set line Global economic crisis, Drop in crude oil price, Briefcase, Dollar rate decrease, Calculation of expenses and. Set line Global economic crisis Drop in crude oil price Briefcase Dollar rate decrease Calculation of expenses and Fire burning house icon. Vector.
Free with trial A single black line forms a spiral shell and a wavy line across a white background. The shell's spiral is intricate, with multiple concentric curves that decrease in size towards the center. The wavy line below suggests water or a surface. The composition is minimalist and abstract, focusing on the organic shape of the shell. Line decrease vectors Black spiral shell on white background with wavy line. A single black line forms a spiral shell and a wavy line across a white background. The shell's spiral is intricate, with multiple concentric curves that decrease in size towards the center. The wavy line below suggests water or a surface. The composition is minimalist and abstract, focusing on the organic shape of the shell
Free with trial A black curved line graph showing a downward trend on a white background. Clear details and vibrant colors enh. Line decrease illustrations Black curved line graph showing decrease on white background chart decreasing. A black curved line graph showing a downward trend on a white background. Clear details and vibrant colors enh
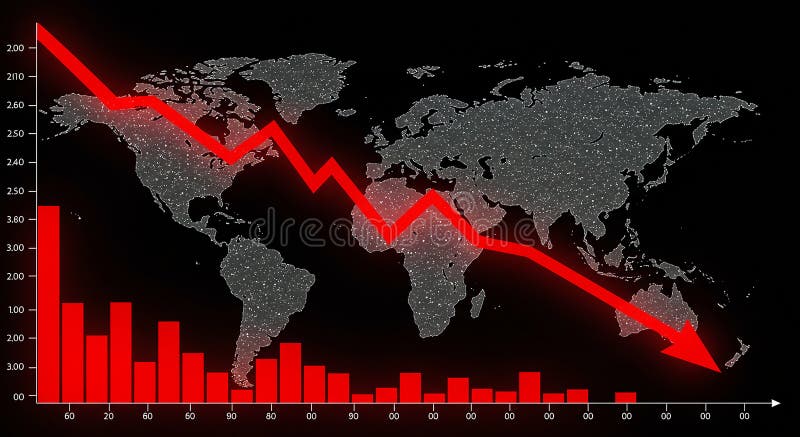
Free with trial World map backdrop with a downward-trending red line graph and red bar graph, set against a black background. The bar graph features various heights, indicating statistical data points, while the line graph suggests a decrease. The map includes continents like Africa, Europe, Asia, and the Americas, with numerous small white dots representing data or illumination. The dramatic red color emphasizes the negative trend, possibly symbolizing economic or market decline on a global scale. Line decrease illustrations World map backdrop with a downward-trending red line graph and red bar graph
Free with trial Volume Decrease Button Line icon Sound Reduce Reduction Arrow Pointing Point Down Soft Softer Quiet Level Media Multimedia Control Outline Shape Music. Line decrease vectors Volume Decrease Button Line icon Sound Reduce Reduction Arrow Pointing Point Down Soft Softer Quiet Level Media Multimedia
Free with trial A clear vector illustration of a declining line graph, symbolizing market downturn, economic challenges, and negative trends. Ideal for financial reports, business analysis, and risk assessment. Represents a decrease in performance and a need for strategic adjustments, vector design Generative AI. Line decrease vectors Declining Line Graph for Market Downturn and Economic Challenges, vector design Generative AI. A clear vector illustration of a declining line graph, symbolizing market downturn, economic challenges, and negative trends. Ideal for financial reports, business analysis, and risk assessment. Represents a decrease in performance and a need for strategic adjustments, vector design Generative AI
Free with trial A minimalist flat style vector illustration showing a downward sloping line graph in red. Represents decline, decrease, loss, or negative trends. Useful for financial reports, business presentations, analytics dashboards, or economic charts indicating reduction, vector design Generative AI. Line decrease vectors Flat style red line chart graph decline icon vector design Generative AI. A minimalist flat style vector illustration showing a downward sloping line graph in red. Represents decline, decrease, loss, or negative trends. Useful for financial reports, business presentations, analytics dashboards, or economic charts indicating reduction, vector design Generative AI
Free with trial Smooth, dark pebbles are arranged in a vertical line on a coarse-textured surface. They gradually decrease in size from top to bottom, surrounded by smaller pebbles scattered around them. The overall color scheme is a muted gray, providing a soothing, naturalistic appearance resembling a Zen garden or riverbed. The composition emphasizes simplicity and harmony. Line decrease illustrations Smooth, dark pebbles are arranged in a vertical line on a coarse-textured surface
Free with trial A vector icon of a descending line graph on a green base, illustrating a downward trend, decrease, or decline in data. Represents financial loss, reduced performance, or negative growth. Suitable for business reports, statistical analysis, and economic presentations, vector design Generative AI. Line decrease vectors Descending Line Graph Decline Trend Chart Icon, vector design Generative AI. A vector icon of a descending line graph on a green base, illustrating a downward trend, decrease, or decline in data. Represents financial loss, reduced performance, or negative growth. Suitable for business reports, statistical analysis, and economic presentations, vector design Generative AI
Free with trial A horizontal line composed of black dots of varying sizes against a white background. The dots gradually increase in size towards the center, forming a focal point, and then decrease in size towards the edges, creating a subtle gradient effect. Line decrease illustrations Black dots line graphic with increasing and decreasing size dot line graphic element. A horizontal line composed of black dots of varying sizes against a white background. The dots gradually increase in size towards the center, forming a focal point, and then decrease in size towards the edges, creating a subtle gradient effect
Free with trial A vector graphic of a line graph showing a downward trend. Represents decrease, decline, loss, or negative performance. In automotive context, could symbolize falling sales, decreasing fuel efficiency, or a system performance drop. A clear visual for illustrating negative trends, vector design Generative AI. Line decrease vectors Downtrend graph icon, decrease decline loss symbol, vector design Generative AI. A vector graphic of a line graph showing a downward trend. Represents decrease, decline, loss, or negative performance. In automotive context, could symbolize falling sales, decreasing fuel efficiency, or a system performance drop. A clear visual for illustrating negative trends, vector design Generative AI
Free with trial A simple line graph icon showing a downward trend, representing statistics, data, or a decline in performance. Useful for financial reports, market analysis, or educational materials. Its clear visual direction conveys negative momentum or a decrease, vector design Generative AI. Line decrease vectors Downward Trend Line Graph Icon for Statistics and Data, vector design Generative AI. A simple line graph icon showing a downward trend, representing statistics, data, or a decline in performance. Useful for financial reports, market analysis, or educational materials. Its clear visual direction conveys negative momentum or a decrease, vector design Generative AI
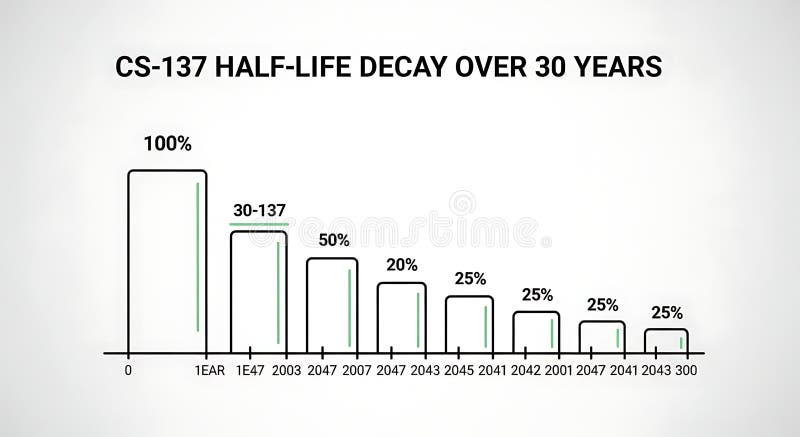
Free with trial A line graph illustrating the decrease in half-life over 30 years with bars representing percentage decay at different years, demonstrating long-term decline suitable for scientific, educational, or research presentations. Line decrease illustrations Half-life Decay Over 30 Years Chart Showing Decrease in Value or Effectiveness. A line graph illustrating the decrease in half-life over 30 years with bars representing percentage decay at different years, demonstrating long-term decline suitable for scientific, educational, or research presentations
Free with trial A simple green icon of a horizontal line or minus sign, commonly used in user interfaces and designs to indicate reduction, removal, subtraction, or minimizing options, , vector design Generative AI. Line decrease vectors Minus line icon in green, representing decrease or removal , vector design Generative AI. A simple green icon of a horizontal line or minus sign, commonly used in user interfaces and designs to indicate reduction, removal, subtraction, or minimizing options, , vector design Generative AI