Free with trial Displaying slanted turquoise banner showing bold pink HUGE SALE text in interface, with line charts. Digital, marketing, modern, technology, data, analytics, futuristic. Line decrease illustrations Displaying slanted turquoise banner showing bold pink HUGE SALE text in interface, with line charts
Free with trial Interface displaying downward-trending bar chart and dotted line on dashboard, with ticker symbols. Finance, analytics, data visualization, investment, technological, corporate, digital. Line decrease illustrations Interface displaying downward-trending bar chart and dotted line on dashboard, with ticker symbols
Free with trial Set line Online sports betting Calendar Casino chip with dollar chips Hand holding casino Automated teller machine money Football and Financial growth decrease icon. Vector. Line decrease vectors Set line Online sports betting, Calendar, Casino chip with dollar, chips, Hand holding casino, Automated teller machine. Set line Online sports betting Calendar Casino chip with dollar chips Hand holding casino Automated teller machine money Football and Financial growth decrease icon. Vector.
Free with trial Diagram with recession and bankruptcy. Graph with decrease report. Business and finance vector illustration. Line decrease vectors Diagram with recession and bankruptcy. Graph with decrease report. Business and finance vector
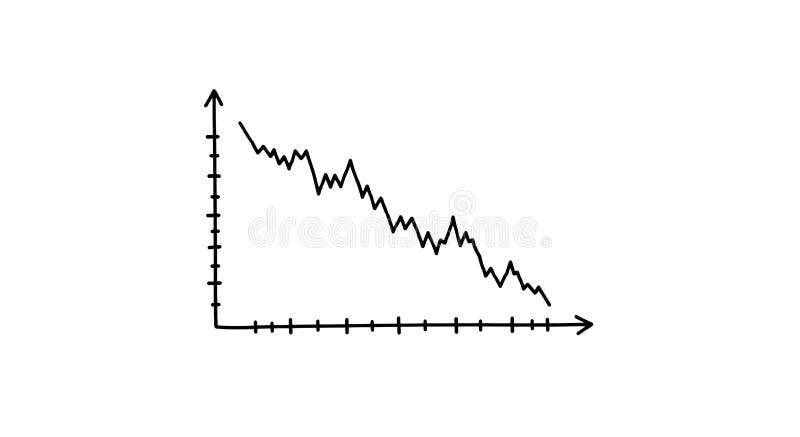
Free with trial A simple, hand-drawn line graph displayed on a plain white background illustrates a notable downward trend. The black line demonstrates decreasing values over time along the defined axes. Line decrease vectors Descending line graph displays a downward trend, isolated on white background. A simple, hand-drawn line graph displayed on a plain white background illustrates a notable downward trend. The black line demonstrates decreasing values over time along the defined axes.
Free with trial Cost reduction icon price lower arrow. Vector low cost money crisis line icon. Line decrease vectors Cost reduction icon price lower arrow. Vector low cost money crisis line icon
Free with trial There are 40 different types of increase and decrease icon set. Line decrease vectors Increase and decrease icon set collection. There are 40 different types of increase and decrease icon set.
Free with trial Diagram with recession and bankruptcy progress. Graph with decrease report. Business and finance vector. Line decrease vectors Diagram with recession and bankruptcy progress. Graph with decrease report. Business and finance
Free with trial Analytics graph line icon. Neumorphic, Flat shadow, 3d buttons. Column chart sign. Growth diagram symbol. Line analytics graph icon. Social media icons. Vector. Line decrease vectors Analytics graph line icon. Column chart sign. Neumorphic buttons. Vector. Analytics graph line icon. Neumorphic, Flat shadow, 3d buttons. Column chart sign. Growth diagram symbol. Line analytics graph icon. Social media icons. Vector
Free with trial A colorful bar graph with a line graph overlayed on a blue background. it shows data trends and market analysis in a simple visual format. Line decrease vectors Colorful bar graph with a line graph on a blue background. a colorful bar graph with a line graph overlayed on a blue background. it shows data trends and market analysis in a simple visual format
Free with trial An illuminated downward arrow with a jagged line signifies a decline, representing negative performance and can be used to illustrate a decrease in business or any downward trend. Line decrease illustrations Declining Arrow Shows Downtrend and Negative Performance. An illuminated downward arrow with a jagged line signifies a decline, representing negative performance and can be used to illustrate a decrease in business or any downward trend
Free with trial Power consumption reduction icon, line vector, eps 10 file, easy to edit. Line decrease vectors Power consumption reduction icon, line vector
Free with trial Horizontal chart line icon. Neumorphic, Flat shadow, 3d buttons. Column graph sign. Market analytics symbol. Line horizontal chart icon. Social media icons. Vector. Line decrease illustrations Horizontal chart line icon. Column graph sign. Neumorphic buttons. Vector. Horizontal chart line icon. Neumorphic, Flat shadow, 3d buttons. Column graph sign. Market analytics symbol. Line horizontal chart icon. Social media icons. Vector
Free with trial Pyramid chart line icon. Neumorphic, Flat shadow, 3d buttons. Analytics graph sign. Market analytics symbol. Line pyramid chart icon. Social media icons. Vector. Line decrease vectors Pyramid chart line icon. Analytics graph sign. Neumorphic buttons. Vector. Pyramid chart line icon. Neumorphic, Flat shadow, 3d buttons. Analytics graph sign. Market analytics symbol. Line pyramid chart icon. Social media icons. Vector
Free with trial Diagram chart line icon. Neumorphic, Flat shadow, 3d buttons. Column 3d graph sign. Market analytics symbol. Line 3d chart icon. Social media icons. Vector. Line decrease vectors Diagram chart line icon. Column 3d graph sign. Neumorphic buttons. Vector. Diagram chart line icon. Neumorphic, Flat shadow, 3d buttons. Column 3d graph sign. Market analytics symbol. Line 3d chart icon. Social media icons. Vector
Free with trial This chart depicts a significant downward trend in stock value over a period. The red line graphically represents the declining prices, indicating a bearish market or a stock facing substantial losses. Line decrease illustrations Stock market downturn visualized red line chart showing price decline over time. This chart depicts a significant downward trend in stock value over a period. The red line graphically represents the declining prices, indicating a bearish market or a stock facing substantial losses
Free with trial This image features two minimalist icons representing financial or data trends. The left icon is a white line graph with circular data points and directional arrows, set against a solid black shield shape. The right icon presents the same line graph and data points within a black outline of a shield, on a white background. Both icons depict fluctuating data, with one showing a downward trend and the other an upward trend, symbolizing market volatility, analysis, and security. Line decrease illustrations Line Graph Icon with Shield Symbol - Upward and Downward Trends. This image features two minimalist icons representing financial or data trends. The left icon is a white line graph with circular data points and directional arrows, set against a solid black shield shape. The right icon presents the same line graph and data points within a black outline of a shield, on a white background. Both icons depict fluctuating data, with one showing a downward trend and the other an upward trend, symbolizing market volatility, analysis, and security.
Free with trial A red line graph shows a steady decline in values over a period. The downward trajectory reflects a significant decrease, with data points plotted against a grid background. Line decrease illustrations Declining trend line illustrates significant downward movement in data over time. A red line graph shows a steady decline in values over a period. The downward trajectory reflects a significant decrease, with data points plotted against a grid background.
Free with trial This striking image features a black line spiral, precisely centered against a stark white backdrop. The spiral's concentric rings decrease in size toward the center, creating captivating visual depth and a hypnotic effect. Line decrease illustrations Minimalist Graphic Design: Concentric Black Line Spiral on Clean White Background. This striking image features a black line spiral, precisely centered against a stark white backdrop. The spiral's concentric rings decrease in size toward the center, creating captivating visual depth and a hypnotic effect.
Free with trial Decreasing graph line icon. Continuous line big heart. Column chart sign. Market analytics symbol. 3d hearts in heart shaped loop. Decreasing graph single line ribbon. Loop curve pattern. Vector. Line decrease vectors Decreasing graph line icon. Column chart sign. Continuous line big heart. Vector. Decreasing graph line icon. Continuous line big heart. Column chart sign. Market analytics symbol. 3d hearts in heart shaped loop. Decreasing graph single line ribbon. Loop curve pattern. Vector
Free with trial Pie chart line icon. Neumorphic, Flat shadow, 3d buttons. Presentation 3d graph sign. Market analytics symbol. Line pie chart icon. Social media icons. Vector. Line decrease vectors Pie chart line icon. Presentation 3d graph sign. Neumorphic buttons. Vector. Pie chart line icon. Neumorphic, Flat shadow, 3d buttons. Presentation 3d graph sign. Market analytics symbol. Line pie chart icon. Social media icons. Vector
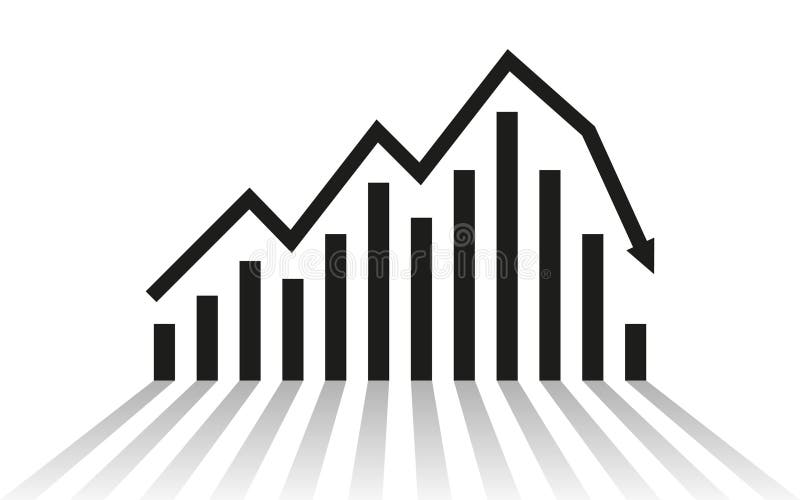
Free with trial A simple bar chart and line graph with a downward arrow illustrates a negative trend like recession or business failure ideal for financial reports about crisis or loss. Line decrease illustrations Declining Blue Bar Chart and Line Graph Showing Financial Loss on Gray Background. A simple bar chart and line graph with a downward arrow illustrates a negative trend like recession or business failure ideal for financial reports about crisis or loss
Free with trial A straightforward vector illustration of a simple red down-pointing arrow, indicating decline or decrease. Useful for financial charts, warning signs, negative trends, and downward movement. Represents reduction, lowering, and adverse changes, vector design Generative AI. Line decrease vectors Simple Red Down Arrow Icon, Decline and Decrease Indicator, vector design Generative AI. A straightforward vector illustration of a simple red down-pointing arrow, indicating decline or decrease. Useful for financial charts, warning signs, negative trends, and downward movement. Represents reduction, lowering, and adverse changes, vector design Generative AI
Free with trial Calendar graph line icon. Halftone dotted pattern. Gradient icon with grain shadow. Column chart sign. Growth diagram symbol. Line calendar graph icon. Various designs. Vector. Line decrease vectors Calendar graph line icon. Column chart sign. Halftone dotted pattern. Vector. Calendar graph line icon. Halftone dotted pattern. Gradient icon with grain shadow. Column chart sign. Growth diagram symbol. Line calendar graph icon. Various designs. Vector
Free with trial Line Art Cartoon Sad Man Walking Under Downward Arrow Symbol of Decline and Failure. Line decrease vectors Line Art Cartoon Sad Man Walking Under Downward Arrow Symbol of Decline and Failure
Free with trial Viewing Progress Icon Line Design Style Finance and Business Symbol Vector Illustrations. Line decrease vectors Viewing Progress Icon Line Design Style Finance and Business Symbol
Free with trial A simple bar chart with a falling line, symbolizing financial decline, economic downturn, decreased profits, market loss, or negative business results. Ideal for illustrating risks, challenges, crisis situations, and economic analysis. Line decrease vectors Declining financial chart icon with downward trend showing loss, decrease and negative business performance. A simple bar chart with a falling line, symbolizing financial decline, economic downturn, decreased profits, market loss, or negative business results. Ideal for illustrating risks, challenges, crisis situations, and economic analysis.
Free with trial Outline vector icon of a line graph showing a downward trend. Represents decline, loss, decrease, failure, or negative performance in line art. Suitable for financial reports, data analysis, business presentations, and illustrating negative change, vector design Generative AI. Line decrease vectors Downward Trend Graph Icon Outline, Decline Loss Failure Symbol, vector design Generative AI. Outline vector icon of a line graph showing a downward trend. Represents decline, loss, decrease, failure, or negative performance in line art. Suitable for financial reports, data analysis, business presentations, and illustrating negative change, vector design Generative AI
Free with trial A simple black line graph depicts a downward trend with sharp fluctuations on white. Line decrease illustrations Black line graph showing a downward trend on a white background chart. A simple black line graph depicts a downward trend with sharp fluctuations on white
Free with trial Hexagonal logo design featuring concentric hexagons in gradient shades of blue and purple. The shapes decrease in size towards the center, creating a layered effect. The logo floats with a subtle shadow underneath against a white background, emphasizing its geometric symmetry and vibrant color transition. Line decrease illustrations The shapes decrease in size towards the center, creating a layered effect
Free with trial Graphs set with line charts, bar charts, and scatter plots illustrating upward and downward trends with arrows and data points. Line decrease vectors Graphs set with line charts, bar charts, and scatter plots illustrating upward and
Free with trial Decreasing graph line icon. Halftone dotted pattern. Gradient icon with grain shadow. Column chart sign. Crisis diagram symbol. Line decreasing graph icon. Various designs. Vector. Line decrease vectors Decreasing graph line icon. Crisis chart sign. Halftone dotted pattern. Vector. Decreasing graph line icon. Halftone dotted pattern. Gradient icon with grain shadow. Column chart sign. Crisis diagram symbol. Line decreasing graph icon. Various designs. Vector