Free with trial Stock Market icon vector image. Suitable for mobile application web application and print media. Line decrease vectors Stock Market icon vector image.
Free with trial Financial crisis, economic downturn, stock market crash, recession, decreasing profits, falling revenue, business loss, investment loss, financial instability, economic decline, money loss. Line decrease vectors Falling Stock Market Graph Showing Financial Crisis and Recession. Financial crisis, economic downturn, stock market crash, recession, decreasing profits, falling revenue, business loss, investment loss, financial instability, economic decline, money loss.
Free with trial Stock market chart showing a downward trend with red and green candlesticks indicating price fluctuations. A moving average line overlays the candlesticks. Volume bars at the bottom correlate with trading activity, mostly red, suggesting higher selling pressure. Vertical axis shows price levels, and horizontal axis depicts time. The chart originates from Cendlewe (Bearits). Candlestick shapes and colors represent price movements over time, with red indicating a decrease and green an increase. Line decrease illustrations Dynamic stock market chart shows downward trend with red and green candlesticks and volume bars. Stock market chart showing a downward trend with red and green. Stock market chart showing a downward trend with red and green candlesticks indicating price fluctuations. A moving average line overlays the candlesticks. Volume bars at the bottom correlate with trading activity, mostly red, suggesting higher selling pressure. Vertical axis shows price levels, and horizontal axis depicts time. The chart originates from Cendlewe (Bearits). Candlestick shapes and colors represent price movements over time, with red indicating a decrease and green an increase.
Free with trial Zoom out icon design in filled and outlined style. Line decrease vectors Zoom out icon Thin line art isolated. Zoom out icon design in filled and outlined style
Free with trial Zoom out icon design in filled and outlined style. Line decrease vectors Zoom out icon Thin line art isolated. Zoom out icon design in filled and outlined style
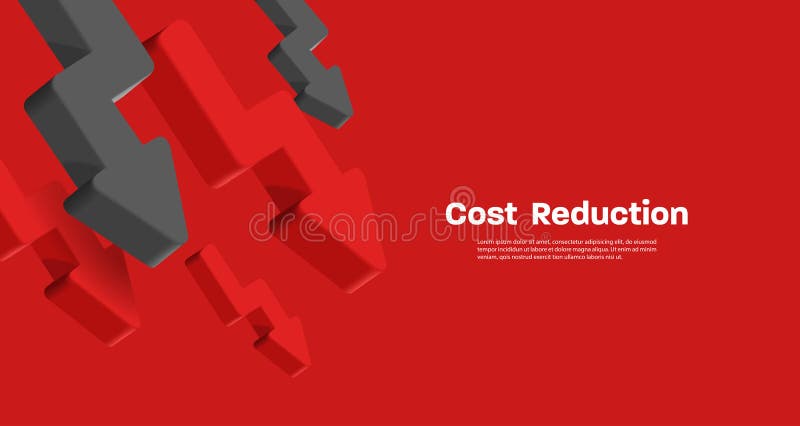
Free with trial A glossy red 3D arrow charts a jagged downward path, symbolizing economic crisis, stock market crash, or business failure against a dark, minimalist background. Line decrease illustrations Glossy Red Jagged Arrow Charting a Steep Financial Decline. A glossy red 3D arrow charts a jagged downward path, symbolizing economic crisis, stock market crash, or business failure against a dark, minimalist background.
Free with trial A simple black and white illustration of a downward trend graph, showing a decline. The graph is hand-drawn. Line decrease illustrations Hand-drawn Black Downward Trend Graph on White Background. A simple black and white illustration of a downward trend graph, showing a decline. The graph is hand-drawn
Free with trial Three speech bubbles in turquoise and purple display symbols: a question mark, "Q," and "A," signifying questions and answers. To the right, four red arrows with white percentage symbols point downward, suggesting a decrease in percentage. The background is light purple, creating a soft contrast with the vibrant elements. Line decrease illustrations Question and answer symbols with downward percentage arrows. Three speech bubbles in turquoise and purple display symbols: a question mark, "Q," and "A," signifying questions and answers. To the right, four red arrows with white percentage symbols point downward, suggesting a decrease in percentage. The background is light purple, creating a soft contrast with the vibrant elements.
Free with trial This 3D rendering shows a bar graph with a sharp downward trend, symbolized by a large red arrow. The graph visually represents a significant decline or decrease in a particular metric. The dark red bars and bright red arrow create a strong visual impact. Line decrease illustrations Declining Bar Graph. This 3D rendering shows a bar graph with a sharp downward trend, symbolized by a large red arrow. The graph visually represents a significant decline or decrease in a particular metric. The dark red bars and bright red arrow create a strong visual impact.
Free with trial Three black arrow shapes progressively decrease in size, pointing left. The largest arrow is on the left, with two smaller arrows nested inside it, creating a layered effect. Each arrow has a sharp, triangular design, giving a dynamic appearance. The design is set against a plain white background, emphasizing the bold, abstract geometric form. Line decrease illustrations Triple bullet arrow. Three black arrow shapes progressively decrease in size, pointing left. The largest arrow is on the left, with two smaller arrows nested inside it, creating a layered effect. Each arrow has a sharp, triangular design, giving a dynamic appearance. The design is set against a plain white background, emphasizing the bold, abstract geometric form.
Free with trial Domino Effect icon vector image. Suitable for mobile application web application and print media. Line decrease vectors Domino Effect icon vector image.
Free with trial A vibrant 3D rendered image featuring a large, stylized arrow pointing downwards, outlined with bright blue and pink neon lights. The arrow stands on a dark, textured floor, from which glowing parallel lines of similar neon hues extend into the distance, creating a sense of depth and direction. This modern and futuristic graphic is ideal for concepts related to download, direction, data flow, decline, or digital navigation. Generated by AI. Line decrease illustrations Neon Down Arrow and Glowing Lines on Dark Textured Surface. A vibrant 3D rendered image featuring a large, stylized arrow pointing downwards, outlined with bright blue and pink neon lights. The arrow stands on a dark, textured floor, from which glowing parallel lines of similar neon hues extend into the distance, creating a sense of depth and direction. This modern and futuristic graphic is ideal for concepts related to download, direction, data flow, decline, or digital navigation. Generated by AI
Free with trial Red arrow graph depicts a stock market decline, moving downward with sharp angles against a white background. The thick arrow starts at the top left, zigzagging before terminating at the bottom right. Red color symbolizes economic downturn or decrease in financial value. Simple, stark design emphasizes decline theme commonly used in financial visuals to depict negative market trends or financial losses. Line decrease illustrations Red Downward Arrow Graph: Stock Market Decline Illustration. Red arrow graph depicts a stock market decline, moving downward with sharp angles against a white background. The thick arrow starts at the top left, zigzagging before terminating at the bottom right. Red color symbolizes economic downturn or decrease in financial value. Simple, stark design emphasizes decline theme commonly used in financial visuals to depict negative market trends or financial losses.
Free with trial Decreasing bar chart icon in generic design. Market crash sign symbol illustration. Line decrease vectors Decreasing bar chart icon in generic design. Market crash sign symbol
Free with trial A businessman in a suit draws a red downward trend line, symbolizing financial loss or economic downturn. The image conveys concepts of business, finance, and market volatility. The lighting is soft, and the composition focuses on the hand and graph. Line decrease illustrations Businessman\'s Hand Drawing Red Downward Graph, Economic Decline Concept. A businessman in a suit draws a red downward trend line, symbolizing financial loss or economic downturn. The image conveys concepts of business, finance, and market volatility. The lighting is soft, and the composition focuses on the hand and graph
Free with trial Percentage arrow up and down glyph icon with percent sign. Represents financial growth, decline, interest rates, banking, credit, investment, and economic trends. Line decrease vectors Percentage arrow up and down glyph Icon set.Vector illustration. Percentage arrow up and down glyph icon with percent sign. Represents financial growth, decline, interest rates, banking, credit, investment, and economic trends
Free with trial A red arrow with a percentage sign points downwards towards rocky ground against a muted background, conveying decline. Image. Line decrease illustrations Red Downward Arrow with Percentage Symbol Over Rocky Ground. A red arrow with a percentage sign points downwards towards rocky ground against a muted background, conveying decline. Image
Free with trial Concrete percentage symbol with arrow pointing down, atop a pile of rocks, against a cloudy sky. Muted, desaturated colors. Image. Line decrease illustrations Concrete Percentage Symbol with Downward Arrow on Rock Pile. Concrete percentage symbol with arrow pointing down, atop a pile of rocks, against a cloudy sky. Muted, desaturated colors. Image
Free with trial A 3D rendering showcases a sharply declining stock market graph, with a large red arrow dramatically emphasizing the downturn. The image visually represents a significant financial crisis or market collapse. Line decrease illustrations Dramatic Stock Market Crash: Red Arrow Plunges Through Chart. A 3D rendering showcases a sharply declining stock market graph, with a large red arrow dramatically emphasizing the downturn. The image visually represents a significant financial crisis or market collapse.
Free with trial A downward trending graph chart isolated on a white background, perfect for financial analysis. Line decrease illustrations Downward graph chart. A downward trending graph chart isolated on a white background, perfect for financial analysis
Free with trial Halftone dotted gradient background featuring a smooth transition from dense black dots to lighter white areas. The dots decrease in size and density as they move from the bottom left to the top right, creating an optical illusion of depth and shading. This technique is often used in printing and graphic design to create texture and visual interest without using continuous tone. The pattern is reminiscent of early comic book printing styles and pop art. Line decrease illustrations Black and White Halftone Dotted Gradient Background Texture. Halftone dotted gradient background featuring a smooth transition from dense black dots to lighter white areas. The dots decrease in size and density as they move from the bottom left to the top right, creating an optical illusion of depth and shading. This technique is often used in printing and graphic design to create texture and visual interest without using continuous tone. The pattern is reminiscent of early comic book printing styles and pop art.
Free with trial Low water sign. Drop with down arrow. Vector illustration. EPS 10. Stock image. Line decrease vectors Low water sign. Drop with down arrow. Vector illustration. EPS 10.
Free with trial Set of economic crisis icons. Thin linear style icons Pack. Vector Illustration Outline icons collection. Line decrease vectors Set of economic crisis icons. Thin linear style icons Pack. Vector Illustration
Free with trial Up and Down Arrow Set with Percentage for Business and Finance and Pictogram Element Vector Illustration Isolated on Transparent Background. Line decrease vectors Creative Percentage Up and Down Arrow Set Icon Clipart Vector Illustration. Up and Down Arrow Set with Percentage for Business and Finance and Pictogram Element Vector Illustration Isolated on Transparent Background
Free with trial Dollar price up and down outline icon. USD coin growth and decline sign symbol vector. Line decrease vectors Dollar price up and down outline icon. USD coin growth and decline sign symbol
Free with trial A whiteboard displays a hand-drawn graph depicting a sharp downward trend in a market or economic indicator. Red markers highlight significant drops, illustrating a period of substantial decline. The graph suggests a potential crisis or recession. Line decrease illustrations Declining Market Trend. A whiteboard displays a hand-drawn graph depicting a sharp downward trend in a market or economic indicator. Red markers highlight significant drops, illustrating a period of substantial decline. The graph suggests a potential crisis or recession.
Free with trial Growth and declining graph bar icon with flat rounded cartoon style. Charts with bar growth and declining. Graph trending upwards arrow and downwards arrow. Eps 10 vector illustration. Line decrease vectors Growth and declining graph bar icon with flat rounded cartoon style
Free with trial This dynamic 3D render visualizes financial growth and market trends. A series of green bars represents increasing values, overlaid by a prominent green arrow pointing upwards, symbolizing success and positive performance. Contrasting this, a red arrow also indicates a trend, though its path suggests volatility or a different metric. Below, a complex network graph with interconnected nodes and lines adds a layer of data analysis and interconnectedness, suitable for concepts like investment, analytics, and economic forecasting. Line decrease illustrations Upward Trend: Green and Red Arrows Over Bar Chart and Network Graph. This dynamic 3D render visualizes financial growth and market trends. A series of green bars represents increasing values, overlaid by a prominent green arrow pointing upwards, symbolizing success and positive performance. Contrasting this, a red arrow also indicates a trend, though its path suggests volatility or a different metric. Below, a complex network graph with interconnected nodes and lines adds a layer of data analysis and interconnectedness, suitable for concepts like investment, analytics, and economic forecasting.
Free with trial This image features a geometric spiral design composed of elliptical shapes that decrease towards the center. The structure is neatly confined within the boundaries of a square frame on white background. Line decrease illustrations Elegant black and white spiral shape inside of a square frame. This image features a geometric spiral design composed of elliptical shapes that decrease towards the center. The structure is neatly confined within the boundaries of a square frame on white background.
Free with trial Reduce carbon dioxide co2 icon vector logo set collection or bundle pack group. Line decrease vectors Reduce carbon dioxide co2 vector logo set collection for web app ui. Reduce carbon dioxide co2 icon vector logo set collection or bundle pack group
Free with trial Bitcoin chart icons set outline vector. Benefit fintech. Cash coin neon color on black. Line decrease vectors Bitcoin chart icons set vector neon. Bitcoin chart icons set outline vector. Benefit fintech. Cash coin neon color on black
Free with trial This icon represents the concept of compressing, condensing, or applying downward pressure. Line decrease illustrations Three arrows pointing down to three horizontal lines showing compressing concept. This icon represents the concept of compressing, condensing, or applying downward pressure
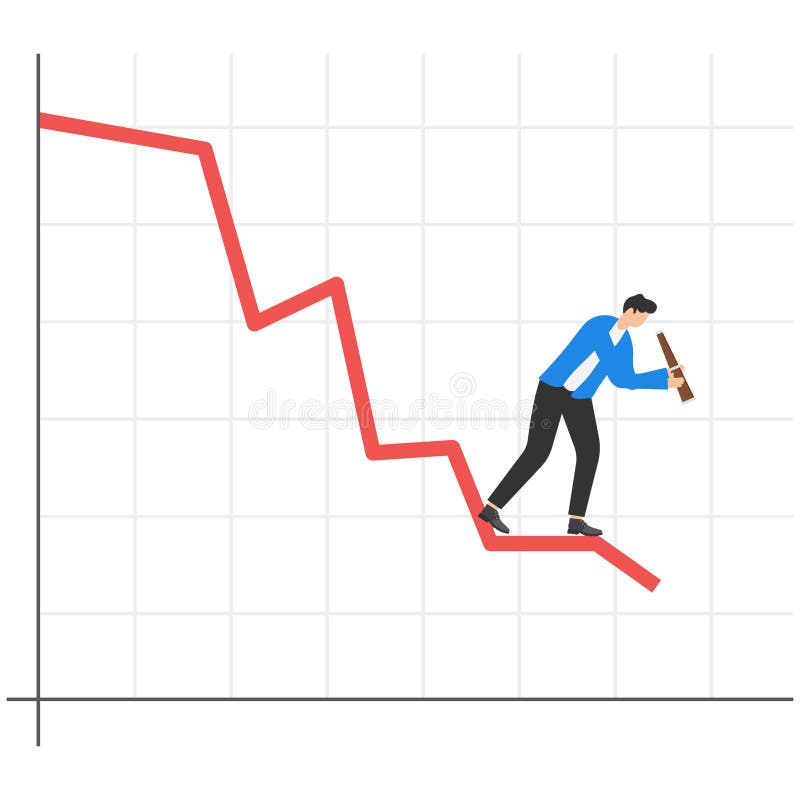
Free with trial Businessman standing on a falling down red graph looks for the bottom. Line decrease vectors Businessman standing on a falling down red graph looks for the bottom.
Free with trial The business concept of both crisis and recovery. Line decrease illustrations Business concept of both crisis and recovery
Free with trial A vibrant red arrow drawn with a dashed line and a solid tip, clearly indicating a downward trajectory or negative trend, perfect for financial or performance analysis. Line decrease illustrations Red arrow symbol pointing downward indicating decline or trend. A vibrant red arrow drawn with a dashed line and a solid tip, clearly indicating a downward trajectory or negative trend, perfect for financial or performance analysis
Free with trial Co2 gas carbon dioxide icon vector logo set collection or bundle pack group. Line decrease vectors Co2 gas carbon dioxide icon vector logo set collection for web app ui. co2 gas carbon dioxide icon vector logo set collection or bundle pack group
Free with trial This image features a simple, bold black down arrow icon, perfect for representing download, next, or other similar concepts. The design is clean and modern, ideal for websites and applications. Line decrease vectors Bold Black Down Arrow Icon: Simple and Effective Download Symbol. This image features a simple, bold black down arrow icon, perfect for representing download, next, or other similar concepts. The design is clean and modern, ideal for websites and applications.
Free with trial This 3D illustration shows a colorful bar graph with pastel-colored cylinders on a white circular base, representing upward business growth trends. The chart includes a line graph illustrating various data points. Line decrease illustrations 3D Colorful Cylindrical Bar Graph Chart Showing Business Growth. This 3D illustration shows a colorful bar graph with pastel-colored cylinders on a white circular base, representing upward business growth trends. The chart includes a line graph illustrating various data points.
Free with trial A set of twelve minimalist data visualization icons, featuring charts, graphs, and other data-related symbols. Perfect for presentations, reports, and dashboards, showcasing data analysis and growth trends. The clean design ensures readability and professional appeal. Line decrease illustrations Data Visualization Icons
Free with trial Cost reduction icon. Vector symbol image isolated on white background. Line decrease vectors Cost reduction icon. Vector symbol image isolated on white background
Free with trial CO2 CO2 emissions in cloud. Carbon neutral concept. Vector illustration. Line decrease vectors Carbon Dioxide Pollution. CO2 with Cloud Emission Gas Icon. illustration. CO2 CO2 emissions in cloud. Carbon neutral concept. Vector illustration
Free with trial Abstract digital illustration depicting two contrasting glowing line graphs. A vibrant blue/cyan line trends steeply upwards with an arrow, while a bright red line trends downwards with its arrow, crossing over the blue line mid-way. Subtle dotted lines and sparkling light effects add detail against the dark, moody background. This dynamic image conveys energy and volatility, suitable for representing concepts like market fluctuations, contrasting financial trends (growth vs. decline), stock market analysis, competition, data comparison, economic divergence, risk assessment, and critical crossover points. Ideal for financial reports, articles on market volatility, illustrating competitive analysis, or business strategy presentations. Line decrease illustrations Contrasting red downward and blue upward glowing graph arrows crossing. Abstract digital illustration depicting two contrasting glowing line graphs. A vibrant blue/cyan line trends steeply upwards with an arrow, while a bright red line trends downwards with its arrow, crossing over the blue line mid-way. Subtle dotted lines and sparkling light effects add detail against the dark, moody background. This dynamic image conveys energy and volatility, suitable for representing concepts like market fluctuations, contrasting financial trends (growth vs. decline), stock market analysis, competition, data comparison, economic divergence, risk assessment, and critical crossover points. Ideal for financial reports, articles on market volatility, illustrating competitive analysis, or business strategy presentations.
Free with trial Image depicting a satisfaction dip alert with a warning sign and a chart showing a decline in satisfaction levels. Line decrease vectors Satisfaction Dip Alert - Warning Sign and Chart Illustrating Decline. Image depicting a satisfaction dip alert with a warning sign and a chart showing a decline in satisfaction levels
Free with trial Financial concept image featuring a blue bar chart with a red downward arrow, illustrating decline, recession, or loss over time. Ideal for presentations, reports, infographics, economic forecasts, and business documentation. Clean, clear, and professional visual, created ai. Line decrease illustrations Business bar chart showing financial decline with downward arrow. Financial concept image featuring a blue bar chart with a red downward arrow, illustrating decline, recession, or loss over time. Ideal for presentations, reports, infographics, economic forecasts, and business documentation. Clean, clear, and professional visual, created ai.
Free with trial Vibrant 3D render of a glowing neon blue gauge with up and down arrows on a bright green background. Symbolizing progress, change, data, or status measurement. Line decrease illustrations Glowing Neon Blue Gauge with Up and Down Arrows on Vibrant Green. Vibrant 3D render of a glowing neon blue gauge with up and down arrows on a bright green background. Symbolizing progress, change, data, or status measurement
Free with trial Hand drawn minus sign icon in a purple circle vector illustration. Line decrease vectors Hand drawn minus sign icon in a purple circle vector illustration
Free with trial Simple download arrow button icon design, perfect for website, app, or interface design. The clean lines and modern aesthetic make this icon versatile and easily adaptable to various styles. Line decrease vectors Download Button Icon: Simple, Clean, and Modern Design. Simple download arrow button icon design, perfect for website, app, or interface design. The clean lines and modern aesthetic make this icon versatile and easily adaptable to various styles.
Free with trial This image showcases a geometric spiral pattern, featuring concentric rings that decrease in size towards the center. Each ring has a jagged outline filled with shaded lines, offering a dynamic abstract design. Line decrease illustrations Geometric Spiral Pattern with Shaded Lines on a White Background. This image showcases a geometric spiral pattern, featuring concentric rings that decrease in size towards the center. Each ring has a jagged outline filled with shaded lines, offering a dynamic abstract design.
Free with trial Business banner red, decreasing pointing down red and black arrows business composition on red backdrop banner. Line decrease vectors Business banner red, decreasing pointing down red and black arrows business composition
Free with trial Downward line graph with data points, sad orange face symbolizing negativity, and a robot suggesting AI involvement or automation. Ideal for business, AI, automation, data analysis, technology. Line decrease vectors Declining Chart with Robot and Sad Face Indicating Negative Trends and AI Interaction. Downward line graph with data points, sad orange face symbolizing negativity, and a robot suggesting AI involvement or automation. Ideal for business, AI, automation, data analysis, technology
Free with trial The image showcases a high-speed train in motion, traversing a railway track. The train is sleek and modern in design, with warm, golden light emanating from its windows, possibly reflecting the setting sun. The background features a dramatic sunset with vibrant orange and yellow hues in the clouds. Lush green trees line the railway on either side. The overall composition emphasizes dynamic motion and a sense of journey, with warm lighting creating a dramatic and hopeful atmosphere. The focus is sharp on the train, with a gradual decrease in sharpness toward the background, enhancing depth of field. The color palette is rich and saturated, employing a contrast between the warm sunset tones and the cooler tones of the train and foliage. Line decrease illustrations High-Speed Train at Sunset. The image showcases a high-speed train in motion, traversing a railway track. The train is sleek and modern in design, with warm, golden light emanating from its windows, possibly reflecting the setting sun. The background features a dramatic sunset with vibrant orange and yellow hues in the clouds. Lush green trees line the railway on either side. The overall composition emphasizes dynamic motion and a sense of journey, with warm lighting creating a dramatic and hopeful atmosphere. The focus is sharp on the train, with a gradual decrease in sharpness toward the background, enhancing depth of field. The color palette is rich and saturated, employing a contrast between the warm sunset tones and the cooler tones of the train and foliage.
Free with trial Costs optimization Icon logo sign vector outline in black and white color. Line decrease vectors Costs optimization icon symbol set collection. Costs optimization simple vector sign bundle. Costs optimization Icon logo sign vector outline in black and white color
Free with trial A striking, minimalist graphic conveying a message of price reduction or a sale. The design features the 3D text "PRICE" in bold, red and pink shades, dramatically positioned above three large, downward-pointing red arrows. The clean, isometric style and high-contrast color palette make this a highly effective visual metaphor for falling prices, perfect for web banners, promotional posters, advertising campaigns, and social media posts related to discounts, sales, and low cost events like Black Friday or clearance. Line decrease illustrations Price Reduction Graphic with Bold 3D Text and Downward Red Arrows. A striking, minimalist graphic conveying a message of price reduction or a sale. The design features the 3D text "PRICE" in bold, red and pink shades, dramatically positioned above three large, downward-pointing red arrows. The clean, isometric style and high-contrast color palette make this a highly effective visual metaphor for falling prices, perfect for web banners, promotional posters, advertising campaigns, and social media posts related to discounts, sales, and low cost events like Black Friday or clearance.
Free with trial Icons depicting concepts such as carbon dioxide emission, reducing co2 footprint and fighting climate change. Line decrease vectors Carbon dioxide emission reduction reducing co2 footprint climate change icons. Icons depicting concepts such as carbon dioxide emission, reducing co2 footprint and fighting climate change
Free with trial Red glowing arrow made of light and sparks indicates a downward trend. Financial graph showing fall in market value or business decline concept. Line decrease illustrations Red glowing arrow made of light and sparks indicates a downward trend
Free with trial Coins scatter beneath a downward blue arrow meeting an upward black arrow. Ideal for themes of finance, growth, investment, direction, currency, progress, success. Line metaphor. Line decrease vectors Financial Growth Concept with Coins, Arrows, and Blue Indicator for Business Success. Coins scatter beneath a downward blue arrow meeting an upward black arrow. Ideal for themes of finance, growth, investment, direction, currency, progress, success. Line metaphor
Free with trial Reduce Business Risk icon vector image. Suitable for mobile application web application and print media. Line decrease vectors Reduce Business Risk icon vector image.
Free with trial Negative Black Solid Box Minus Less Dash Zoom Out Scale Down Subtract Math Remove Reduce Minimize Cancel Delete Vector Graphic Icon Sign Symbol Artwork. Line decrease vectors Negative Black Solid Box Minus Less Dash Zoom Out Scale Down Subtract Math Remove Reduce Minimize Cancel Delete Vector Graphic
Free with trial Bar graph consisting of rectangular blocks in different colors: blue, green, yellow, orange, purple, and pink, decreasing in height. Overlaying the graph is a bold, zigzagging red arrow pointing downward, representing a declining trend. The red arrow contrasts sharply with the pastel-colored bars, emphasizing a negative change or trend. Set against a white background for clarity and focus. Line decrease illustrations Declining Trends: A Bar Graph with a Downward Red Arrow. Generative AI. Bar graph consisting of rectangular blocks in different colors: blue, green, yellow, orange, purple, and pink, decreasing in height. Overlaying the graph is a bold, zigzagging red arrow pointing downward, representing a declining trend. The red arrow contrasts sharply with the pastel-colored bars, emphasizing a negative change or trend. Set against a white background for clarity and focus.
Free with trial This graphic depicts data insights through a visually appealing bar chart connected by flowing lines, symbolizing the interconnectedness of data points and the flow of information. The varying heights of the bars represent different data values, showcasing growth or trends. The design is clean and. Line decrease illustrations Data Insights Visualization. This graphic depicts data insights through a visually appealing bar chart connected by flowing lines, symbolizing the interconnectedness of data points and the flow of information. The varying heights of the bars represent different data values, showcasing growth or trends. The design is clean and
Free with trial Hand drawn minus sign in circle sketch illustration negative symbol. Line decrease vectors Hand drawn minus sign in circle sketch illustration negative symbol
Free with trial Smartphone is showing a percentage symbol with a downward arrow, indicating a drop in price for online shopping or cashback. Line decrease illustrations Smartphone showing percentage symbol with downward arrow indicating price drop. Smartphone is showing a percentage symbol with a downward arrow, indicating a drop in price for online shopping or cashback
Free with trial 3D illustration depicts a negative financial trend, with a descending red graph overlaid on stacks of gold coins and a burlap money sack containing a dollar symbol. The image represents a concept of financial loss, decline, or recession. Line decrease illustrations A depiction of financial downturn, illustrated by a descending red graph line above stacks of golden coins and a burlap money bag. 3D illustration depicts a negative financial trend, with a descending red graph overlaid on stacks of gold coins and a burlap money sack containing a dollar symbol. The image represents a concept of financial loss, decline, or recession
Free with trial A collection of minimalist outline icons representing finance and business data charts, symbols, and indicators for graphic design and web development. Line decrease vectors Minimalist Outline Finance and Business Data Chart Symbol Icon Set. A collection of minimalist outline icons representing finance and business data charts, symbols, and indicators for graphic design and web development.
Free with trial Percentage growth and decline icons. Percent arrow up and down flat style symbols - vector. Vector illustration. Line decrease vectors Percentage growth and decline icons. Percent arrow up and down flat style symbols - vector
Free with trial Plus and minus symbol with green and red glowing neon lighting on dark purple background, 3d render. Line decrease illustrations Plus and minus symbol with green and red glowing neon lighting, 3d render. Plus and minus symbol with green and red glowing neon lighting on dark purple background, 3d render.
Free with trial Large pie chart alongside heart and drooping plant with dashed line. Ideal for data analysis, loss, emotional impact, decline, sustainability, environmental issues, simple flat metaphor. Line decrease vectors Pie Chart with Heart Symbol and Wilting Plant Representing Decline and Emotional Impact. Large pie chart alongside heart and drooping plant with dashed line. Ideal for data analysis, loss, emotional impact, decline, sustainability, environmental issues, simple flat metaphor
Free with trial High and Low Percent arrow vector icon set on white background. eps10. Line decrease vectors High and Low Percent arrow icon. High and Low Percent arrow vector icon set on white background. eps10
Free with trial Yellow Circle with a Minus Sign Represents Reduction Subtraction Icon. Line decrease vectors Yellow Circle with a Minus Sign Represents Reduction Subtraction Icon
Free with trial A set of six black outline icons depicting magnifying glasses, graphs, a computer monitor displaying a waveform, and network connections. Line decrease vectors Magnifying glass and data analysis icons with graphs and monitor search. A set of six black outline icons depicting magnifying glasses, graphs, a computer monitor displaying a waveform, and network connections
Free with trial A straightforward black and white vector design showcasing its simplicity with clear-cut lines and a captivating interplay of contrasting colors - Artificial intelligence crafted illustration. Line decrease vectors Fall - black and white isolated icon - vector illustration. A straightforward black and white vector design showcasing its simplicity with clear-cut lines and a captivating interplay of contrasting colors - Artificial intelligence crafted illustration
Free with trial Isolated illustration of a person with a hoodie and line graph. Perfect for business and investment concepts. Line decrease vectors Person with Graph in Hoodie Cartoon - Business, Growth, Investment, Trends. Isolated illustration of a person with a hoodie and line graph. Perfect for business and investment concepts.
Free with trial Red oval cartoon button with a minus sign for subtraction or removal. Line decrease vectors Red oval cartoon button with a minus sign for subtraction or removal
Free with trial Percent growth and decline outline icon in rounded corner. Percentage arrow up and down sign symbol vector. Line decrease vectors Percent growth and decline outline icon in rounded corner. Percentage arrow up and down sign symbol
Free with trial Growth vector icon. Graph or diagram with arrow going up and down. Vector illustration. Line decrease vectors Growth vector icon. Graph or diagram with arrow going up and down. Vector
Free with trial A hand-drawn style graph illustrates a concept with fluctuating bars and a descending arrow, indicating decline and progress, perfect for business presentations. Line decrease illustrations Hand-drawn sketch illustrates decline and progress with chart and arrow. A hand-drawn style graph illustrates a concept with fluctuating bars and a descending arrow, indicating decline and progress, perfect for business presentations
Free with trial Simple bar graph showing downward trend with arrow, decline in progress. Line decrease vectors Simple bar graph showing downward trend with arrow, decline in progress
Free with trial A hand holding a pen points at a red, downward-trending line graph, symbolizing a financial market decline. The background features a digital display of stock market data, highlighting the negative trend. The lighting and composition emphasize the concept of financial loss. Line decrease illustrations Stock Market Downturn: Hand with Pen Pointing at Red Declining Graph. A hand holding a pen points at a red, downward-trending line graph, symbolizing a financial market decline. The background features a digital display of stock market data, highlighting the negative trend. The lighting and composition emphasize the concept of financial loss
Free with trial Arrow down and up percent outline icon vector. Percentage downward and upward arrows sign. Editable stroke. Line decrease vectors Arrow down and up percent outline icon. Percentage downward and upward arrows sign. Editable stroke
Free with trial Flat Design Illustration Financial Debt Penalties and Time Constraints. Line decrease vectors Flat Design Illustration Financial Debt Penalties and Time Constraints