Free with trial Line graph of income growth, timeline, arrows indicate the direction of the graph, vector, black background. Line financial growth decrease illustrations Line graph of income growth, timeline, arrows indicate the direction of the graph, vector
Free with trial Line graph of income growth, timeline, arrows indicate the direction of the graph, vector, white background. Line financial growth decrease illustrations Line graph of income growth, timeline, arrows indicate the direction of the graph, vector
Free with trial Line graph of income growth, timeline, arrows indicate the direction of the graph, vector, white background. Line financial growth decrease illustrations Line graph of income growth, timeline, arrows indicate the direction of the graph, vector
Free with trial Line graph of income growth, timeline, arrows indicate the direction of the graph, vector, black background. Line financial growth decrease illustrations Line graph of income growth, timeline, arrows indicate the direction of the graph, vector
Free with trial Line graph of income growth, timeline, arrows indicate the direction of the graph, vector, white background. Line financial growth decrease illustrations Line graph of income growth, timeline, arrows indicate the direction of the graph, vector
Free with trial Set Abstract graph line go up and down. concept of business growth or lower. Modern design graphics on dark background. Vector illustration. Line financial growth decrease vectors Set Abstract graph line go up and down. concept of business growth or lower.
Free with trial Decrease line icons, signs, vector set, outline concept illustration. Line financial growth decrease vectors Decrease line icons, signs, vector set, outline illustration concept. Decrease line icons, signs, vector set, outline concept illustration
Free with trial Decrease line icons, linear signs, vector set, outline concept illustration. Line financial growth decrease vectors Decrease line icons, signs, vector set, outline illustration concept. Decrease line icons, linear signs, vector set, outline concept illustration
Free with trial Linear decrease icon from Ecommerce and payment outline collection. Thin line decrease vector isolated on white background. decrease trendy illustration. Line financial growth decrease vectors Linear decrease icon from Ecommerce and payment outline collection. Thin line decrease vector isolated on white background.
Free with trial A modern flat design icon representing financial data analysis and market trends. This vector illustration features a combination of a green bar chart and a dark grey line graph, showing fluctuations in performance. An upward arrow indicates initial growth, followed by a volatile trend line symbolizing concepts like market instability, economic changes, profit and loss, or business analytics. This versatile graphic is perfect for infographics, financial reports, presentations, websites, and applications related to business, finance, statistics, and economics. Isolated on a white background for easy use. Line financial growth decrease vectors Financial Market Fluctuation Graph Icon. A modern flat design icon representing financial data analysis and market trends. This vector illustration features a combination of a green bar chart and a dark grey line graph, showing fluctuations in performance. An upward arrow indicates initial growth, followed by a volatile trend line symbolizing concepts like market instability, economic changes, profit and loss, or business analytics. This versatile graphic is perfect for infographics, financial reports, presentations, websites, and applications related to business, finance, statistics, and economics. Isolated on a white background for easy use.
Free with trial Multiple line charts showing data trends over months on a grid background. Concept of data analysis and financial growth. 3D Rendering. Line financial growth decrease illustrations Multiple line charts showing data trends over months on grid background. 3D Rendering. Multiple line charts showing data trends over months on a grid background. Concept of data analysis and financial growth. 3D Rendering
Free with trial Economic crisis line icons of global financial downturn and business bankruptcy, vector banner. Money loss and banking crisis icons of depreciation, unemployment and price decrease of pandemic crisis. Line financial growth decrease vectors Economic crisis icons of global financial downturn. Economic crisis line icons of global financial downturn and business bankruptcy, vector banner. Money loss and banking crisis icons of depreciation, unemployment and price decrease of pandemic crisis
Free with trial Decrease icon vector from sales concept. Thin line illustration of decrease editable stroke. decrease linear sign for use on web and mobile apps, logo, print media. Line financial growth decrease vectors Decrease icon vector from sales concept. Thin line illustration of decrease editable stroke. decrease linear sign for use on web
Free with trial Abstract digital illustration of a financial chart. A glowing white line graph rises and falls against a blue background with a grid pattern made of dots. The image conveys concepts of market trends, stock analysis, investment, and economic fluctuations. Suitable for illustrating financial reports, business presentations, and technology-related articles. Line financial growth decrease illustrations Abstract Financial Chart with Glowing Line. Abstract digital illustration of a financial chart. A glowing white line graph rises and falls against a blue background with a grid pattern made of dots. The image conveys concepts of market trends, stock analysis, investment, and economic fluctuations. Suitable for illustrating financial reports, business presentations, and technology-related articles.
Free with trial Percentage arrow up and down icon. Percent line icon. Price increase, decrease. Business simple symbol. Vector illustration isolated on white background. Editable stroke. Line financial growth decrease vectors Percentage arrow up and down icon. Percent line icon. Price increase, decrease. Business simple symbol. Vector
Free with trial Percentage arrow up and down icon. Percent line icon. Price increase, decrease. Business simple symbol. Vector illustration isolated on white background. Editable stroke. Line financial growth decrease vectors Percentage arrow up and down icon. Percent line icon. Price increase, decrease. Business simple symbol. Vector
Free with trial Dollar arrow up and down icon on circle line. USD growth and decline concept vector. Line financial growth decrease vectors Dollar arrow up and down icon on circle line. USD growth and decline concept
Free with trial Collection Abstract graph line moving up and down. concept of business growth or lower. Modern design graphics on white and dark background. Vector illustration. Line financial growth decrease vectors Collection Abstract graph line moving up and down. concept of business growth or lower.
Free with trial A collection of financial chart icons, showcasing data analysis and business growth concepts. The image features multiple variations of a line graph and bar chart combination, presented in both grayscale and beige color schemes. These icons are ideal for illustrating financial reports, business presentations, market trends, and data visualization projects. The clean, modern design makes them suitable for a wide range of applications. Line financial growth decrease vectors Financial Chart Icons: Business and Data Analysis. A collection of financial chart icons, showcasing data analysis and business growth concepts. The image features multiple variations of a line graph and bar chart combination, presented in both grayscale and beige color schemes. These icons are ideal for illustrating financial reports, business presentations, market trends, and data visualization projects. The clean, modern design makes them suitable for a wide range of applications.
Free with trial Decrease icon vector from sales concept. Thin line illustration of decrease editable stroke. decrease linear sign for use on web and mobile apps, logo, print media. Line financial growth decrease vectors Decrease icon vector from sales concept. Thin line illustration of decrease editable stroke. decrease linear sign for use on web
Free with trial A vector illustration showing a magnifying glass focused on a bar graph and line chart indicating growth. The magnifying glass has a blue frame and red handle. The chart depicts an upward trend, suggesting positive business performance. This image is suitable for illustrating data analysis, business strategy, market research, and financial growth concepts. Line financial growth decrease vectors Analyzing Growth: Magnifying Glass on Business Chart. A vector illustration showing a magnifying glass focused on a bar graph and line chart indicating growth. The magnifying glass has a blue frame and red handle. The chart depicts an upward trend, suggesting positive business performance. This image is suitable for illustrating data analysis, business strategy, market research, and financial growth concepts.
Free with trial A vibrant, modern icon depicting a financial growth chart, representing investment and market analysis. The design features ascending lines and bars, suggesting positive trends. This graphic was generated by AI for illustrative purposes. A representation of financial success. Line financial growth decrease illustrations Financial Growth Chart Icon - Business Investment Concept. A vibrant, modern icon depicting a financial growth chart, representing investment and market analysis. The design features ascending lines and bars, suggesting positive trends. This graphic was generated by AI for illustrative purposes. A representation of financial success.
Free with trial A collection of eight black and white, hand-drawn or doodle style icons. Each square icon features a different line graph, representing data, analytics, statistics, or financial trends. Line financial growth decrease illustrations Set of hand drawn financial chart line graph icons isolated on white. A collection of eight black and white, hand-drawn or doodle style icons. Each square icon features a different line graph, representing data, analytics, statistics, or financial trends
Free with trial A collection of eight black and white, hand-drawn or doodle style icons. Each square icon features a different line graph, representing data, analytics, statistics, or financial trends. Line financial growth decrease illustrations Set of hand drawn financial chart line graph icons isolated on white. A collection of eight black and white, hand-drawn or doodle style icons. Each square icon features a different line graph, representing data, analytics, statistics, or financial trends
Free with trial Money cash, coin business doodle icon set. Dollar coin, money profit doodle line sketch business inflation, cash payment. Financial profit, growth icon. Outline editable stroke. Vector illustration. Line financial growth decrease vectors Money cash, coin business doodle icon set. Dollar coin, money profit doodle line sketch business inflation, cash payment
Free with trial Sales line icons. linear set. quality vector line set such as online sales, decrease, sale. Line financial growth decrease vectors Sales line icons. linear set. quality vector line set such as online sales, decrease, sale
Free with trial Minimal set of Graph phone, Donation and Growth chart line icons. Phone screen, Quote banners. Business vision icons. For web development. Mobile statistics, Fundraising, Sale diagram. Vector. Line financial growth decrease vectors Minimal set of Graph phone, Donation and Growth chart line icons. For web development. Vector. Minimal set of Graph phone, Donation and Growth chart line icons. Phone screen, Quote banners. Business vision icons. For web development. Mobile statistics, Fundraising, Sale diagram. Vector
Free with trial Red Line Graph Showing Growth and Fluctuation on White Grid Paper, generative Ai. Line financial growth decrease illustrations Red Line Graph Showing Growth and Fluctuation on White Grid Paper
Free with trial Profit Icon Line Design Style Simple Business and Financial Vector Perfect Symbol. Line financial growth decrease vectors Profit Icon Line Design Style Simple Business and Financial Vector
Free with trial Growth and loss arrow icon on black circle. Increase and decrease sign symbol illustration. Line financial growth decrease vectors Growth and loss arrow icon on black circle. Increase and decrease sign symbol
Free with trial A clear flat vector icon representing a bar chart with a downward-pointing red arrow, symbolizing decline, loss, or negative growth. This design is useful for financial reports, risk analysis, or any situation indicating a decrease in performance or value. It communicates challenges, vector design Generative AI. Line financial growth decrease vectors Bar Chart Downtrend Icon, Decline, Loss, Negative Growth, Business, vector design Generative AI. A clear flat vector icon representing a bar chart with a downward-pointing red arrow, symbolizing decline, loss, or negative growth. This design is useful for financial reports, risk analysis, or any situation indicating a decrease in performance or value. It communicates challenges, vector design Generative AI
Free with trial This image features a striking red neon-style line graph on a black background, symbolizing decline, decrease, or downward trend in data visualization. Ideal for business, finance, and analytics concepts, it visually represents performance drops or negative growth in a modern, eye-catching manner. Line financial growth decrease illustrations Red Neon Declining Graph Line Icon for Business Data Visualization. This image features a striking red neon-style line graph on a black background, symbolizing decline, decrease, or downward trend in data visualization. Ideal for business, finance, and analytics concepts, it visually represents performance drops or negative growth in a modern, eye-catching manner.
Free with trial Dollar arrow up and down icon circle line. USD currency growth and decline sign symbol vector. Line financial growth decrease vectors Dollar arrow up and down icon circle line. USD currency growth and decline sign symbol
Free with trial Financial loss line icon, vector illustration, outline symbol, concept sign. Line financial growth decrease vectors Financial loss line icon, outline symbol, vector illustration, concept sign. financial loss line icon, vector illustration, outline symbol, concept sign
Free with trial Graph down icon. Growth stock diagram financial graph. Vector illustration. Stock image. EPS 10. Line financial growth decrease vectors Graph down icon. Growth stock diagram financial graph. Vector illustration. Stock image.
Free with trial Interest growth icon Black line art vector in black and white outline set collection sign. Line financial growth decrease vectors Financial Icon Illustrating Growth, Investment Success, and Economic Prosperity. Interest growth icon Black line art vector in black and white outline set collection sign
Free with trial Detailed 3D rendering of colorful bar charts, pie charts, line graphs, and calculator showcasing financial data analysis and business growth. Line financial growth decrease illustrations Colorful 3D Business Charts, Graphs, and Calculator for Financial Success. Detailed 3D rendering of colorful bar charts, pie charts, line graphs, and calculator showcasing financial data analysis and business growth.
Free with trial GDP Growth line icon. Universal creative premium symbol. Vector sign icon logo template. Vector illustration. Line financial growth decrease vectors GDP Growth line icon. Universal creative premium symbol. Vector sign icon logo template. Vector illustration
Free with trial Modern rendered line graph with yellow marker points rising and falling vertically, forming a white trend line that fluctuates across the screen. The graph represents business data such as growth, decrease, profit, and market performance. Set against a blurred office background, the image has a clean, digital aesthetic ideal for financial presentations, company reports, startup pitches, and data analysis. This visual is suitable for showcasing trading performance, corporate strategy, and economic trends. Line financial growth decrease illustrations Business Trend Line Graph Showing Growth and Market Fluctuations. Modern rendered line graph with yellow marker points rising and falling vertically, forming a white trend line that fluctuates across the screen. The graph represents business data such as growth, decrease, profit, and market performance. Set against a blurred office background, the image has a clean, digital aesthetic ideal for financial presentations, company reports, startup pitches, and data analysis. This visual is suitable for showcasing trading performance, corporate strategy, and economic trends.
Free with trial Finance, revenue reduction and financial benefit set. Design shape elements. Money line icons. Economy, money savings and increase profit line icons. Cash back, wallet and return finance. Vector. Line financial growth decrease illustrations Money line icons. Finance, revenue reduction and financial benefit. Design elements. Vector. Finance, revenue reduction and financial benefit set. Design shape elements. Money line icons. Economy, money savings and increase profit line icons. Cash back, wallet and return finance. Vector
Free with trial Line chart illustrating an upward trend, featuring candlestick patterns and glowing dots against a dark background. The arrangement indicates a positive movement in data, reflecting investment and financial growth. Blue and orange tones highlight data points and lines, providing a visual contrast that enhances readability. The abstract style conveys a modern financial theme, emphasizing success and progress in stock markets. Line financial growth decrease illustrations Dynamic stock market chart showing upward trend for investment and financial growth success concept. Line chart illustrating an upward trend, featuring. Line chart illustrating an upward trend, featuring candlestick patterns and glowing dots against a dark background. The arrangement indicates a positive movement in data, reflecting investment and financial growth. Blue and orange tones highlight data points and lines, providing a visual contrast that enhances readability. The abstract style conveys a modern financial theme, emphasizing success and progress in stock markets.
Free with trial Percentage arrow up and down line icon. Growth profit icon line icon. Finance interest rate sign business concept. Line financial growth decrease vectors Percentage arrow up and down line icon. Growth profit icon line icon. Finance interest rate sign business concept
Free with trial Dollar up and down icon on circle line. USD currency arrow increase and decrease sign symbol vector. Line financial growth decrease vectors Dollar up and down icon on circle line. USD currency arrow increase and decrease sign symbol
Free with trial A simple line drawing of a decreasing chart with an arrow pointing downwards, depicting negative growth or decline. Useful for presentations, infographics, and reports. Line financial growth decrease vectors Minimalist Line Style Decreasing Chart Arrow Down Financial Graphic Element. A simple line drawing of a decreasing chart with an arrow pointing downwards, depicting negative growth or decline. Useful for presentations, infographics, and reports.
Free with trial Percent growth and decline arrow icon vector. Increase and decrease percentage concept. Line financial growth decrease vectors Percent growth and decline arrow icon. Increase and decrease percentage concept
Free with trial Financial crisis, stock market crash, disappointed businessmen. market growth, happy investor standing near green growth trading arrow. crisis and marlet growth backgrounds. Line financial growth decrease vectors Financial crisis, stock market crash, disappointed businessmen. market growth, happy investor standing near green growth
Free with trial A grid of 16 black and white icons representing financial growth, currency, and directional arrows, isolated on a transparent background. Line financial growth decrease vectors Collection of financial and growth icons isolated on transparent background. A grid of 16 black and white icons representing financial growth, currency, and directional arrows, isolated on a transparent background
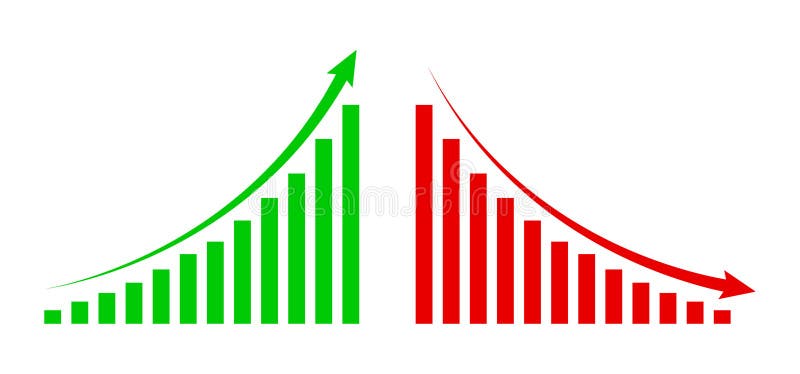
Free with trial Falling bar chart with a downward trending line and arrow indicating decrease. Line financial growth decrease vectors Falling bar chart with a downward trending line and arrow indicating decrease
Free with trial Graph going up and down sign financial arrows. chart increase, decrease sign with green and red arrows. vector graph with green and red arrows. Line financial growth decrease vectors Graph going up and down sign financial arrows. chart increase, decrease sign with green and red arrows. vector graph
Free with trial World stock market index fall. Financial crisis. Candlestick chart, line graph and bar chart. Stock market growth illustration. Financial market decrease background. Neon color. Vector illustration. Line financial growth decrease vectors Candlestick chart, line graph and bar chart. World stock market index fall. World stock market index fall. Financial crisis. Candlestick chart, line graph and bar chart. Stock market growth illustration. Financial market decrease background. Neon color. Vector illustration
Free with trial Percent growth decline arrow icon vector on black circle. Increase and decrease percentage sign symbol. Line financial growth decrease vectors Percent growth decline arrow icon on black circle. Increase and decrease percentage sign symbol
Free with trial High-detail image showing a dynamic orange graph line representing financial data trends and market fluctuations. Ideal for finance and business themes. Line financial growth decrease illustrations Dynamic Orange Graph Line Representing Financial Data Trends and Market Fluctuations
Free with trial Modern line icon of a percentage symbol inside a circular gauge for financial concepts. Line financial growth decrease vectors Modern line icon of a percentage symbol inside a circular gauge for financial concepts
Free with trial This 3D rendering showcases a vibrant bar chart illustrating business growth and financial performance. The colorful cylinders represent data points, rising to show increasing success. A line graph adds additional information about trends over time. Line financial growth decrease illustrations Colorful 3D Bar Chart with Growth Graph Showing Business Success and Financial Data. This 3D rendering showcases a vibrant bar chart illustrating business growth and financial performance. The colorful cylinders represent data points, rising to show increasing success. A line graph adds additional information about trends over time.
Free with trial A 3D illustration depicting financial growth. A line graph with blue and red data points ascends across a light blue background. Interspersed are green and red candlestick bars, representing market fluctuations. Stacks of gold coins and individual coins with dollar signs are arranged at the base of the chart, symbolizing wealth and investment. Line financial growth decrease illustrations 3D Financial Growth Chart with Stacks of Gold Coins and Candlestick Bars finance graph. A 3D illustration depicting financial growth. A line graph with blue and red data points ascends across a light blue background. Interspersed are green and red candlestick bars, representing market fluctuations. Stacks of gold coins and individual coins with dollar signs are arranged at the base of the chart, symbolizing wealth and investment
Free with trial Finance, revenue reduction and financial benefit set. Money line icons. Economy, money savings and increase profit line icons. Cash back, wallet and return finance. Inflation rising. Vector. Line financial growth decrease vectors Money line icons. Finance, revenue reduction and financial benefit. Vector. Finance, revenue reduction and financial benefit set. Money line icons. Economy, money savings and increase profit line icons. Cash back, wallet and return finance. Inflation rising. Vector
Free with trial Minimal set of Growth chart, Column diagram and Buying accessory line icons. Phone screen, Quote banners. Discounts cart icons. For web development. Vector. Line financial growth decrease vectors Minimal set of Growth chart, Column diagram and Buying accessory line icons. For web development. Vector. Minimal set of Growth chart, Column diagram and Buying accessory line icons. Phone screen, Quote banners. Discounts cart icons. For web development. Vector
Free with trial This vibrant image showcases a collection of colorful 3D charts and graphs, including bar graphs, pie charts, and a line graph, all illustrating positive growth. A calculator and pencil are included, emphasizing the analytical and planning aspects of business success. Perfect for illustrating finan. Line financial growth decrease illustrations Colorful 3D Financial Charts and Graphs with Calculator for Business Growth Presentation. This vibrant image showcases a collection of colorful 3D charts and graphs, including bar graphs, pie charts, and a line graph, all illustrating positive growth. A calculator and pencil are included, emphasizing the analytical and planning aspects of business success. Perfect for illustrating finan
Free with trial A stylized 3D business growth chart depicted against a light blue background. The chart features a blue mountain-like shape representing a peak, with two intersecting lines. One line, marked with pink nodes, shows fluctuations, while another line with green nodes indicates a general upward trend. This visual metaphor conveys concepts of business performance, market trends, and financial analysis. Line financial growth decrease illustrations 3D Stylized Business Growth Chart with Red and Green Nodes on Blue Background graph data. A stylized 3D business growth chart depicted against a light blue background. The chart features a blue mountain-like shape representing a peak, with two intersecting lines. One line, marked with pink nodes, shows fluctuations, while another line with green nodes indicates a general upward trend. This visual metaphor conveys concepts of business performance, market trends, and financial analysis
Free with trial Set of Finance icons, such as Analytics graph, Business growth, Money diagram symbols. Mobile screen app banners. Payment line icons. Chart report, Earnings results, Currency diagram. Finance. Vector. Line financial growth decrease vectors Set of Finance icons, such as Analytics graph, Business growth, Money diagram symbols. Payment line icons. Vector. Set of Finance icons, such as Analytics graph, Business growth, Money diagram symbols. Mobile screen app banners. Payment line icons. Chart report, Earnings results, Currency diagram. Finance. Vector
Free with trial Up and down dollar arrow icon on circle line. USD growth and decline sign symbol vector. Line financial growth decrease vectors Up and down dollar arrow icon on circle line. USD growth and decline sign symbol
Free with trial Dollar arrow growth and decline icon on circle line. USD up and down sign symbol vector. Line financial growth decrease vectors Dollar arrow growth and decline icon on circle line. USD up and down sign symbol
Free with trial Outline set of Credit card, Diagram chart and Financial app line icons for web application. Talk, information, delivery truck outline icon. Vector. Line financial growth decrease vectors Outline set of Credit card, Diagram chart and Financial app line icons for web application. For design. Vector. Outline set of Credit card, Diagram chart and Financial app line icons for web application. Talk, information, delivery truck outline icon. Vector
Free with trial Growth chart, Column diagram and Buying accessory minimal line icons. 3d spheres or balls buttons. Discounts cart icons. For web, application, printing. Vector. Line financial growth decrease illustrations Growth chart, Column diagram and Buying accessory minimal line icons. For web application, printing. Vector. Growth chart, Column diagram and Buying accessory minimal line icons. 3d spheres or balls buttons. Discounts cart icons. For web, application, printing. Vector
Free with trial Financial Capability Month Financial chart with 3d bar graph and line plot illustrating market trends. Line financial growth decrease illustrations Financial Capability Month Financial chart with 3d bar graph and line plot illustrating market trends
Free with trial Increase and decrease dollar arrow icon on circle line. USD up and down sign symbol vector. Line financial growth decrease vectors Increase and decrease dollar arrow icon on circle line. USD up and down sign symbol
Free with trial Percent growth decline arrow icon. Increase and decrease percentage sign symbol vector. Line financial growth decrease vectors Percent growth decline arrow icon. Increase and decrease percentage sign symbol
Free with trial Graph phone, Donation and Growth chart minimal line icons. 3d spheres or balls buttons. Business vision icons. For web, application, printing. Mobile statistics, Fundraising, Sale diagram. Vector. Line financial growth decrease vectors Graph phone, Donation and Growth chart minimal line icons. For web application, printing. Vector. Graph phone, Donation and Growth chart minimal line icons. 3d spheres or balls buttons. Business vision icons. For web, application, printing. Mobile statistics, Fundraising, Sale diagram. Vector
Free with trial Finance, revenue reduction and financial benefit set. Money line icons. Economy, money savings and increase profit line icons. Cash back, wallet and return finance. Inflation rising. Vector. Line financial growth decrease vectors Money line icons. Finance, revenue reduction and financial benefit. Vector. Finance, revenue reduction and financial benefit set. Money line icons. Economy, money savings and increase profit line icons. Cash back, wallet and return finance. Inflation rising. Vector
Free with trial Money line icons. Finance, revenue reduction and financial benefit set. Economy, money savings and increase profit line icons. Cash back, wallet and return finance. Inflation rising. Vector. Line financial growth decrease vectors Money line icons. Finance, revenue reduction and financial benefit. Vector. Money line icons. Finance, revenue reduction and financial benefit set. Economy, money savings and increase profit line icons. Cash back, wallet and return finance. Inflation rising. Vector
Free with trial Money cash, coin business doodle icon set. Dollar coin, money profit doodle line sketch business inflation, cash payment. Financial profit, growth icon. Outline editable stroke. Vector illustration. Line financial growth decrease vectors Money cash, coin business doodle icon set. Dollar coin, money profit doodle line sketch business inflation, cash payment
Free with trial Outline set of Growth chart, Stock analysis and Report document line icons for web application. Phone ui interface. Include Column diagram, Loan percent, Line chart icons. Vector. Line financial growth decrease vectors Outline set of Growth chart, Stock analysis and Report document line icons for web application. For design. Vector. Outline set of Growth chart, Stock analysis and Report document line icons for web application. Phone ui interface. Include Column diagram, Loan percent, Line chart icons. Vector
Free with trial Percentage arrow up and down icon on circle line. Percent growth and decline sign symbol vector. Line financial growth decrease vectors Percentage arrow up and down icon on circle line. Percent growth and decline sign symbol
Free with trial Percent up and down icon on circle line. Percentage arrow growth and decline sign symbol vector. Line financial growth decrease vectors Percent up and down icon on circle line. Percentage arrow growth and decline sign symbol
Free with trial Percent arrow up and down icon on circle line. Percentage growth and decline sign symbol vector. Line financial growth decrease vectors Percent arrow up and down icon on circle line. Percentage growth and decline sign symbol
Free with trial Money line icons. Finance, revenue reduction and financial benefit set. Economy, money savings and increase profit line icons. Cash back, wallet and return finance. Inflation rising. Vector. Line financial growth decrease vectors Money line icons. Finance, revenue reduction and financial benefit. Vector. Money line icons. Finance, revenue reduction and financial benefit set. Economy, money savings and increase profit line icons. Cash back, wallet and return finance. Inflation rising. Vector
Free with trial Money line icons. Finance, revenue reduction and financial benefit set. Economy, money savings and increase profit line icons. Cash back, wallet and return finance. Inflation rising. Vector. Line financial growth decrease vectors Money line icons. Finance, revenue reduction and financial benefit. Vector. Money line icons. Finance, revenue reduction and financial benefit set. Economy, money savings and increase profit line icons. Cash back, wallet and return finance. Inflation rising. Vector
Free with trial Finance productivity graph flat line icons set. Graph of growth with money sign. Dividends. Return on investment chart. Profit growth. Simple flat vector illustration for store, web site or mobile app. Line financial growth decrease vectors Finance productivity graph flat line icons set. Graph of growth with money sign. Dividends. Return on investment chart. Profit
Free with trial Dollar arrow up and down outline icon vector on circle line. USD increase and decrease sign symbol. Line financial growth decrease vectors Dollar arrow up and down outline icon on circle line. USD increase and decrease sign symbol
Free with trial Up and down dollar arrow outline icon on circle line. Increase and decrease USD sign symbol vector. Line financial growth decrease vectors Up and down dollar arrow outline icon on circle line. Increase and decrease USD sign symbol