Free with trial Confident young businessman in front of abstract arrow graph background concept. Line financial growth decrease vectors Businessman abstract arrow graph background. Confident young businessman in front of abstract arrow graph background concept
Free with trial Colorful graph / diagram with arrow. Line financial growth decrease illustrations Colorful graph
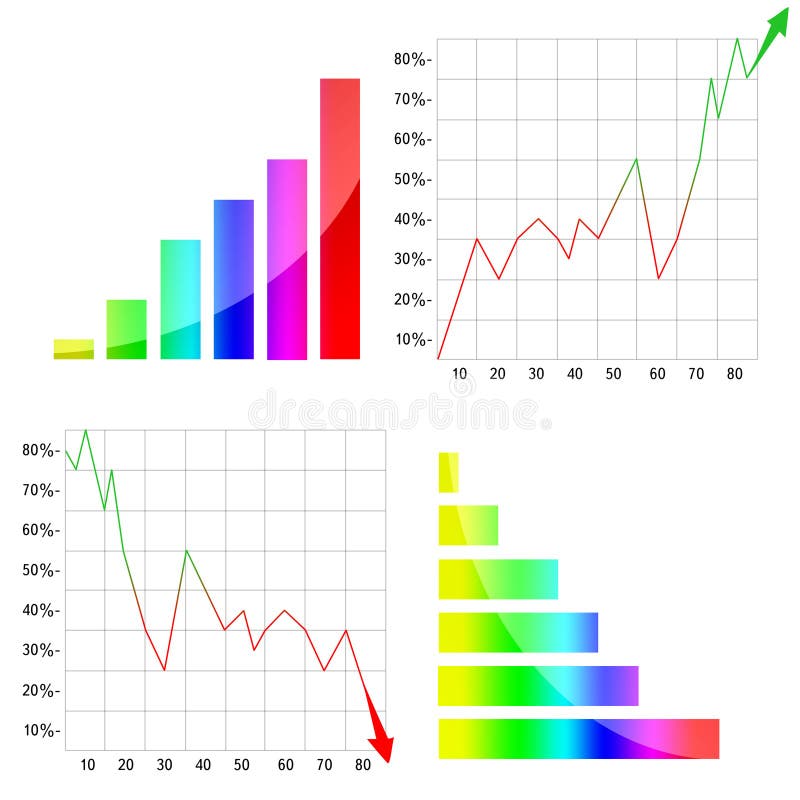
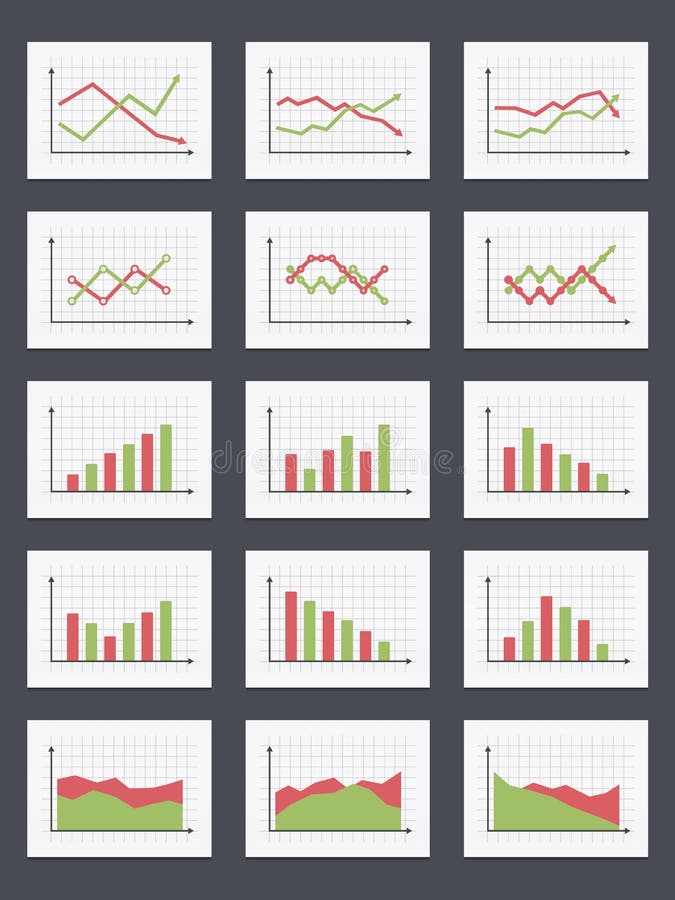
Free with trial Set of different graphs and charts. Line financial growth decrease vectors Graphs and Charts
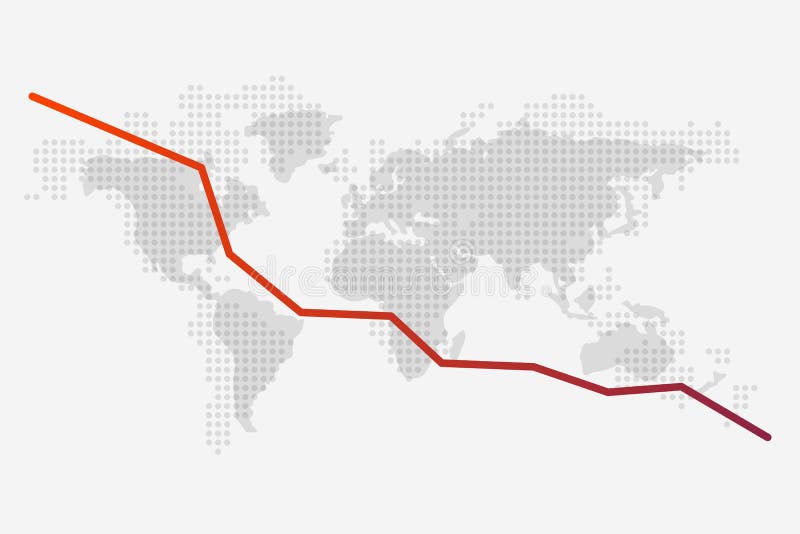
Free with trial World map and a red fall graph on its background. Dotted World map. Vector illustration. Light background. Eps10. Line financial growth decrease vectors World map and a red fall graph on its background.
Free with trial Statistics - 3d multicolor diagram on white. Line financial growth decrease illustrations Diagram - illustration. Statistics - 3d multicolor diagram on white
Free with trial Set of vector solid icons related to loan, bank credit rate, finance and investment. Symbols for website or app ui, logo design, illustration. Line financial growth decrease vectors Vector solid icons of money credit and loan. Set of vector solid icons related to loan, bank credit rate, finance and investment. Symbols for website or app ui, logo design, illustration
Free with trial Think different, stand out from crowd,business concepts. illustration. Line financial growth decrease vectors Think different
Free with trial Crisis in the world business market - illustration. Line financial growth decrease illustrations Crisis in the world business market
Free with trial Statistics - 3d isolated multicolor diagram. Line financial growth decrease illustrations Statistics - 3d isolated on white. Statistics - 3d isolated multicolor diagram
Free with trial Statistics - 3d isolated multicolor diagram. Line financial growth decrease illustrations Statistics - 3d isolated on black. Statistics - 3d isolated multicolor diagram
Free with trial Arrow graph going up illustration isolated on white background. Business chart cartoon. Line financial growth decrease illustrations Arrow graph going up illustration isolated on white background
Free with trial Statistics - 3d isolated multicolor diagram. Line financial growth decrease illustrations Statistics - 3d isolated on white. Statistics - 3d isolated multicolor diagram
Free with trial An opening in a wall shaped like an arrow graph. Line financial growth decrease illustrations Opening in a wall graph. An opening in a wall shaped like an arrow graph
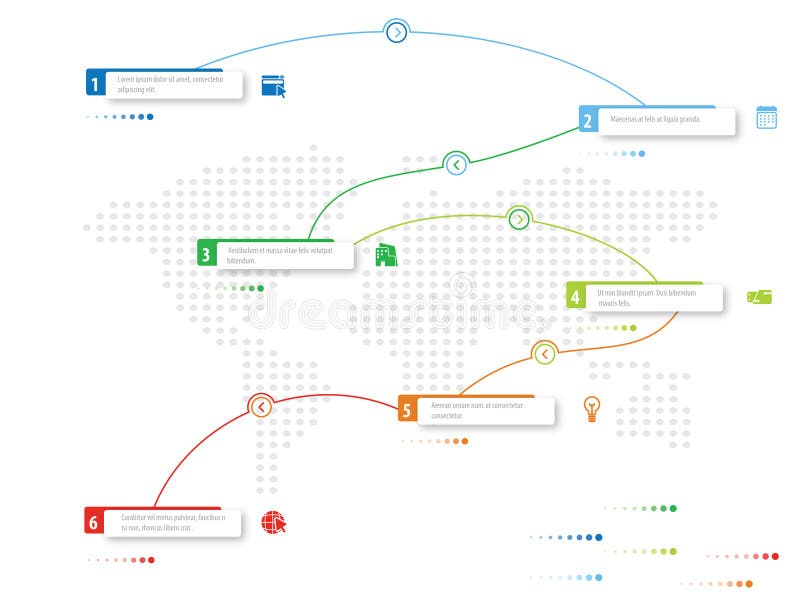
Free with trial World stats chart whit tabs for text message background illustration of global development. Line financial growth decrease vectors World background. World stats chart whit tabs for text message background illustration of global development .
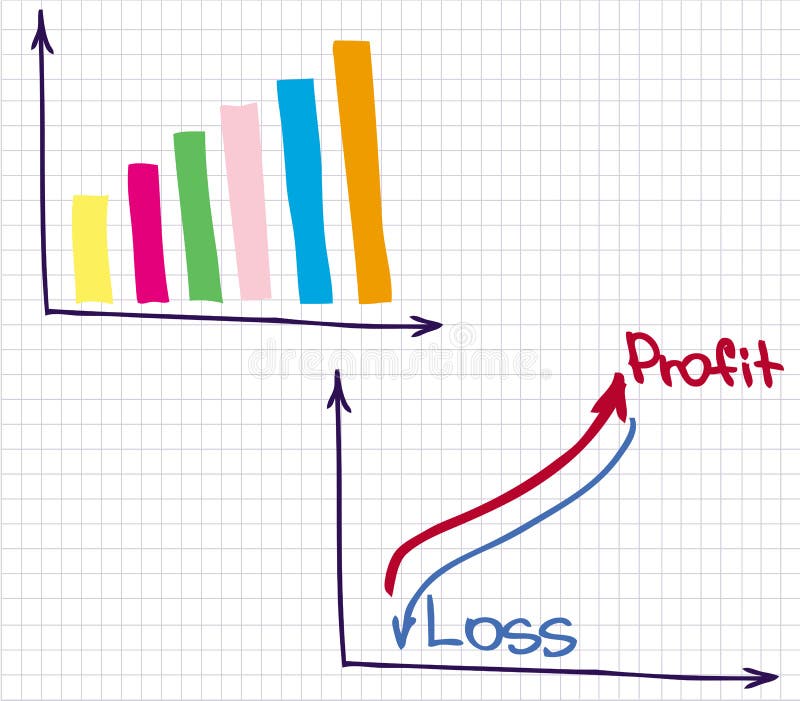
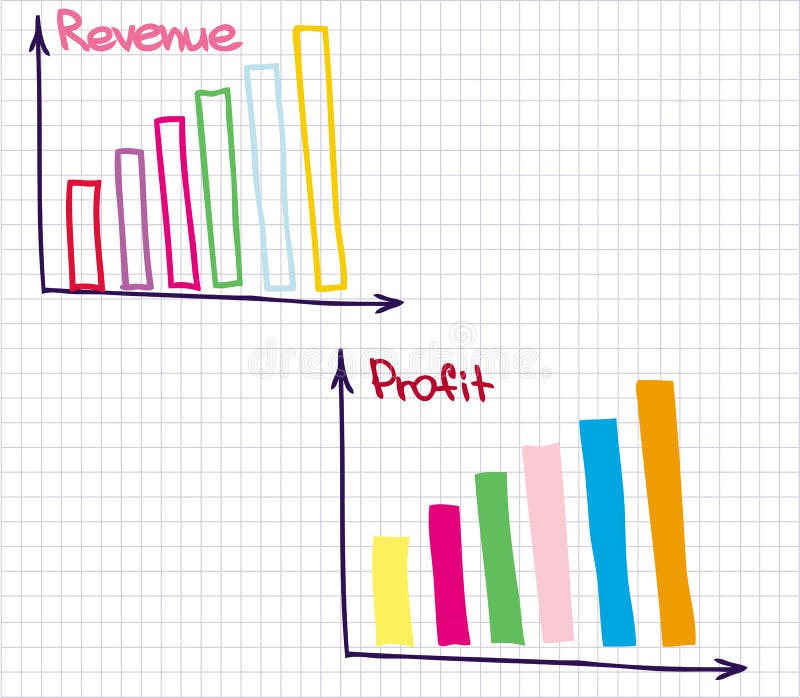
Free with trial Financial chart of revenue and loss. Line financial growth decrease vectors Profit Revenue Chart. Financial chart of revenue and loss
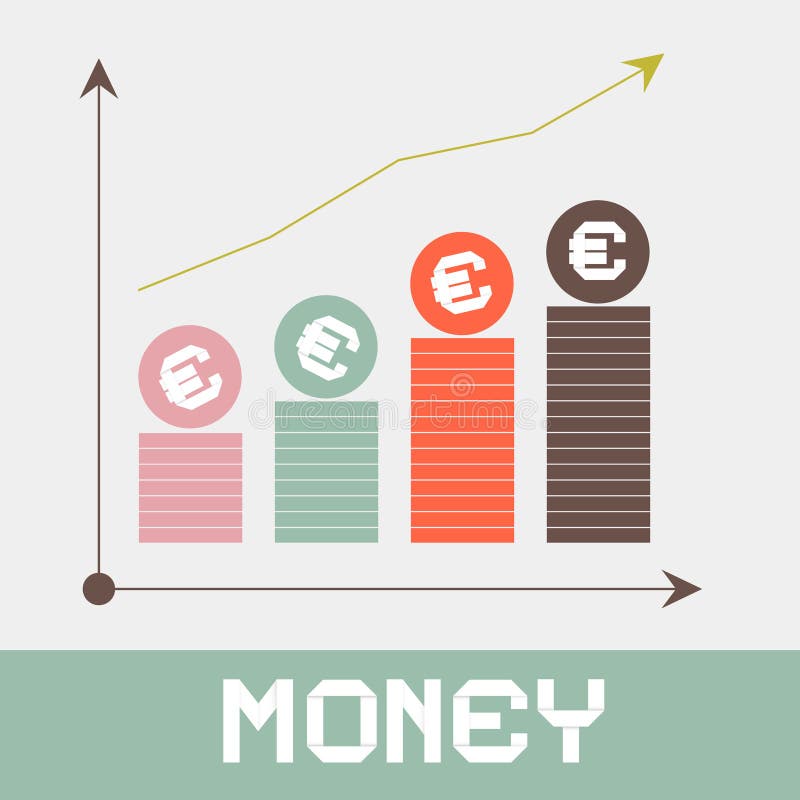
Free with trial Increase Money Graph Paper Retro Vector Illustration. Line financial growth decrease vectors Increase Money Graph Paper
Free with trial Price Drop Icon. A flat illustration featuring a gold dollar coin with three red arrows pointing down. Line financial growth decrease vectors Price Drop Icon
Free with trial Set of Different Graphs on White. Vector illustration. Line financial growth decrease vectors Set of Different Oscilloscope Electric Signal. Set of Different Graphs on White. Vector illustration
Free with trial Growing and decreasing chart presentation. Vector illustration in EPS10. Line financial growth decrease vectors Growing and decreasing chart presentation.
Free with trial Concept crisis diagram on the screen. Line financial growth decrease vectors Crisis diagram
Free with trial Percentage arrow icon vector. Percent up and down icon vector. Line financial growth decrease vectors Up arrow percentage and down arrow percentage icon. Percentage arrow icon vector. Percent up and down icon vector.
Free with trial Colorful shiny geometric blue and red exclamation mark sign icon badge banner. Vector graphic illustration template. Isolated on white background. Line financial growth decrease vectors Colorful shiny geometric blue and red exclamation mark sign icon badge banner. Vector graphic illustration template
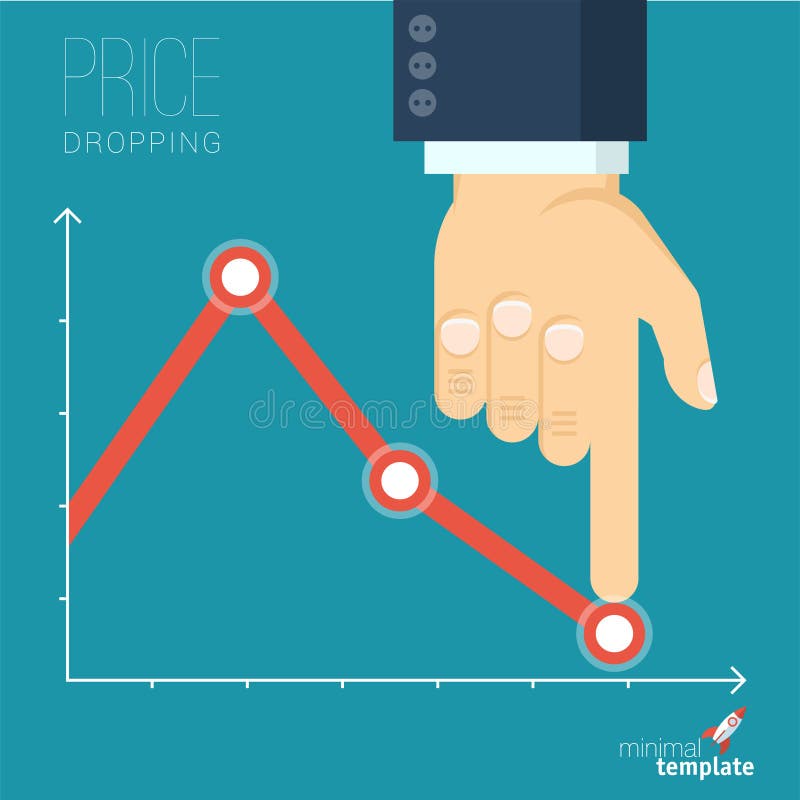
Free with trial Flat design vector illustration of businessman creating decreasing business graph. Vector abstract price drop and sale countdown. Line financial growth decrease vectors Decreasing business graph
Free with trial Icons for business and Finance. Income,profit, and expense charts. Piggy Bank, dollar, accounting and interest. Investment. Line financial growth decrease vectors Icons for business and Finance. Income,profit, and expense charts.Piggy Bank, dollar, accounting and interest.
Free with trial Bear market. Low poly wireframe vector stock exchange illustration. Polygonal digital image. Technology abstract style. Fall chart. Finance and business or animals theme World financial crisis concept. Line financial growth decrease vectors Bear market. Low poly
Free with trial Business falling icon isolated on background vector illustration. Non AI Generate. Line financial growth decrease vectors Business falling icon isolated on background vector illustration.
Free with trial Profit with magnifier on white background. Line financial growth decrease illustrations Profit with magnifier on white
Free with trial Crisis diagram illustration design over a white background. Line financial growth decrease illustrations Crisis diagram illustration design
Free with trial Colorful graph / diagram with arrow on white. Line financial growth decrease illustrations Colorful graph / diagram with arrow on white
Free with trial Vector of bull and bear symbols of stock market trends. The growing and falling market. Easy editable layered vector illustration. Wild Animals. Line financial growth decrease vectors Vector of bull and bear symbols of stock market trends. The growing and falling market. Easy editable layered vector illustration
Free with trial Stack of bitcoin coins. in background a graph showing decrease in value. Falling of cryptocurrency. Line financial growth decrease vectors Bitcoin, cryptocurrency falling graph, risk, crash, collapse of BTC. Stack of bitcoin coins. in background a graph showing decrease in value. Falling of cryptocurrency.
Free with trial Businessmen are joining the effort to restore decreasing trend. Line financial growth decrease illustrations Restoring decreasing trend. Businessmen are joining the effort to restore decreasing trend
Free with trial Black and white outline showing a gear, a chart with falling bars, and an arrow pointing down, symbolizing economic. Line financial growth decrease illustrations Economic Downturn Gear, Chart, Arrow Down, Black and White. Black and white outline showing a gear, a chart with falling bars, and an arrow pointing down, symbolizing economic.
Free with trial 3D decreasing red arrow on the chart. Line financial growth decrease illustrations Decreasing red arrow on the chart
Free with trial Graph going up and down sign isolated vector illustration on white background. Line financial growth decrease vectors Graph going up and down sign isolated vector illustration. Graph going up and down sign isolated vector illustration on white background
Free with trial Business graph globe and people chart. Line financial growth decrease vectors Business graph
Free with trial Stocks fall. Candle stick graph chart of stock market investment trading. Bullish point, down trend of graph. Futuristic red signal trend drop down arrow chart. Line financial growth decrease vectors Stocks fall. Candle stick graph chart of stock market investment trading. Bullish point, down trend of graph. Futuristic red. Stocks fall. Candle stick graph chart of stock market investment trading. Bullish point, down trend of graph. Futuristic red signal trend drop down arrow chart
Free with trial The money and business outline icon set. The stack of dollar coins, gold 24k, upward and downward graph, online banking, briefcase and banknote symbols. Thin linear vector icons with editable strokes. Line financial growth decrease vectors The money and business outline vector icon set. The money and business outline icon set. The stack of dollar coins, gold 24k, upward and downward graph, online banking, briefcase and banknote symbols. Thin linear vector icons with editable strokes
Free with trial Illustration of a growing business intelligence with a dashboard displaying high metrics, a stack of data chips, and a simple magnifying glass. Vector flat icon design on a white background for a data analysis illustration --chaos 30 --ar 16:9 --v 7 Job ID: cfbe4cc3-3bae-455f-ac79-f340192ae4d4. Line financial growth decrease illustrations Data Analysis and Reporting Concept Computer Screen with Charts and Magnifying Glass. Illustration of a growing business intelligence with a dashboard displaying high metrics, a stack of data chips, and a simple magnifying glass. Vector flat icon design on a white background for a data analysis illustration --chaos 30 --ar 16:9 --v 7 Job ID: cfbe4cc3-3bae-455f-ac79-f340192ae4d4
Free with trial Minimalist outline drawing of a bar chart representing data analysis and statistical information. Great for presentations and data representations. Line financial growth decrease vectors Simple Outline Bar Chart Sign Statistical Data Analysis Diagram Icon. Minimalist outline drawing of a bar chart representing data analysis and statistical information. Great for presentations and data representations.
Free with trial Set of vector solid icons related to loan, bank credit rate, finance and investment. Symbols for website or app UI, logo design, illustration. Line financial growth decrease vectors Vector solid icons of money credit and loan. Set of vector solid icons related to loan, bank credit rate, finance and investment. Symbols for website or app UI, logo design, illustration
Free with trial Grunge currency sign icon with green and red up and down arrows. Vector graphic illustration template. Isolated on white background. Line financial growth decrease vectors Grunge currency sign icon with green and red up and down arrows
Free with trial Set of sketched icons showing mutual fund nav increases and decreases with indian rupee signs on an alpha transparent base. Line financial growth decrease vectors Mutual fund nav trend sketch icons with rupee symbol alpha transparent. Set of sketched icons showing mutual fund nav increases and decreases with indian rupee. Set of sketched icons showing mutual fund nav increases and decreases with indian rupee signs on an alpha transparent base.
Free with trial Logo design graphic concept creative premium vector stock image top sell. Line financial growth decrease vectors Dollar money arrow up down chart diagram inflation rate risk market business. Logo design graphic concept creative premium vector stock image top sell
Free with trial Professional Vector Logo Design High-Resolution & Fully Editable This high-quality vector logo is designed with precision and creativity making it ideal for modern businesses, startups, and creative professionals The design is clean, scalable, and easy to customize�perfect for branding marketing materials, websites, and print applications. Key Features:100% Vector format (AI EPS SVG)Fully editable (colors, text, and shapes)High resolution � perfect for both web and print Modern, professional, and versatile design Ready for branding and promotional use Elevate your brand with this premium quality logo!. Line financial growth decrease vectors Dementia icon editable stock vector logo design. Professional Vector Logo Design High-Resolution & Fully Editable This high-quality vector logo is designed with precision and creativity making it ideal for modern businesses, startups, and creative professionals The design is clean, scalable, and easy to customize�perfect for branding marketing materials, websites, and print applications. Key Features:100% Vector format (AI EPS SVG)Fully editable (colors, text, and shapes)High resolution � perfect for both web and print Modern, professional, and versatile design Ready for branding and promotional use Elevate your brand with this premium quality logo!
Free with trial Set of different graphs and charts, green and red colors. Line financial growth decrease vectors Charts
Free with trial Grunge currency sign icon with green and red up and down arrows. Vector graphic illustration template. Isolated on white background. Line financial growth decrease vectors Grunge currency sign icon with green and red up and down arrows
Free with trial Inflation reduction act on blue background. Line financial growth decrease illustrations Inflation reduction act on blue
Free with trial Euro Currency Icons in Circles. Line financial growth decrease vectors Euro Currency Icons
Free with trial Graph going Up and Down sign with green and red arrows vector. Flat design vector illustration concept of sales bar chart symbol icon with arrow moving down and sales bar chart with arrow moving up. Line financial growth decrease illustrations Graph going Up and Down sign with green and red arrows vector. Flat design vector illustration concept of sales bar chart symbol. Graph going Up and Down sign with green and red arrows vector. Flat design vector illustration concept of sales bar chart symbol icon with arrow moving down and sales bar chart with arrow moving up.
Free with trial Collection of simple black vector icons representing financial charts, data analysis graphs, and business statistics. Includes trend arrows, magnifier, and settings symbols. Line financial growth decrease vectors Set of black business graph and chart icons for data analysis. Collection of simple black vector icons representing financial charts, data analysis graphs, and business statistics. Includes trend arrows, magnifier, and settings symbols
Free with trial A 3D rendered illustration of a stock market candlestick chart is shown against a light blue background. The chart displays a mix of red and green candlesticks, indicating price fluctuations. A prominent red arrow points downwards, signifying a market decline. A white zigzag line also charts a downward trend. To the right, a red exclamation mark and a red dot serve as a warning or alert symbol. Line financial growth decrease illustrations 3D Rendered Stock Market Candlestick Chart with Falling Red Arrow and Exclamation Mark finance. A 3D rendered illustration of a stock market candlestick chart is shown against a light blue background. The chart displays a mix of red and green candlesticks, indicating price fluctuations. A prominent red arrow points downwards, signifying a market decline. A white zigzag line also charts a downward trend. To the right, a red exclamation mark and a red dot serve as a warning or alert symbol
Free with trial Two broken trend lines with arrows are going up and down, 3d illustration on white background. Line financial growth decrease illustrations Two broken trend lines are going up and down. Two broken trend lines with arrows are going up and down, 3d illustration on white background
Free with trial Illustration of a business activities. Line financial growth decrease vectors Illustration of a business activities
Free with trial A downward trend is shown on a graph. The graph is black and white. Line financial growth decrease illustrations A downward trend is shown on a graph
Free with trial Hysteresis RGB color icon. Graph curve to represent magnetic field. Mathematical function. Educational chart. Growth and decline in physics grid. Rate of unemployment. Isolated vector illustration. Line financial growth decrease vectors Hysteresis RGB color icon
Free with trial Failure, red arrow going down on white background in business concept. 3d illustration. Line financial growth decrease illustrations Failure, red arrow going down on white background in business
Free with trial Dollar Currency Up Down Icons. Redus and high costs line with dollar icons.. eps. Line financial growth decrease vectors Circular dollar icons showing rising and falling currency values. Dollar Currency Up Down Icons. Redus and high costs line with dollar icons..eps
Free with trial Graph down. Black Icon graph decline with arrow isolated on white background. Hologram statistic. Deficit direction for business concept design. Analysis information forecast. Vector illustration. Line financial growth decrease vectors Graph down. Black Icon graph decline with arrow isolated on white background. Hologram deficit direction for business design. Graph down. Black Icon graph decline with arrow isolated on white background. Hologram statistic. Deficit direction for business concept design. Analysis information forecast. Vector illustration
Free with trial Business Chart Down - Black And Golden 3D Illustration - Isolated On White Background. Line financial growth decrease illustrations Business Chart Down - Black And Golden 3D Illustration - Isolated On White Background
Free with trial A globe with a map of the world on it, sitting next to a set of orange bar graphs. Line financial growth decrease illustrations A globe sitting on top of a table next to a bar chart. A globe with a map of the world on it, sitting next to a set of orange bar graphs
Free with trial Sketch graphs and charts for business presentation. Line financial growth decrease vectors Financial chart. Sketch graphs and charts for business presentation
Free with trial Simple Chart graph diagram bar histograms. Line financial growth decrease vectors Chart graph diagram bar histograms
Free with trial Simple Chart graph diagram bar histograms. Line financial growth decrease vectors Chart graph diagram bar histograms
Free with trial Simple Chart graph diagram bar histograms. Line financial growth decrease vectors Chart graph diagram bar histograms
Free with trial Simple Chart graph diagram bar histograms. Line financial growth decrease vectors Chart graph diagram bar histograms
Free with trial Four vibrant lines undulating on a dark dashboard, illustrating progress over time while emphasizing key data points with distinct circles for enhanced clarity and analysis. Line financial growth decrease vectors Four vibrant lines undulating on a dark dashboard, illustrating progress over time while emphasizing key data points
Free with trial Simple Chart graph diagram bar histograms. Line financial growth decrease vectors Chart graph diagram bar histograms
Free with trial Sketch graphs and charts for business presentation. Line financial growth decrease vectors Financial charts on the flip chart. Sketch graphs and charts for business presentation
Free with trial Percentage with arrow up and down. Percentage arrow with percent sign. Design concept for banking, credit, interest rate, finance and money sphere. Line financial growth decrease vectors Percentage with arrow up and down. Percentage arrow with percent sign.
Free with trial Financial chart of revenue and loss. Line financial growth decrease vectors Profit Revenue Chart. Financial chart of revenue and loss
Free with trial Financial chart of revenue and loss. Line financial growth decrease vectors Profit Revenue Chart. Financial chart of revenue and loss
Free with trial Percent down 3d icon. Vector illustration. Eps 10. Line financial growth decrease vectors Percent down 3d icon. Vector illustration
Free with trial The sketch of the annual analysis with schedules on quarters. Line financial growth decrease vectors Annual analysis
Free with trial Reciprocal tariffs and stock market crashes and economic decline or falling stock market prices. Line financial growth decrease illustrations Reciprocal tariffs and stock market crashes and economic decline or falling stock market prices
Free with trial This image shows a downward-trending red arrow graph, generated by AI, illustrating a significant decline. The visual representation is clear and effective in communicating a negative trend, potentially in stock prices, sales figures, or other quantifiable data. Line financial growth decrease illustrations Downward Trending Graph. This image shows a downward-trending red arrow graph, generated by AI, illustrating a significant decline. The visual representation is clear and effective in communicating a negative trend, potentially in stock prices, sales figures, or other quantifiable data.
Free with trial Financial chart of revenue and loss. Line financial growth decrease vectors Time Management Chart. Financial chart of revenue and loss
Free with trial Graph with a green arrow pointing upwards. The graph is labeled with numbers and the numbers are increasing. Line financial growth decrease illustrations Graph with a green arrow pointing upwards
Free with trial The rise and fall of bitcoin on exchange of cryptocurrency. Money currency bitcoin, exchange rise finance, vector illustration. Line financial growth decrease vectors The rise and fall of bitcoin on exchange of cryptocurrency
Free with trial Arrow down and up percent outline icon on black circle. Percentage downward and upward arrows sign symbol vector. Line financial growth decrease vectors Arrow down and up percent outline icon on black circle. Percentage downward and upward arrows sign symbol