Free with trial Growth and loss arrow icon on circle line. Increase and decrease sign symbol illustration. Line financial growth decrease vectors Growth and loss arrow icon on circle line. Increase and decrease sign symbol
Free with trial Line graph illustrating data analysis and business statistics, charting financial growth, market changes, and performance metrics for visual information and infographic content. Line financial growth decrease illustrations Analyzing data with line graph showing business trends. Line graph illustrating data analysis and business statistics, charting financial growth, market changes, and performance metrics for visual information and infographic content
Free with trial This image features a variety of icons representing financial growth, percentage increases, and economic trends. The icons include symbols of upward and downward arrows, bar graphs, line graphs, and percentage signs, all in a simple, black-and-white design. These icons are commonly used in financial charts, business presentations, and economic reports to illustrate data trends and financial. Line financial growth decrease vectors Collection of financial growth and percentage icons. This image features a variety of icons representing financial growth, percentage increases, and economic trends. The icons include symbols of upward and downward arrows, bar graphs, line graphs, and percentage signs, all in a simple, black-and-white design. These icons are commonly used in financial charts, business presentations, and economic reports to illustrate data trends and financial
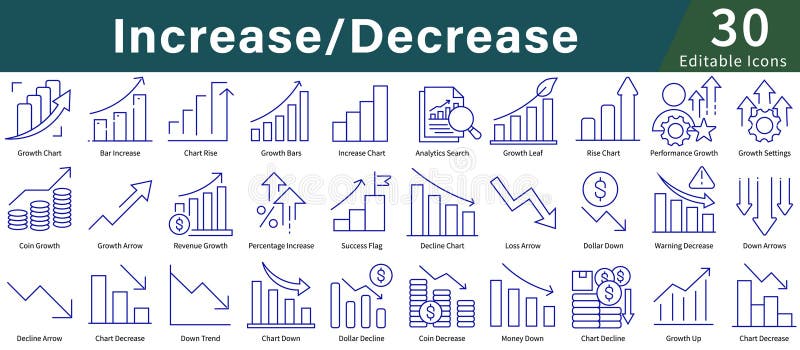
Free with trial Icons illustrating concepts of "Increase Decrease," using simple blue line art. Features include graphs and charts with upward and downward arrows, coins, dollar symbols, and percentage signs. Icons depict growth, decline, analytics, and performance tracking. Suitable for business, finance, or data analysis themes, these icons provide a visual representation of financial trends and statistics, making abstract concepts clear and easily understandable. The design is minimalistic and user-friendly, aimed at enhancing clarity in presentations and reports. Line financial growth decrease vectors Increase Decrease Icon Set in Line Style with Editable Vector for Growth, Analytics, Charts, and Data Visualization. Icons illustrating concepts of "Increase Decrease," using simple blue line art. Features include graphs and charts with upward and downward arrows, coins, dollar symbols, and percentage signs. Icons depict growth, decline, analytics, and performance tracking. Suitable for business, finance, or data analysis themes, these icons provide a visual representation of financial trends and statistics, making abstract concepts clear and easily understandable. The design is minimalistic and user-friendly, aimed at enhancing clarity in presentations and reports.
Free with trial Bar Chart Growth And Decline Line And Solid Icon Set. Financial Performance, Economic Trends, Business Analysis Symbol Collection. Data Visualization And Market Trends. Isolated Vector Illustration. Line financial growth decrease vectors Bar Chart Growth And Decline Line And Solid Icon Set. Financial Performance, Economic Trends, Business Analysis Symbol
Free with trial Set line Lucky player American football betting money Casino dealer chips Hand holding casino Financial growth decrease Online poker table game and with dollar icon. Vector. Line financial growth decrease illustrations Set line Lucky player, American football betting money, Casino dealer, chips, Hand holding casino, Financial growth. Set line Lucky player American football betting money Casino dealer chips Hand holding casino Financial growth decrease Online poker table game and with dollar icon. Vector.
Free with trial Set line Browser window Server Data Cloud upload Search engine Graph chart infographic and Financial growth decrease icon. Vector. Line financial growth decrease vectors Set line Browser window, Server, Data, Cloud upload, Search engine, Graph chart infographic and Financial growth. Set line Browser window Server Data Cloud upload Search engine Graph chart infographic and Financial growth decrease icon. Vector.
Free with trial Filled outline Financial growth decrease icon isolated on white background. Increasing revenue. Flat filled outline style with shadow. Vector. Line financial growth decrease illustrations Filled outline Financial growth decrease icon isolated on white background. Increasing revenue. Flat filled outline
Free with trial Set Isometric line American football betting money Online sports Lucky player and Financial growth decrease icon. Vector. Line financial growth decrease vectors Set Isometric line American football betting money, Online sports, Lucky player and Financial growth decrease icon
Free with trial Filled outline Financial growth decrease icon isolated on white background. Increasing revenue. Vector. Line financial growth decrease vectors Filled outline Financial growth decrease icon isolated on white background. Increasing revenue. Vector
Free with trial Color Financial growth decrease icon isolated on white background. Increasing revenue. Flat filled outline style with shadow. Vector. Line financial growth decrease illustrations Color Financial growth decrease icon isolated on white background. Increasing revenue. Flat filled outline style with
Free with trial A set of line art icons illustrating financial growth, investment strategies, and market analysis, perfect for business presentations and reports with clean design. Line financial growth decrease vectors Vector art of line art icons depicting financial growth, investment strategies, and market analysis, ideal for illustrating. A set of line art icons illustrating financial growth, investment strategies, and market analysis, perfect for business presentations and reports with clean design
Free with trial Line Graph Chart Icon. Data Analysis, Business Growth, And Statistical Trends Outline Symbol. Financial Performance Tracking. Editable Stroke. Isolated Vector Illustration. Line financial growth decrease vectors Line Graph Chart Icon. Data Analysis, Business Growth, And Statistical Trends Outline Symbol. Financial Performance
Free with trial Filled outline Financial growth decrease icon isolated on blue background. Increasing revenue. Turquoise square button. Vector. Line financial growth decrease vectors Filled outline Financial growth decrease icon isolated on blue background. Increasing revenue. Turquoise square button
Free with trial Filled outline Financial growth decrease icon isolated on blue background. Increasing revenue. Vector. Line financial growth decrease vectors Filled outline Financial growth decrease icon isolated on blue background. Increasing revenue. Vector
Free with trial Filled outline Financial growth decrease icon isolated on blue background. Increasing revenue. Vector. Line financial growth decrease illustrations Filled outline Financial growth decrease icon isolated on blue background. Increasing revenue. Vector
Free with trial Filled outline Financial growth decrease icon isolated on white background. Increasing revenue. Vector. Line financial growth decrease vectors Filled outline Financial growth decrease icon isolated on white background. Increasing revenue. Vector
Free with trial Set line Arrow Pie chart infographic Graph chart diagram Wrench and gear Pyramid infographics Financial growth decrease Flag and Factory icon. Vector. Line financial growth decrease vectors Set line Arrow, Pie chart infographic, Graph, chart, diagram, Wrench and gear, Pyramid infographics, Financial growth. Set line Arrow Pie chart infographic Graph chart diagram Wrench and gear Pyramid infographics Financial growth decrease Flag and Factory icon. Vector.
Free with trial A professional collection of 16 business and financial icons featuring various bar charts and line graphs. Perfect for UI dashboards, corporate presentations, and data-heavy infographics showing market growth or decline. Line financial growth decrease vectors Business Growth Bar Charts and Financial Trend Line Graph Vector Icons Set. A professional collection of 16 business and financial icons featuring various bar charts and line graphs. Perfect for UI dashboards, corporate presentations, and data-heavy infographics showing market growth or decline.
Free with trial A professional collection of 16 business and financial icons featuring various bar charts and line graphs. Perfect for UI dashboards, corporate presentations, and data-heavy infographics showing market growth or decline. Line financial growth decrease vectors Business Growth Bar Charts and Financial Trend Line Graph Vector Icons Set. A professional collection of 16 business and financial icons featuring various bar. A professional collection of 16 business and financial icons featuring various bar charts and line graphs. Perfect for UI dashboards, corporate presentations, and data-heavy infographics showing market growth or decline.
Free with trial A dynamic digital illustration of a financial chart on a dark, high-tech background. The image features two contrasting lines: a vibrant green line trending upwards with an arrow, symbolizing growth, profit, and success, and a blue line moving downwards with an arrow, representing decline, loss, and risk. Glowing data points and a network grid enhance the futuristic feel. This versatile graphic is perfect for concepts related to stock market analysis, business performance, investment volatility, economic forecasting, big data, and financial technology (fintech). Line financial growth decrease illustrations Futuristic Financial Graph with Growth and Decline Arrows. A dynamic digital illustration of a financial chart on a dark, high-tech background. The image features two contrasting lines: a vibrant green line trending upwards with an arrow, symbolizing growth, profit, and success, and a blue line moving downwards with an arrow, representing decline, loss, and risk. Glowing data points and a network grid enhance the futuristic feel. This versatile graphic is perfect for concepts related to stock market analysis, business performance, investment volatility, economic forecasting, big data, and financial technology (fintech).
Free with trial A 3D icon depicts a financial graph. The icon features a rounded purple square with a lighter purple top edge. Inside, a yellow line chart with circular data points shows an upward trend, overlaid on a series of yellow vertical bars representing a bar chart. The overall design is clean and modern, symbolizing data analysis, business growth, and financial performance. Line financial growth decrease illustrations 3D icon representing a financial graph with bars and a line chart on a purple background. A 3D icon depicts a financial graph. The icon features a rounded purple square with a lighter purple top edge. Inside, a yellow line chart with circular data points shows an upward trend, overlaid on a series of yellow vertical bars representing a bar chart. The overall design is clean and modern, symbolizing data analysis, business growth, and financial performance
Free with trial Three stacks of gold coins, varying in height, are arranged side by side. Red downward arrows are above the smallest stack on the left, indicating decline, while green upward arrows are above the tallest stack in the center, suggesting growth. The stack on the right is of medium height. The illustration uses a watercolor style to represent financial concepts of increase and decrease. Line financial growth decrease vectors Financial Growth and Decline Coin Stacks with Up and Down Arrows. Three stacks of gold coins, varying in height, are arranged side by side. Red downward arrows are above the smallest stack on the left, indicating decline, while green upward arrows are above the tallest stack in the center, suggesting growth. The stack on the right is of medium height. The illustration uses a watercolor style to represent financial concepts of increase and decrease.
Free with trial A set of simple and clean line art icons representing various financial and business concepts, including growth, decrease, profit, and loss. These icons are suitable for use in presentations, websites, and mobile applications. Line financial growth decrease vectors Simple Line Art Financial Chart Symbol Icon Set for Business Concept. A set of simple and clean line art icons representing various financial and business concepts, including growth, decrease, profit, and loss. These icons are suitable for use in presentations, websites, and mobile applications.
Free with trial A collage of nine distinct charts and graphs, primarily displaying financial data, growth trends, and economic indicators. The visuals feature line graphs, area charts, and bar charts with various colored lines and shaded areas representing different metrics over time. Accompanying text and labels suggest analysis of business performance, economic growth, and financial markets. This collection is ideal for presentations, reports, and articles related to finance, economics, and business analytics. Line financial growth decrease illustrations Collection of Financial and Business Growth Charts. A collage of nine distinct charts and graphs, primarily displaying financial data, growth trends, and economic indicators. The visuals feature line graphs, area charts, and bar charts with various colored lines and shaded areas representing different metrics over time. Accompanying text and labels suggest analysis of business performance, economic growth, and financial markets. This collection is ideal for presentations, reports, and articles related to finance, economics, and business analytics.
Free with trial A clean and modern digital illustration of a financial candlestick chart, displaying market trends and stock performance. The graph features blue candlesticks indicating price movements over time, accompanied by a solid blue line graph and subtle dashed trend lines. Set against a crisp white background with a clear grid, this visualization is ideal for illustrating concepts related to finance, investment, business analytics, economic forecasts, and data reporting. It conveys growth, volatility, and strategic decision-making in the stock market. Line financial growth decrease illustrations Financial Candlestick Chart with Trend Line on White Background. A clean and modern digital illustration of a financial candlestick chart, displaying market trends and stock performance. The graph features blue candlesticks indicating price movements over time, accompanied by a solid blue line graph and subtle dashed trend lines. Set against a crisp white background with a clear grid, this visualization is ideal for illustrating concepts related to finance, investment, business analytics, economic forecasts, and data reporting. It conveys growth, volatility, and strategic decision-making in the stock market.
Free with trial A vector icon of a descending line graph on a green base, illustrating a downward trend, decrease, or decline in data. Represents financial loss, reduced performance, or negative growth. Suitable for business reports, statistical analysis, and economic presentations, vector design Generative AI. Line financial growth decrease vectors Descending Line Graph Decline Trend Chart Icon, vector design Generative AI. A vector icon of a descending line graph on a green base, illustrating a downward trend, decrease, or decline in data. Represents financial loss, reduced performance, or negative growth. Suitable for business reports, statistical analysis, and economic presentations, vector design Generative AI
Free with trial Colorful line graph illustrating growth and decline over time, with variously colored data points on a dark background, visualizing financial performance and trends. Line financial growth decrease vectors Colorful line graph illustrating growth and decline over time, with variously colored data points on a dark background
Free with trial This infographic-style image visually represents business growth and financial performance through various charts and graphs. A line graph illustrates revenue trends with percentage markers, a donut chart displays market share distribution, and a bar chart shows quarterly profit figures. Icons representing data, growth, and reports are subtly integrated into the background, creating a professional and informative visual for business and finance-related content. Line financial growth decrease illustrations Business Growth and Financial Performance Analytics. This infographic-style image visually represents business growth and financial performance through various charts and graphs. A line graph illustrates revenue trends with percentage markers, a donut chart displays market share distribution, and a bar chart shows quarterly profit figures. Icons representing data, growth, and reports are subtly integrated into the background, creating a professional and informative visual for business and finance-related content.
Free with trial A flat vector icon showing a line graph with a distinct downward trend. Represents decline, decrease, negative growth, or falling performance. Suitable for business analysis, financial reports, or graphics illustrating negative progress or statistics, vector design Generative AI. Line financial growth decrease vectors Downward line graph icon representing negative trend decline, vector design Generative AI. A flat vector icon showing a line graph with a distinct downward trend. Represents decline, decrease, negative growth, or falling performance. Suitable for business analysis, financial reports, or graphics illustrating negative progress or statistics, vector design Generative AI
Free with trial Growth and reduction arrow, up and down, line icon set. Rise and fall, increase and decrease. Graphic signs. Vector flat illustration. Line financial growth decrease illustrations Growth and reduction arrow, up and down, line icon set. Rise and fall, increase and decrease. Graphic signs. Vector illustration
Free with trial Line Graph Trend Analysis Line And Solid Icon Set. Data Visualization, Business Growth, Statistical Analysis Symbol Collection. Financial And Market Insights. Isolated Vector Illustration. Line financial growth decrease vectors Line Graph Trend Analysis Line And Solid Icon Set. Data Visualization, Business Growth, Statistical Analysis Symbol
Free with trial An detailed set of stock market financial trends and business growth line icons for data analysis and reporting. Line financial growth decrease vectors Stock market financial trends and business growth line icons
Free with trial Detailed illustration featuring a variety of hand drawn style financial charts and data analysis line icons including growth curves and market trends. Line financial growth decrease vectors Collection of business data and financial analytics line icons. detailed illustration featuring a variety of hand drawn style financial charts and data analysis line icons including growth curves and market trends
Free with trial A collection of simple, business and growth icons, perfect for financial reports, websites, or presentations on market trends and data. The set features a clean, minimal, thin line style. Line financial growth decrease vectors Simple business and growth icons set, thin line style, minimal vector illustration perfect for financial reports, websites, or pre. A collection of simple, business and growth icons, perfect for financial reports, websites, or presentations on market trends and data. The set features a clean, minimal, thin line style.
Free with trial The image illustrates a combination of bar and line graphs to represent business performance trends. The bars show an overall upward trend in growth, while the red line indicates a recent decline after a period of increase. This visualization is often used in financial reports, market analysis, or business presentations to depict fluctuations in data over time, such as revenue, market share, or. Line financial growth decrease illustrations Growth and decline in business performance visualized with bar and line graphs. The image illustrates a combination of bar and line graphs to represent business performance trends. The bars show an overall upward trend in growth, while the red line indicates a recent decline after a period of increase. This visualization is often used in financial reports, market analysis, or business presentations to depict fluctuations in data over time, such as revenue, market share, or
Free with trial The image features two yellow piggy banks, one with a bar graph indicating growth and the other surrounded by coins with a downward line graph, symbolizing financial concepts such as savings, investment, and market fluctuations. Line financial growth decrease illustrations Financial growth and market fluctuations illustrated with piggy banks and graphs. The image features two yellow piggy banks, one with a bar graph indicating growth and the other surrounded by coins with a downward line graph, symbolizing financial concepts such as savings, investment, and market fluctuations
Free with trial This is an detailed collection of financial icons depicting various stock market trends, growth curves, and data analysis patterns. Line financial growth decrease vectors Financial data and stock market trend line icons set showing growth and volatility curves. This is an detailed collection of financial icons depicting various stock market trends, growth curves, and data analysis patterns
Free with trial Line art business trend icons set featuring growth and decline bar charts for financial data visualization. Line financial growth decrease vectors Line art business trend icons set featuring growth and decline bar charts for financial data visualization
Free with trial Line art business graphs set featuring financial growth and decline with dollar signs for economic performance. Line financial growth decrease vectors Line art business graphs set featuring financial growth and decline with dollar signs for economic performance
Free with trial Hand drawn line art illustration of financial analysis depicting growth and market trends for business strategy. Line financial growth decrease vectors Hand drawn line art illustration of financial analysis depicting growth and market trends for business strategy
Free with trial Abstract blue 3D bar chart with glowing line graph shows market growth. Digital data visualization indicates positive trend. Financial analysis graphic, with bokeh. Line financial growth decrease illustrations Abstract blue 3D bar chart with glowing line graph shows market growth. Digital data visualization indicates positive trend.
Free with trial Colorful bar chart with a line graph presenting trends and data growth over time, ideal for business analysis, marketing presentations, and financial reports. Line financial growth decrease illustrations Colorful Bar Chart with Line Graph Illustrating Trends and Data Growth over Time For Business, Marketing, Finance and Analysis Use. Colorful bar chart with a line graph presenting trends and data growth over time, ideal for business analysis, marketing presentations, and financial reports
Free with trial Set line Mobile phone Magnifying glass with check mark Laptop browser window Secure your site HTTPS SSL Financial growth decrease Browser shield and Online shopping screen icon. Vector. Line financial growth decrease illustrations Set line Mobile phone, Magnifying glass with check mark, Laptop browser window, Secure your site HTTPS, SSL, Financial. Set line Mobile phone Magnifying glass with check mark Laptop browser window Secure your site HTTPS SSL Financial growth decrease Browser shield and Online shopping screen icon. Vector.
Free with trial A visually striking image capturing a bar chart, line graph, and pie chart meticulously drawn in the wet sand on a beach. The artwork is illuminated by the warm, golden light of a sunset, with gentle waves lapping at the shore. This represents concepts of financial growth, market analysis, and business success in a unique, natural setting. The image evokes themes of planning, progress, and the cyclical nature of markets. Line financial growth decrease illustrations Financial Growth Chart and Pie Chart Drawn in Sand at Sunset. A visually striking image capturing a bar chart, line graph, and pie chart meticulously drawn in the wet sand on a beach. The artwork is illuminated by the warm, golden light of a sunset, with gentle waves lapping at the shore. This represents concepts of financial growth, market analysis, and business success in a unique, natural setting. The image evokes themes of planning, progress, and the cyclical nature of markets.
Free with trial This minimalist vector illustration features two identical line graphs, presented in contrasting black and white themes. The left graph displays a black line on a white background, while the right shows a white line on a black background. Both graphs depict a clear downward trend with jagged fluctuations, symbolizing decline, loss, or negative growth over time. This versatile icon set is ideal for illustrating concepts such as economic downturns, financial losses, market crashes, business failures, or any data showing a significant decrease. Perfect for presentations, reports, infographics, and web design. Line financial growth decrease vectors Declining Line Graph Icon Set - Black and White. This minimalist vector illustration features two identical line graphs, presented in contrasting black and white themes. The left graph displays a black line on a white background, while the right shows a white line on a black background. Both graphs depict a clear downward trend with jagged fluctuations, symbolizing decline, loss, or negative growth over time. This versatile icon set is ideal for illustrating concepts such as economic downturns, financial losses, market crashes, business failures, or any data showing a significant decrease. Perfect for presentations, reports, infographics, and web design.
Free with trial A collection of twelve black and white vector icons representing various financial concepts. The set includes bar charts and line graphs illustrating growth and trends, a piggy bank for savings, bank buildings symbolizing financial institutions, a safe for security, currency symbols (dollar, euro, yen), and credit debit cards for payments. These icons are ideal for websites, presentations, and applications related to finance, economics, business, and personal money management. Line financial growth decrease vectors Financial Icons Set: Growth, Savings, Banking, and Payments. A collection of twelve black and white vector icons representing various financial concepts. The set includes bar charts and line graphs illustrating growth and trends, a piggy bank for savings, bank buildings symbolizing financial institutions, a safe for security, currency symbols (dollar, euro, yen), and credit debit cards for payments. These icons are ideal for websites, presentations, and applications related to finance, economics, business, and personal money management.
Free with trial This image displays a dynamic business analytics dashboard featuring both bar and line graphs. The bar chart illustrates varying percentages (15%, 50%, 75%, 85%), suggesting performance metrics or growth stages. The line chart, with its intersecting blue lines and data points, represents trends, fluctuations, and comparisons over time or across different categories. The clean, modern design makes it ideal for financial reports, business presentations, and data visualization concepts. Line financial growth decrease illustrations Business Growth and Performance Analysis with Bar and Line Charts. This image displays a dynamic business analytics dashboard featuring both bar and line graphs. The bar chart illustrates varying percentages (15%, 50%, 75%, 85%), suggesting performance metrics or growth stages. The line chart, with its intersecting blue lines and data points, represents trends, fluctuations, and comparisons over time or across different categories. The clean, modern design makes it ideal for financial reports, business presentations, and data visualization concepts.
Free with trial Business Analytics And Data Visualization Line Icon Set. Financial Growth, Market Trends, And Performance Analysis Outline Symbol Collection. Editable Stroke. Isolated Vector Illustration. Line financial growth decrease vectors Business Analytics And Data Visualization Line Icon Set. Financial Growth, Market Trends, And Performance Analysis
Free with trial Financial chart graphic with coins, blue bar graph, blurred orange line chart. Business profit, income growth, investment, financial analysis, marketing, economic saving money concept. Line financial growth decrease illustrations Financial chart graphic with coins, blue bar graph, blurred orange line chart. Business profit, income growth, investment
Free with trial Set line Website with stocks market Search engine Browser setting Financial growth increase window Photo retouching and mail and icon. Vector. Line financial growth decrease vectors Set line Website with stocks market, Search engine, Browser setting, Financial growth increase, window, Photo retouching. Set line Website with stocks market Search engine Browser setting Financial growth increase window Photo retouching and mail and icon. Vector.
Free with trial Set line Digital speed meter Arrow Financial growth Dollar symbol Mountains with flag and Intersection point icon. Vector. Line financial growth decrease vectors Set line Digital speed meter, Arrow, Financial growth, Dollar symbol, Mountains with flag, and Intersection point icon
Free with trial A comprehensive set of vector line icons depicting bull and bear market trends. This collection features various combinations of bull and bear silhouettes integrated with financial charts, including rising and falling line graphs and bar graphs. Each icon clearly symbolizes either a bullish market (growth, upward trend) or a bearish market (decline, downward trend). Ideal for financial websites, trading applications, investment presentations, economic reports, infographics, and educational materials illustrating stock market dynamics and investment strategies. Line financial growth decrease vectors Bull and Bear Market Stock Trading Line Icons Set. A comprehensive set of vector line icons depicting bull and bear market trends. This collection features various combinations of bull and bear silhouettes integrated with financial charts, including rising and falling line graphs and bar graphs. Each icon clearly symbolizes either a bullish market (growth, upward trend) or a bearish market (decline, downward trend). Ideal for financial websites, trading applications, investment presentations, economic reports, infographics, and educational materials illustrating stock market dynamics and investment strategies.
Free with trial Money line icons. Settings gear, Message, Inflation icons. Finance, revenue reduction and financial benefit set. Economy, money savings and increase profit line icons. Vector. Line financial growth decrease vectors Money line icons. Finance, revenue reduction and financial benefit. App line icons. Vector. Money line icons. Settings gear, Message, Inflation icons. Finance, revenue reduction and financial benefit set. Economy, money savings and increase profit line icons. Vector
Free with trial A simple and clean line art icon of a graph, isolated on a white background. This vector illustration features a line chart with axes, showing a fluctuating trend with distinct data points. The minimalist design makes it perfect for various applications related to business, finance, and data analysis. Ideal for use in presentations, infographics, websites, mobile apps, and user interfaces to represent concepts like statistics, growth, market trends, performance reports, and financial analytics. A versatile symbol for progress and data visualization. Line financial growth decrease illustrations Analytics Line Graph Vector Icon. A simple and clean line art icon of a graph, isolated on a white background. This vector illustration features a line chart with axes, showing a fluctuating trend with distinct data points. The minimalist design makes it perfect for various applications related to business, finance, and data analysis. Ideal for use in presentations, infographics, websites, mobile apps, and user interfaces to represent concepts like statistics, growth, market trends, performance reports, and financial analytics. A versatile symbol for progress and data visualization.
Free with trial Stacks of gold coins are arranged in a triangular formation on a white background. Above them, a large, upward-pointing arrow signifies growth and financial prosperity. The coins and arrow are illustrated in a uniform golden hue, symbolizing wealth and economic advancement. Line financial growth decrease vectors Financial Growth Concept with Stacks of Gold Coins and Upward Arrow. Financial Growth Gold Coins. Growth Chart. Stacks of gold coins are arranged in a triangular formation on a white background. Above them, a large, upward-pointing arrow signifies growth and financial prosperity. The coins and arrow are illustrated in a uniform golden hue, symbolizing wealth and economic advancement.
Free with trial A simple and clean line graph icon illustration, perfect for illustrating financial data, growth charts, and statistical analysis. Ideal for use in presentations, reports, and websites. Line financial growth decrease vectors Minimalist Line Graph Icon Design for Financial Data Analysis Presentation. A simple and clean line graph icon illustration, perfect for illustrating financial data, growth charts, and statistical analysis. Ideal for use in presentations, reports, and websites.
Free with trial A comprehensive collection of flat line design icons representing key concepts in business, finance, and data analytics. The set includes various charts (bar, line, pie), a speedometer, a magnifying glass with a graph, financial documents with checkmarks, a target with an arrow, a dollar sign, a percentage symbol, and directional arrows for growth and decline. These versatile vector elements are ideal for presentations, reports, websites, and applications focused on statistics, performance, strategy, and financial insights. Line financial growth decrease illustrations Business and Data Analytics Flat Line Icons Set. A comprehensive collection of flat line design icons representing key concepts in business, finance, and data analytics. The set includes various charts (bar, line, pie), a speedometer, a magnifying glass with a graph, financial documents with checkmarks, a target with an arrow, a dollar sign, a percentage symbol, and directional arrows for growth and decline. These versatile vector elements are ideal for presentations, reports, websites, and applications focused on statistics, performance, strategy, and financial insights.
Free with trial This comprehensive vector illustration features a set of 18 flat icons depicting various financial trends, market indicators, and warning signals. The collection includes rising and falling line graphs, bar charts, currency symbols (dollar and euro) indicating fluctuations, and alert symbols like sirens and exclamation marks. Ideal for illustrating concepts of economic growth, decline, market volatility, financial crisis, investment risks, and business performance. Perfect for presentations, reports, websites, and applications related to finance, economics, and stock markets. Line financial growth decrease vectors Financial Trends, Market Indicators and Crisis Alert Icons Set. This comprehensive vector illustration features a set of 18 flat icons depicting various financial trends, market indicators, and warning signals. The collection includes rising and falling line graphs, bar charts, currency symbols (dollar and euro) indicating fluctuations, and alert symbols like sirens and exclamation marks. Ideal for illustrating concepts of economic growth, decline, market volatility, financial crisis, investment risks, and business performance. Perfect for presentations, reports, websites, and applications related to finance, economics, and stock markets.
Free with trial This image illustrates a bar graph showing an upward trend in financial growth, accompanied by a line graph depicting market fluctuations over time. Line financial growth decrease illustrations Graphical representation of financial growth and fluctuation. This image illustrates a bar graph showing an upward trend in financial growth, accompanied by a line graph depicting market fluctuations over time
Free with trial A circular icon containing a stylized representation of financial data. The icon features a series of black vertical bars of varying heights, suggesting a bar chart. Overlaid on the bars are two thin lines, one black and one grey, depicting line graphs with peaks and troughs, indicating fluctuating trends. The overall design is minimalist and symbolic, suitable for representing business analytics. Line financial growth decrease illustrations Circular Graph Icon with Bar and Line Charts Representing Financial Data and Trends business. A circular icon containing a stylized representation of financial data. The icon features a series of black vertical bars of varying heights, suggesting a bar chart. Overlaid on the bars are two thin lines, one black and one grey, depicting line graphs with peaks and troughs, indicating fluctuating trends. The overall design is minimalist and symbolic, suitable for representing business analytics
Free with trial A 3D render illustrating a concept of financial decline and economic recession. The image features a red bar chart with progressively shorter bars, indicating a downward trend. A bold, red arrow follows this negative trajectory, pointing sharply downwards. Set against a clean, neutral gray background, this graphic powerfully symbolizes concepts like business failure, stock market crash, investment loss, sales decrease, and economic crisis. It's a perfect visual for presentations, reports, and articles discussing financial downturns, poor performance, and negative growth. Line financial growth decrease illustrations Financial Decline Graph with Red Arrow Down. A 3D render illustrating a concept of financial decline and economic recession. The image features a red bar chart with progressively shorter bars, indicating a downward trend. A bold, red arrow follows this negative trajectory, pointing sharply downwards. Set against a clean, neutral gray background, this graphic powerfully symbolizes concepts like business failure, stock market crash, investment loss, sales decrease, and economic crisis. It's a perfect visual for presentations, reports, and articles discussing financial downturns, poor performance, and negative growth.
Free with trial This image features a minimalist and modern vector icon of a jagged downward trending line graph, sharply declining from left to right, symbolizing financial loss, economic downturn, or market decline, set against a clean and uncluttered white background suitable for use in presentations, reports, infographics, or digital media to visually communicate negative trends or decreasing performance. Line financial growth decrease illustrations Sharp downward trending line graph icon isolated on white background representing financial loss or market decline vector. This image features a minimalist and modern vector icon of a jagged downward trending line graph, sharply declining from left to right, symbolizing financial loss, economic downturn, or market decline, set against a clean and uncluttered white background suitable for use in presentations, reports, infographics, or digital media to visually communicate negative trends or decreasing performance
Free with trial Black and red arrow pointing downward on financial graph showing a decline. Business growth chart with falling trend line for investment analysis. Line financial growth decrease illustrations Black and red arrow pointing downward on financial graph showing a decline
Free with trial Set line Secure your site with HTTPS SSL Browser window Cloud technology data transfer Online play video Photo retouching Financial growth decrease and Digital speed meter icon. Vector. Line financial growth decrease illustrations Set line Secure your site with HTTPS, SSL, Browser window, Cloud technology data transfer, Online play video, Photo. Set line Secure your site with HTTPS SSL Browser window Cloud technology data transfer Online play video Photo retouching Financial growth decrease and Digital speed meter icon. Vector.
Free with trial Collection of business growth and financial analysis icons featuring bar charts and arrows with editable line art and flat shape style. Editable vector icon set. Line financial growth decrease vectors Collection of business growth and financial analysis icons featuring bar charts and arrows with editable line art and flat shape
Free with trial Abstract 3D render of a financial growth chart. The image features a series of vertical bars, some in teal and others in orange, representing data points on a graph. The bars increase in height towards the right, suggesting positive growth or progress. The chart is set against a dark background with a subtle grid pattern and a reflective surface, adding depth and visual interest. Suitable for illustrating financial reports, market analysis, or business trends. Line financial growth decrease illustrations Abstract Financial Growth Chart. Abstract 3D render of a financial growth chart. The image features a series of vertical bars, some in teal and others in orange, representing data points on a graph. The bars increase in height towards the right, suggesting positive growth or progress. The chart is set against a dark background with a subtle grid pattern and a reflective surface, adding depth and visual interest. Suitable for illustrating financial reports, market analysis, or business trends.
Free with trial A collage of various hand-drawn charts and graphs in shades of blue, illustrating business growth, data analysis, and financial trends. The collection includes bar charts, line graphs, and pie charts, all rendered with a sketchy, artistic style. These visuals are perfect for presentations, reports, or any project requiring a dynamic and informative representation of data and progress. Line financial growth decrease illustrations Hand-Drawn Business Growth Charts and Graphs Collection. A collage of various hand-drawn charts and graphs in shades of blue, illustrating business growth, data analysis, and financial trends. The collection includes bar charts, line graphs, and pie charts, all rendered with a sketchy, artistic style. These visuals are perfect for presentations, reports, or any project requiring a dynamic and informative representation of data and progress.
Free with trial Financial analysis scene showing colorful graphs and charts with a wooden block displaying a house icon and the year 2026, conveying real estate market growth and investment trends, ideal for finance and real estate marketing materials. Line financial growth decrease illustrations Financial Growth Charts with Wooden House Block and Year 2026. Financial analysis scene showing colorful graphs and charts with a wooden block displaying a house icon and the year 2026, conveying real estate market growth and investment trends, ideal for finance and real estate marketing materials
Free with trial This image showcases a comprehensive collection of blue bar graphs and line graphs, presented in a grid format. Each graph depicts various data trends, including upward and downward movements, fluctuating patterns, and steady growth. The clean, modern design makes these icons ideal for representing financial data, market analysis, performance metrics, and business growth in presentations, reports, and websites. Line financial growth decrease illustrations Collection of Blue Bar and Line Graphs for Business Analytics. This image showcases a comprehensive collection of blue bar graphs and line graphs, presented in a grid format. Each graph depicts various data trends, including upward and downward movements, fluctuating patterns, and steady growth. The clean, modern design makes these icons ideal for representing financial data, market analysis, performance metrics, and business growth in presentations, reports, and websites.
Free with trial Green arrow pointing downward on financial graph. Business chart with falling trend line. Digital stock market data visualization for investment analysis. Line financial growth decrease illustrations Green arrow pointing downward on financial graph. Business chart with falling trend line
Free with trial Illustration of a smartphone displaying financial charts and a stack of gold coins with dollar signs. Arrows circulate around the phone, suggesting a cycle of investment and growth. The image represents mobile banking, online trading, and the potential for financial success through digital platforms. Line financial growth decrease illustrations Mobile Investment and Financial Growth. Illustration of a smartphone displaying financial charts and a stack of gold coins with dollar signs. Arrows circulate around the phone, suggesting a cycle of investment and growth. The image represents mobile banking, online trading, and the potential for financial success through digital platforms.
Free with trial Illustration of a hand holding a magnifying glass over a financial chart showing business growth and success. The image represents data analysis, investment strategy, and market trends in a visually appealing way. Line financial growth decrease illustrations Business Growth Analysis Magnifying Glass on Financial Chart. Illustration of a hand holding a magnifying glass over a financial chart showing business growth and success. The image represents data analysis, investment strategy, and market trends in a visually appealing way.
Free with trial Financial Growth Chart on a Suitcase Business Investment Economy Graphic Illustration. Line financial growth decrease vectors Financial Growth Chart on a Suitcase Business Investment Economy Graphic Illustration
Free with trial Business data is visually represented in black and white through various charts and graphs illustrating growth analysis and strategic planning for financial reporting showing a clear picture of market. Line financial growth decrease vectors Black and white business data visualization with charts and graphs showing growth and analysis for financial reporting and. Business data is visually represented in black and white through various charts and graphs illustrating growth analysis and strategic planning for financial reporting showing a clear picture of market
Free with trial A flat, cartoon-style line graph on a white grid background shows a green upward-pointing arrow representing growth and a red downward-pointing arrow indicating decline, with a red dollar sign placed atop the green arrow to symbolize financial gain, illustrating contrasting economic trends in a simplified, visually engaging manner ideal for business, finance, and investment-related content that. Line financial growth decrease illustrations Upward and downward financial trend with green and red arrows on grid graph. A flat, cartoon-style line graph on a white grid background shows a green upward-pointing arrow representing growth and a red downward-pointing arrow indicating decline, with a red dollar sign placed atop the green arrow to symbolize financial gain, illustrating contrasting economic trends in a simplified, visually engaging manner ideal for business, finance, and investment-related content that
Free with trial A close-up shot of a printed financial report showing market fluctuations indicated by a red line graph. Line financial growth decrease illustrations A financial document showing a fluctuating red line graph displayed. A close-up shot of a printed financial report showing market fluctuations indicated by a red line graph
Free with trial A clean and modern vector illustration of a line graph, isolated on a white background. This flat design icon features two distinct lines, one blue and one brown, plotting various data points to show trends and comparisons over time. It's a versatile graphic representing concepts like data analysis, business analytics, financial statistics, market research, and performance tracking. Ideal for use in presentations, infographics, websites, business reports, and marketing materials to visualize progress, growth, or economic fluctuations. Line financial growth decrease vectors Data Analysis Line Graph Icon. A clean and modern vector illustration of a line graph, isolated on a white background. This flat design icon features two distinct lines, one blue and one brown, plotting various data points to show trends and comparisons over time. It's a versatile graphic representing concepts like data analysis, business analytics, financial statistics, market research, and performance tracking. Ideal for use in presentations, infographics, websites, business reports, and marketing materials to visualize progress, growth, or economic fluctuations.
Free with trial A clean, minimalist illustration featuring a combined line graph and bar chart on a white background. The line graph, with circular data points, shows an upward trend with fluctuations. It is overlaid on a series of vertical bars, alternating in black and white, representing discrete data values. The grid lines behind the charts suggest a data analysis or financial context. This graphic is ideal for presentations, reports, and websites related to statistics, business growth, market trends, and data visualization. Line financial growth decrease vectors Line and Bar Chart Combination. A clean, minimalist illustration featuring a combined line graph and bar chart on a white background. The line graph, with circular data points, shows an upward trend with fluctuations. It is overlaid on a series of vertical bars, alternating in black and white, representing discrete data values. The grid lines behind the charts suggest a data analysis or financial context. This graphic is ideal for presentations, reports, and websites related to statistics, business growth, market trends, and data visualization.