Free with trial Infographic flow chart template with 2 option circles and 6 tabs. Modern minimalistic vector banner that can be used as diagram, graph, table, workflow layout for web, report, business presentation. Linear process infographic vertical vectors Infographic flow chart template with 2 option circles and 6 tabs
Free with trial Infographic process flow chart. Clean minimalistic vector template. Can be used as diagram, graph, chart, workflow layout for web, report, business presentation. Linear process infographic vertical vectors Infographic process flow chart. Clean minimalistic vector template.
Free with trial Vertical steps, infographic elements. Outline colorful menu for app interface. Number options. Web design of buttons elements. Infographics 1. 2. 3. Vector step icons. Linear process infographic vertical vectors Vertical steps, infographic elements. Outline colorful menu for app interface. Number options. Web design of buttons
Free with trial Vertical timeline template with five arrows, infographic template for web, business, presentations, workflow or process diagram. Linear process infographic vertical vectors Timeline Infographics. Vertical timeline template with five arrows, infographic template for web, business, presentations, workflow or process diagram
Free with trial Vertical timeline or planner, 4 round elements with linear symbols inside, time indication, description and clock on top. Concept of daily planning. Infographic design template. Vector illustration. Linear process infographic vertical vectors Creative infographic design template. Vertical timeline or planner, 4 round elements with linear symbols inside, time indication, description and clock on top. Concept of daily planning. Infographic design template. Vector illustration.
Free with trial Vertical steps, infographic elements. Outline colorful menu for app interface. Number options. Web design of buttons elements. Infographics 1. 2. 3. Vector step icons. Linear process infographic vertical vectors Vertical steps, infographic elements. Outline colorful menu for app interface. Number options. Web design of buttons
Free with trial Vertical steps, infographic elements. Outline colorful menu for app interface. Number options. Web design of buttons elements. Infographics 1. 2. 3. Vector step icons. Linear process infographic vertical vectors Vertical steps, infographic elements. Outline colorful menu for app interface. Number options. Web design of buttons
Free with trial Four tape-like arrows or poiners, linear icons and text boxes placed. Concept of business process with 4 steps. Colorful infographic design template. Vector illustration for brochure, presentation. Linear process infographic vertical vectors Concept of business process with 4 steps
Free with trial Vertical steps, infographic elements. Outline colorful menu for app interface. Number options. Web design of buttons elements. Infographics 1. 2. 3. Vector step icons. Linear process infographic vertical vectors Vertical steps, infographic elements. Outline colorful menu for app interface. Number options. Web design of buttons
Free with trial Vertical timeline or schedule, 5 square elements with thin line symbols inside and arrows pointing at time and description. Creative infographic design template. Vector illustration for presentation. Linear process infographic vertical vectors Creative infographic design template
Free with trial Timeline, 4 square paper white elements with linear icons and year indication inside placed into vertical row and connected by dotted lines. Creative infographic design template. Vector illustration. Linear process infographic vertical vectors Modern infographic design template. Timeline, 4 square paper white elements with linear icons and year indication inside placed into vertical row and connected by dotted lines. Creative infographic design template. Vector illustration.
Free with trial Step by step pink vertical infographic template with 4 steps, options, parts or processes. Linear process infographic vertical vectors Vector business template for presentation. Step by step pink vertical infographic template with 4 steps, options, parts or processes
Free with trial Software release management process blue and yellow brochure template. Leaflet design with linear icons. Editable 4 vector layouts for presentation, annual reports. Questrial, Lato-Regular fonts used. Linear process infographic vertical vectors Software release management process blue and yellow brochure template
Free with trial Three circular paper white elements with thin line icons inside placed one below other and place for text. List with 3 options to choose. Abstract infographic design template. Vector illustration. Linear process infographic vertical vectors Modern Infographic Template. Three circular paper white elements with thin line icons inside placed one below other and place for text. List with 3 options to choose. Abstract infographic design template. Vector illustration.
Free with trial Tree diagram or vertical timeline with dollar coins at bottom, interconnected round elements with linear symbols and text boxes. Concept of money investment, annual profit. Vector illustration. Linear process infographic vertical vectors Modern Infographic Vector Template. Tree diagram or vertical timeline with dollar coins at bottom, interconnected round elements with linear symbols and text boxes. Concept of money investment, annual profit. Vector illustration.
Free with trial Cost reduction brochure template. Decrease market value of product. Flyer, booklet, leaflet print, cover design with linear icons. Vector layouts for magazines, annual reports, advertising posters. Linear process infographic vertical vectors Cost reduction brochure template
Free with trial Factoring blue and yellow brochure template. Process, benefits. Leaflet design with linear icons. Editable 4 vector layouts for presentation, annual reports. Questrial, Lato-Regular fonts used. Linear process infographic vertical vectors Factoring blue and yellow brochure template
Free with trial Retrieval augmented generation blue brochure template. Generative AI models optimization. Leaflet design with linear icons. Editable 4 vector layouts. Arial-Black, Myriad Pro-Regular fonts used. Linear process infographic vertical vectors Retrieval augmented generation blue brochure template
Free with trial What is upcycling brochure template. Recycling of waste. Flyer, booklet, leaflet print, cover design with linear icons. Vector layouts for presentation, annual reports, advertisement pages. Linear process infographic vertical vectors What is upcycling brochure template
Free with trial Four colorful ribbon-like bookmarks, thin line symbols and text boxes. Concept of list with 4 options to choose. Creative infographic design template. Vector illustration for presentation, report. Linear process infographic vertical vectors Concept of list with 4 options to choose
Free with trial HR management brochure template. Recruitment process. Booklet print design with linear icons. Vector layouts for presentation, annual reports, ads. Arial-Black, Myriad Pro-Regular fonts used. Linear process infographic vertical vectors HR management brochure template
Free with trial IT automation yellow, blue brochure template. Computer program. Booklet print design with linear icons. Vector layouts for presentation, annual reports, ads. Arial Black, Myriad Pro Regular fonts used. Linear process infographic vertical vectors IT automation yellow, blue brochure template
Free with trial Purchase planning blue brochure template. Inventory management. Leaflet design with linear icons. Editable 4 vector layouts for presentation, annual reports. Arial-Black, Myriad Pro-Regular fonts used. Linear process infographic vertical vectors Purchase planning blue brochure template
Free with trial Business tools benefits brochure template. Improve efficiency. Booklet print design with linear icons. Vector layouts for presentation, annual reports, ads. Arial-Black, Myriad Pro-Regular fonts used. Linear process infographic vertical vectors Business tools benefits brochure template
Free with trial Recovering after divorce blue and yellow brochure template. Booklet print design with linear icons. Vector layouts for presentation, annual reports, ads. Questrial-Regular, Lato-Regular fonts used. Linear process infographic vertical vectors Recovering after divorce blue and yellow brochure template
Free with trial List vertical stacked process infographic outline style with 4 point template with creative line container reverse with line dot connector for slide presentation vector. Linear process infographic vertical illustrations List vertical stacked process infographic outline style with 4 point template with creative line container reverse with line dot
Free with trial List vertical stacked process infographic outline style with 3 point template with piechart slice with dot line separator for slide presentation vector. Linear process infographic vertical illustrations List vertical stacked process infographic outline style with 3 point template with piechart slice with dot line separator for
Free with trial List vertical stacked process infographic outline style with 3 point template with round rectangle box with flipped line for slide presentation vector. Linear process infographic vertical illustrations List vertical stacked process infographic outline style with 3 point template with round rectangle box with flipped line for slide
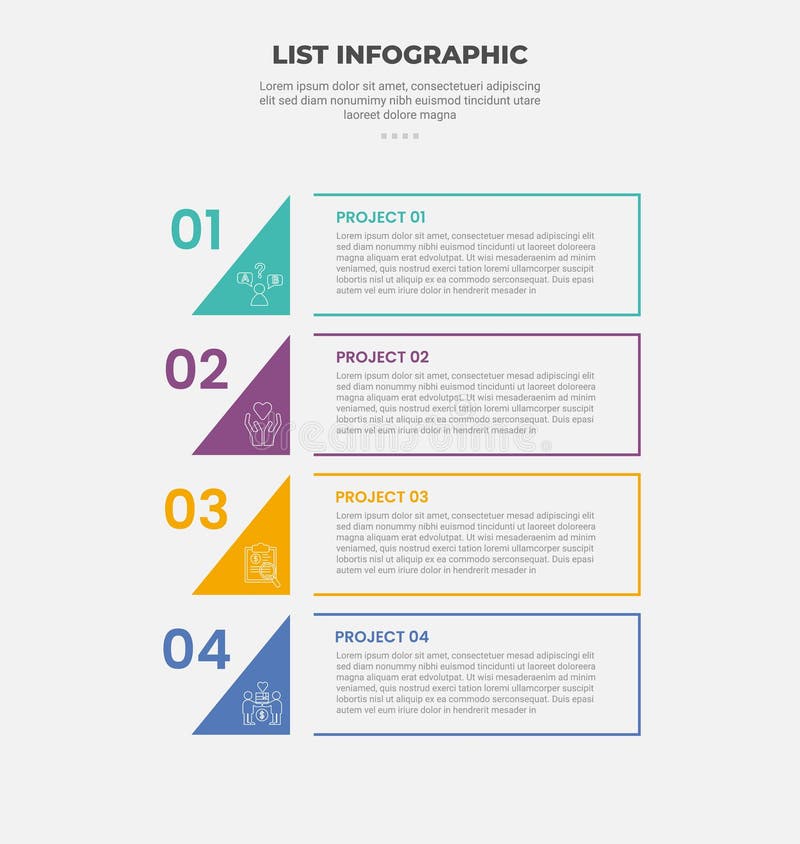
Free with trial List vertical stacked process infographic outline style with 4 point template with open rectangle cut with round badge on left for slide presentation vector. Linear process infographic vertical illustrations List vertical stacked process infographic outline style with 4 point template with open rectangle cut with round badge on left for
Free with trial List vertical stacked process infographic outline style with 4 point template with round rectangle container with circle badge for slide presentation vector. Linear process infographic vertical illustrations List vertical stacked process infographic outline style with 4 point template with round rectangle container with circle badge for
Free with trial List vertical stacked process infographic outline style with 3 point template with creative ribbon flipped on square badge for slide presentation vector. Linear process infographic vertical illustrations List vertical stacked process infographic outline style with 3 point template with creative ribbon flipped on square badge for
Free with trial List vertical stacked process infographic outline style with 4 point template with creative sharp edge arrow with vertical badge for slide presentation vector. Linear process infographic vertical illustrations List vertical stacked process infographic outline style with 4 point template with creative sharp edge arrow with vertical badge
Free with trial List vertical stacked process infographic outline style with 4 point template with round rectangle container box with badge percentage for slide presentation vector. Linear process infographic vertical illustrations List vertical stacked process infographic outline style with 4 point template with round rectangle container box with badge
Free with trial List vertical stacked process infographic outline style with 3 point template with creative ribbon badge with skew rectangle container for slide presentation vector. Linear process infographic vertical illustrations List vertical stacked process infographic outline style with 3 point template with creative ribbon badge with skew rectangle
Free with trial List vertical stacked process infographic outline style with 4 point template with round rectangle container with swirl smooth badge for slide presentation vector. Linear process infographic vertical illustrations List vertical stacked process infographic outline style with 4 point template with round rectangle container with swirl smooth
Free with trial List vertical stacked process infographic outline style with 3 point template with round rectangle box container for slide presentation vector. Linear process infographic vertical illustrations List vertical stacked process infographic outline style with 3 point template with round rectangle box container for slide
Free with trial List vertical stacked process infographic outline style with 3 point template with creative arrow badge combination for slide presentation vector. Linear process infographic vertical illustrations List vertical stacked process infographic outline style with 3 point template with creative arrow badge combination for slide
Free with trial List vertical stacked process infographic outline style with 4 point template with arrow box container for slide presentation vector. Linear process infographic vertical illustrations List vertical stacked process infographic outline style with 4 point template with arrow box container for slide presentation
Free with trial List vertical stacked process infographic outline style with 3 point template with arrow ribbon flipped right direction for slide presentation vector. Linear process infographic vertical illustrations List vertical stacked process infographic outline style with 3 point template with arrow ribbon flipped right direction for slide
Free with trial List vertical stacked process infographic outline style with 4 point template with round rectangle container with circle badge on left for slide presentation vector. Linear process infographic vertical illustrations List vertical stacked process infographic outline style with 4 point template with round rectangle container with circle badge on
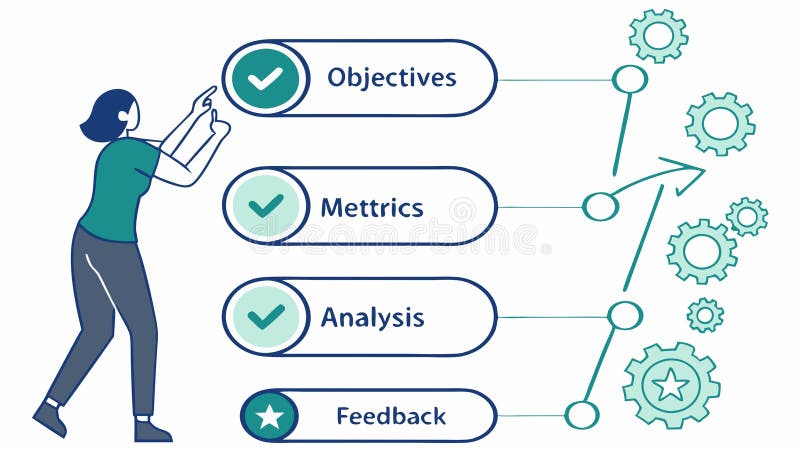
Free with trial A clear vector infographic illustrating a vertical evaluation process with steps for objectives, metrics, analysis, and feedback. Ideal for project management, performance reviews, and educational content on structured assessment. Provides a linear visual guide for improvement, vector design Generative AI. Linear process infographic vertical vectors Vertical Evaluation Process, Project Management Steps, vector design Generative AI. A clear vector infographic illustrating a vertical evaluation process with steps for objectives, metrics, analysis, and feedback. Ideal for project management, performance reviews, and educational content on structured assessment. Provides a linear visual guide for improvement, vector design Generative AI
Free with trial List vertical stacked process infographic outline style with 4 point template with open outline container with vertical timeline for slide presentation vector. Linear process infographic vertical illustrations List vertical stacked process infographic outline style with 4 point template with open outline container with vertical timeline
Free with trial List vertical stacked process infographic outline style with 3 point template with flipped ribbon style with round rectangle container for slide presentation vector. Linear process infographic vertical illustrations List vertical stacked process infographic outline style with 3 point template with flipped ribbon style with round rectangle
Free with trial List vertical stacked process infographic outline style with 3 point template with calendar style with line separator for slide presentation vector. Linear process infographic vertical illustrations List vertical stacked process infographic outline style with 3 point template with calendar style with line separator for slide
Free with trial List vertical stacked process infographic outline style with 4 point template with round rectangle arrow with circle badge for slide presentation vector. Linear process infographic vertical illustrations List vertical stacked process infographic outline style with 4 point template with round rectangle arrow with circle badge for
Free with trial List vertical stacked process infographic outline style with 4 point template with creative rectangle container with separated badge for slide presentation vector. Linear process infographic vertical illustrations List vertical stacked process infographic outline style with 4 point template with creative rectangle container with separated
Free with trial List vertical stacked process infographic outline style with 3 point template with creative slice cut badge with line separator for slide presentation vector. Linear process infographic vertical illustrations List vertical stacked process infographic outline style with 3 point template with creative slice cut badge with line separator
Free with trial List vertical stacked process infographic outline style with 3 point template with round rectangle with circle badge for slide presentation vector. Linear process infographic vertical illustrations List vertical stacked process infographic outline style with 3 point template with round rectangle with circle badge for slide
Free with trial List vertical stacked process infographic outline style with 3 point template with round rectangle box with arrow triangle badge for slide presentation vector. Linear process infographic vertical illustrations List vertical stacked process infographic outline style with 3 point template with round rectangle box with arrow triangle badge
Free with trial List vertical stacked process infographic outline style with 3 point template with creative container rectangle with round badge on left for slide presentation vector. Linear process infographic vertical illustrations List vertical stacked process infographic outline style with 3 point template with creative container rectangle with round badge
Free with trial List vertical stacked process infographic outline style with 3 point template with skew line with round rectangle badge for slide presentation vector. Linear process infographic vertical illustrations List vertical stacked process infographic outline style with 3 point template with skew line with round rectangle badge for slide
Free with trial List vertical stacked process infographic outline style with 4 point template with round rectangle box with small square badge for slide presentation vector. Linear process infographic vertical illustrations List vertical stacked process infographic outline style with 4 point template with round rectangle box with small square badge for
Free with trial List vertical stacked process infographic outline style with 4 point template with creative triangle with rectangle sharp edge for slide presentation vector. Linear process infographic vertical illustrations List vertical stacked process infographic outline style with 4 point template with creative triangle with rectangle sharp edge for
Free with trial List vertical stacked process infographic outline style with 4 point template with round rectangle container with vertical badge for slide presentation vector. Linear process infographic vertical illustrations List vertical stacked process infographic outline style with 4 point template with round rectangle container with vertical badge
Free with trial Healthcare data optimization linear infographic template. Medical technology. Data visualization with 4 steps. Empty process vector design. Editable blank options info graphics. Lexend font used. Linear process infographic vertical illustrations Healthcare data optimization linear infographic template
Free with trial Healthcare service instruction linear infographic template. Medical innovations. Data visualization with 5 steps. Empty process vector design. Editable blank options info graphics. Lexend font used. Linear process infographic vertical vectors Healthcare service instruction linear infographic template
Free with trial Healthcare service for patients linear infographic template. Medical facility. Data visualization with 3 steps. Empty process vector design. Editable blank options info graphics. Lexend font used. Linear process infographic vertical vectors Healthcare service for patients linear infographic template
Free with trial An essential infographic template illustrating a 5 steps process, perfect for presentations and flowcharts. This clear 5 steps infographic template uses a vertical design with arrows and icons. Linear process infographic vertical vectors Multipurpose 5 Steps Infographic Template with Arrows and Icons. An essential infographic template illustrating a 5 steps process, perfect for presentations and flowcharts. This clear 5 steps infographic template uses a vertical design with arrows and icons
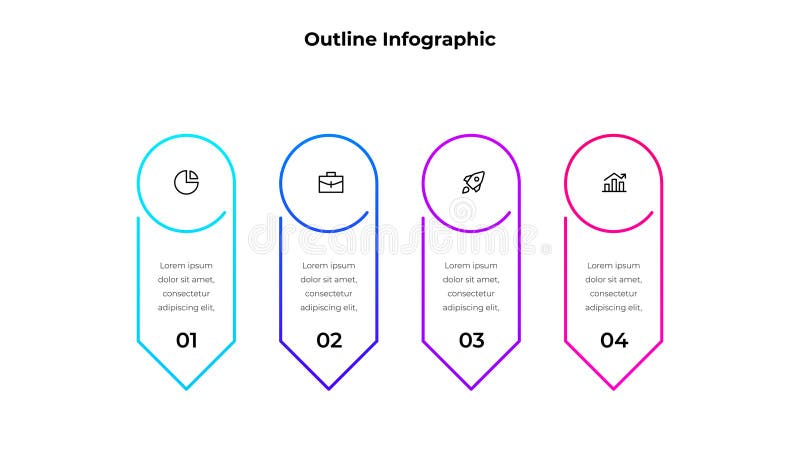
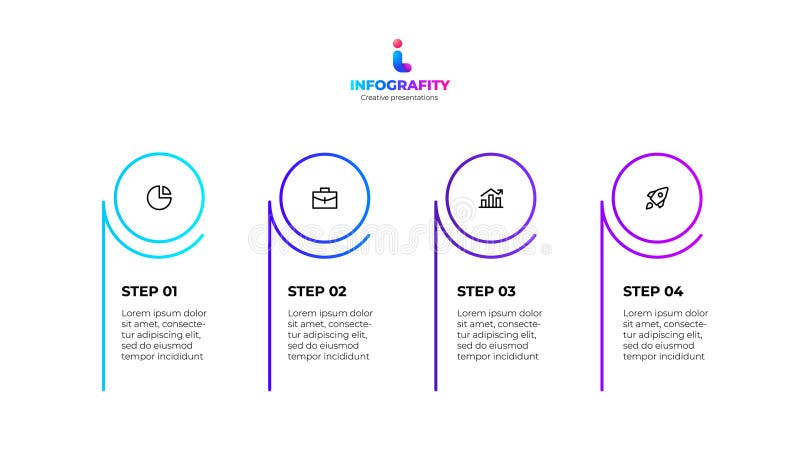
Free with trial Vertical infographic template with four linear frames with icons and text areas for business presentations. Linear process infographic vertical vectors Four Step Process Infographic Template. Vertical infographic template with four linear frames with icons and text areas for business presentations
Free with trial Vertical infographic template with three linear frames with icons and text areas for business presentations. Linear process infographic vertical vectors Three Step Process Infographic Template. Vertical infographic template with three linear frames with icons and text areas for business presentations
Free with trial Vertical progress diagrams with 4 elements. Concept of four steps of business timeline. Creative infographic design template. Linear process infographic vertical vectors Vertical progress diagrams with 4 elements. Concept of four steps of business timeline. Creative infographic design
Free with trial A simple, flat design vector infographic showing a linear process, timeline, or workflow. The illustration consists of five connected nodes: three colored diamond shapes (yellow, green, dark blue) and two intermediate connector nodes, all linked by vertical and horizontal lines with blue circular endpoints. This graphic represents steps, stages, milestones, or data points and is perfect for presentations, business reports, educational materials, or website design related to planning, analysis, and sequence. Linear process infographic vertical illustrations Process Flow Infographic Timeline Steps. A simple, flat design vector infographic showing a linear process, timeline, or workflow. The illustration consists of five connected nodes: three colored diamond shapes (yellow, green, dark blue) and two intermediate connector nodes, all linked by vertical and horizontal lines with blue circular endpoints. This graphic represents steps, stages, milestones, or data points and is perfect for presentations, business reports, educational materials, or website design related to planning, analysis, and sequence.
Free with trial This image features a collection of two distinct vector infographic templates, both designed to visualize an extensive nine-step process or timeline. The top design utilizes a linear array of colorful, numbered vertical banners (01-09), each containing simple line-art icons and a brief text area. The bottom diagram is a more dynamic, organic flow where nine brightly colored, interconnected circular and elliptical nodes are arranged in a horizontal line. Each node features a "STEP" number, an icon, and a vertical line pointing down to a text description. Both professional layouts are perfect for business presentations, long-term project management, educational materials, and any report requiring a clear, structured, and visually engaging display of a sequential workflow. Linear process infographic vertical vectors Nine-Step Process Diagram: Two Colorful Vector Infographics for Timeline Visualization. This image features a collection of two distinct vector infographic templates, both designed to visualize an extensive nine-step process or timeline. The top design utilizes a linear array of colorful, numbered vertical banners (01-09), each containing simple line-art icons and a brief text area. The bottom diagram is a more dynamic, organic flow where nine brightly colored, interconnected circular and elliptical nodes are arranged in a horizontal line. Each node features a "STEP" number, an icon, and a vertical line pointing down to a text description. Both professional layouts are perfect for business presentations, long-term project management, educational materials, and any report requiring a clear, structured, and visually engaging display of a sequential workflow.
Free with trial Infographic process flow chart. Clean minimalistic vector template. Can be used as diagram, graph, chart, workflow layout for web, report, business presentation. Linear process infographic vertical vectors Infographic process flow chart. Clean minimalistic vector template.
Free with trial A vertical timeline infographic template with five vibrant sections in orange, red, purple, blue, and green. Each section includes a title, placeholder text, and icons for clarity. Linear process infographic vertical vectors Colorful Vertical Timeline Infographic Template with five elements. A vertical timeline infographic template with five vibrant sections in orange, red, purple, blue, and green. Each section includes a title, placeholder text, and icons for clarity
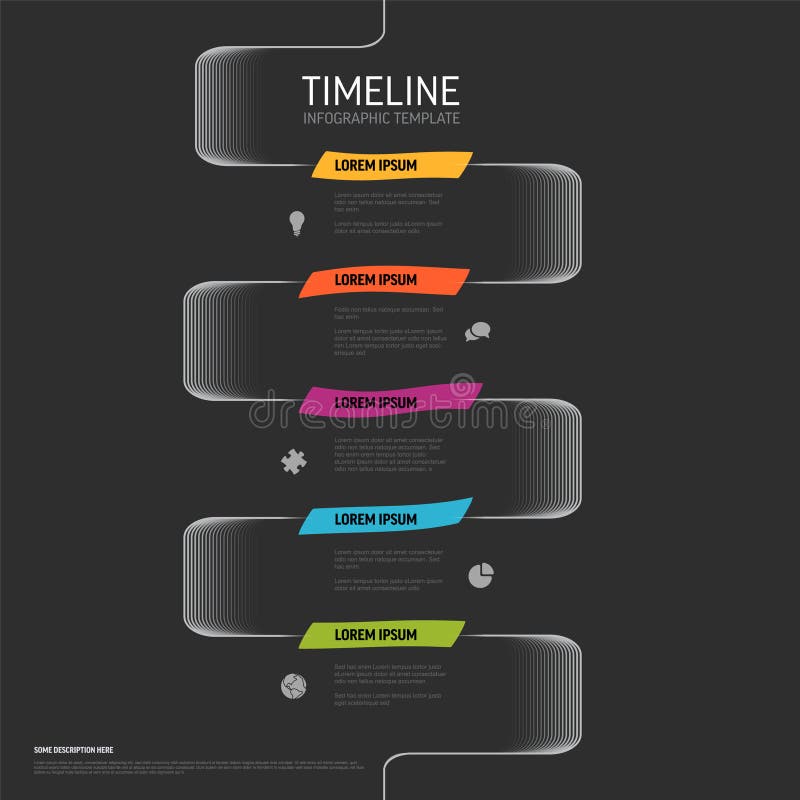
Free with trial A vertical dark timeline infographic template with five vibrant sections in orange, red, purple, blue, and green. Each section includes a title, placeholder text, and icons for clarity. Linear process infographic vertical vectors Colorful Vertical Timeline Infographic Template with five elements on dark background. A vertical dark timeline infographic template with five vibrant sections in orange, red, purple, blue, and green. Each section includes a title, placeholder text, and icons for clarity
Free with trial Agile values core infographic dark outline for slide presentation with stacked vertical list on square connectors box with 4 point list vector. Linear process infographic vertical illustrations Agile values core infographic dark outline for slide presentation with stacked vertical list on square connectors box with 4 point
Free with trial AIDA analysis framework infographic dark outline for slide presentation with stacked vertical list on square connectors box with 4 point list vector. Linear process infographic vertical illustrations AIDA analysis framework infographic dark outline for slide presentation with stacked vertical list on square connectors box with 4
Free with trial Three Steps Business Infographic Template. Vertical infographic template with three sequential steps with linear frames, dark background. Linear process infographic vertical vectors Three Steps Business Infographic Template. Vertical infographic template with three sequential steps with linear frames, dark background
Free with trial Vertical outline elements with 4 steps or options. Concept of timeline business development process. Linear process infographic vertical vectors Vertical outline elements with 4 steps or options. Concept of timeline business development process
Free with trial Service staff infographic orange line circles. Cashier, waiter, courier and mechanic jobs. Professions. Editable thin line icons diagram process with 4 steps. Montserrat-SemiBold, Regular fonts used. Linear process infographic vertical vectors Service staff infographic circles. Service staff infographic orange line circles. Cashier, waiter, courier and mechanic jobs. Professions. Editable thin line icons diagram process with 4 steps. Montserrat-SemiBold, Regular fonts used
Free with trial Monochrome vertical 8-step vector diagram template with looped arrows and circular elements connected by clean lines. Perfect for illustrating sequential, cyclic, or workflow processes in minimalistic infographic style on a transparent background. Linear process infographic vertical vectors Monochrome vertical 8-step vector diagram template
Free with trial Customer service principles infographic yellow line circles. Support, satisfaction and core values. Editable thin line icons diagram process with 3 steps. Montserrat-SemiBold, Regular fonts used. Linear process infographic vertical illustrations Customer service principles infographic yellow line circles
Free with trial Circular linear infographic template or element with 6 step, process, option, colorful connected circle, label, shadow, minimal style for sale slide, agenda, schedule, flowchart, workflow, calendar. Linear process infographic vertical vectors Circular infographic for business presentation. Circular linear infographic template or element with 6 step, process, option, colorful connected circle, label, shadow, minimal style for sale slide, agenda, schedule, flowchart, workflow, calendar
Free with trial This image presents a set of two distinct vector infographic templates, both illustrating a six-step business or project lifecycle from "IDEA" to "SUCCESS. " The upper template uses a linear flow of colorful, three-dimensional hexagonal nodes connected by a dashed line, each containing a thematic icon (lightbulb, megaphone, gear, rocket, target, diamond). The lower template utilizes a modern, vertical flow where large, numbered banners (1-6) curve around the text and icons. Both diagrams are excellent resources for business presentations, strategic planning, and project management, offering clean, modular designs to clearly visualize a sequential workflow, goal setting, and the progression toward a final achievement. Linear process infographic vertical vectors Modular Business Timeline: Hexagonal and Vertical Templates for Idea to Success Strategy. This image presents a set of two distinct vector infographic templates, both illustrating a six-step business or project lifecycle from "IDEA" to "SUCCESS." The upper template uses a linear flow of colorful, three-dimensional hexagonal nodes connected by a dashed line, each containing a thematic icon (lightbulb, megaphone, gear, rocket, target, diamond). The lower template utilizes a modern, vertical flow where large, numbered banners (1-6) curve around the text and icons. Both diagrams are excellent resources for business presentations, strategic planning, and project management, offering clean, modular designs to clearly visualize a sequential workflow, goal setting, and the progression toward a final achievement.
Free with trial Four step downward arrow infographic on dark purple background. Linear process infographic vertical vectors Four step downward arrow infographic on dark purple background
Free with trial Business data visualization. Template for presentation. Design concept with 4 options, parts, steps or processes. Vertical infographic. Linear process infographic vertical vectors Business data visualization. Template for presentation. Design concept with 4 options, parts, steps or processes
Free with trial A clean, minimalist illustration of a timeline or process flow, represented by a horizontal line connecting various geometric shapes: arrow, circle, square, diamond, triangle, and star. Each shape has a vertical line extending downward. The design is simple and modern, suitable for presentations, infographics, and educational materials to illustrate sequential steps or milestones. Linear process infographic vertical illustrations Linear Timeline with Geometric Shapes. A clean, minimalist illustration of a timeline or process flow, represented by a horizontal line connecting various geometric shapes: arrow, circle, square, diamond, triangle, and star. Each shape has a vertical line extending downward. The design is simple and modern, suitable for presentations, infographics, and educational materials to illustrate sequential steps or milestones.