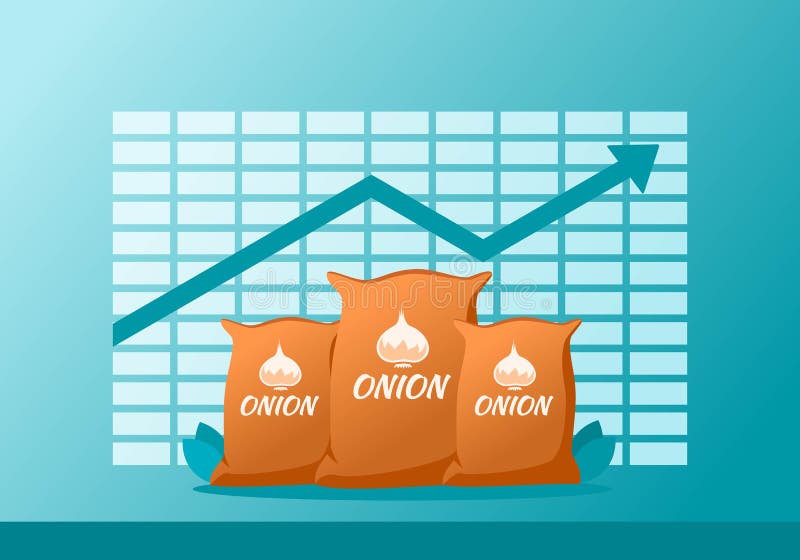
Free with trial Onion Price Value Stock Market Demand Decrease Drop Fall Down Statistic Report with Graph Chart Diagram Illustration Vector. Market value price decrease vectors Onion Price Decrease Down in Statistic Graph. Onion Price Value Stock Market Demand Decrease Drop Fall Down Statistic Report with Graph Chart Diagram Illustration Vector
Free with trial Bitcoin cryptocurrency price up. Bitcoin going up. Crypto currency and financial concept element. bitcoin symbol and arrow up. Bitcoin value increasing statistic vector icon logo illustration design. Market value price decrease vectors Bitcoin cryptocurrency price up. Bitcoin going up
Free with trial Bitcoin cryptocurrency price up. Bitcoin going up. Crypto currency and financial concept element. bitcoin symbol and arrow up. Bitcoin value increasing statistic vector icon logo illustration design. Market value price decrease vectors Bitcoin cryptocurrency price up. Bitcoin going up
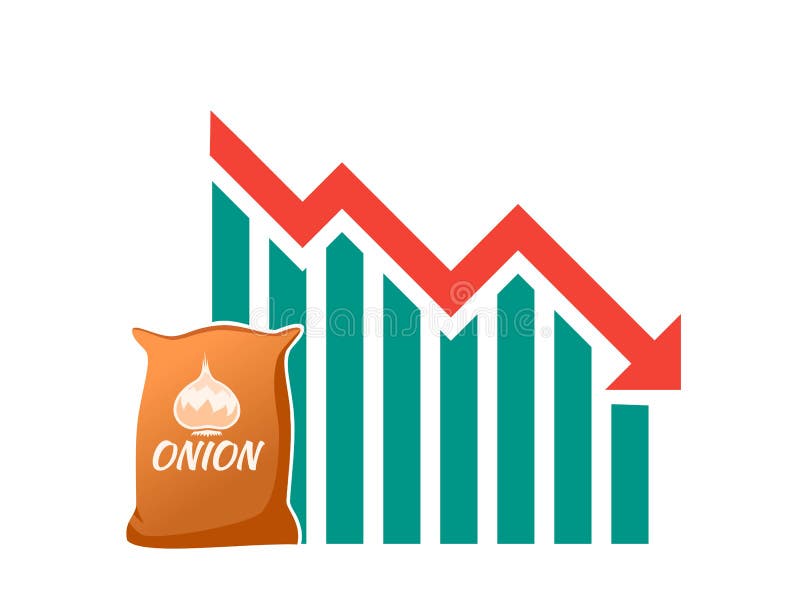
Free with trial Onion Price Value Stock Market Demand Decrease Drop Fall Down Statistic Report with Graph Chart Diagram Illustration Vector. Market value price decrease vectors Onion Price Decrease Down in Statistic Graph. Onion Price Value Stock Market Demand Decrease Drop Fall Down Statistic Report with Graph Chart Diagram Illustration Vector
Free with trial Onion Price Value Stock Market Demand Decrease Drop Fall Down Statistic Report with Graph Chart Diagram Illustration Vector. Market value price decrease vectors Onion Price Decrease Down in Statistic Graph. Onion Price Value Stock Market Demand Decrease Drop Fall Down Statistic Report with Graph Chart Diagram Illustration Vector
Free with trial Bitcoin or crypto currency investment portfolio, buy or sell trading, crypto market exchange value concepts. Businessman investor or trader buys and sells bitcoins or other currency using mobile app. Market value price decrease vectors Bitcoin or crypto currency investment portfolio, buy or sell trading, crypto market exchange value concepts. Businessman investor
Free with trial Scales with oil barrels and coronavirus. Concept of falling on oil market. Oil price. Vector flat illustration. COVID-19 concept for banners. MERS-Cov,Novel coronavirus, 2019-nCoV elements. Market value price decrease illustrations Scales with oil barrels and coronavirus . Concept of falling on oil market. Oil price. Vector flat illustration. COVID-19 concept
Free with trial Market correction and capital loss and corporate taxable income as a business concept representing financial deductions or investment decrease and selling profits after gains with 3D illustration elements. Market value price decrease illustrations Market Correction
Free with trial American Dollar value decrease rate icon in round button isolated on transparent background - graphic element for your design. High quality transparent PNG file available. Market value price decrease vectors American Dollar value decrease button - PNG. American Dollar value decrease rate icon in round button isolated on transparent background - graphic element for your design. High quality transparent PNG file available.
Free with trial Editable line icon of a stock market crash by decreasing value in form of a line and bar graph going down in modern black lines on a clean and white background as a eps vector file. Market value price decrease vectors Editable real line icon of a stock market crash. Editable line icon of a stock market crash by decreasing value in form of a line and bar graph going down in modern black lines on a clean and white background as a eps vector file
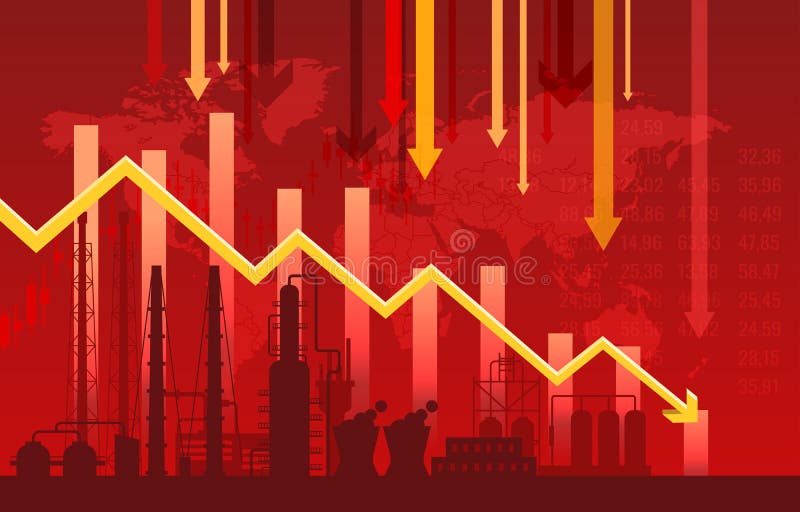
Free with trial Oil price crisis doodle - crude oil value chart. Petroleum industry illustration. Market value price decrease illustrations Oil price crisis
Free with trial Stocks graph money finance market up down icon vector graphic, financial growth loss chart arrow illustration, currency inflation deflation image clipart flat, sales trade increase decrease. Market value price decrease vectors Stocks graph money finance market up down icon vector graphic, financial growth loss chart arrow illustration, currency inflation
Free with trial Oil price crisis doodle - crude oil value chart. Petroleum industry illustration. Market value price decrease illustrations Oil barrel price. Oil price crisis doodle - crude oil value chart. Petroleum industry illustration.
Free with trial Oil barrel drum and hundred us dollar banknotes isolated on white, oil cask and fanned money, barrel price concept, petroleum cost banner, gasoline rate, fuel value, oil and gas industry illustration. Market value price decrease illustrations Oil barrel drum and hundred us dollar banknotes isolated on white, oil cask and fanned money, barrel price concept, petroleum cost
Free with trial Bitcoin chart and diagram - valuation and price of digital currency is decreasing and going down. Decline, fall, plunge and descend of value and cost. Vector illustration. Market value price decrease vectors Bitcoin chart and diagram - valuation and price of digital currency is decreasing and going down
Free with trial Dogecoin chart and diagram - valuation and price of digital currency is decreasing and going down. Decline, fall, plunge and descend of value and cost. Vector illustration. Market value price decrease vectors Dogecoin chart and diagram - valuation and price of digital currency is decreasing and going down
Free with trial Oil and gold market price effect to young business investor. Market value price decrease vectors Oil and gold market price effect to business investor
Free with trial Financial and stock investment market concept. The bear market which price of securities are falling down. Market value price decrease vectors Financial and stock investment market concept.
Free with trial Oil and gold market price effect to young business investor. Market value price decrease vectors Oil and gold market price effect to young businessman. Oil and gold market price effect to young business investor
Free with trial Oil and gold market price effect to young business investor. Market value price decrease vectors Oil and gold market price effect to young businessman. Oil and gold market price effect to young business investor
Free with trial Oil and gold market price effect to young business investor. Market value price decrease vectors Oil and gold market price effect
Free with trial Economical value of dollar falling down vector isolated. Icon of a coin and graphic falling down, concept of financial crisis. Economy decrease and recession. Market value price decrease vectors Economical value of dollar falling down isolated. Economical value of dollar falling down vector isolated. Icon of a coin and graphic falling down, concept of financial crisis. Economy decrease and recession
Free with trial Crypto currency market plunge. Graph showing bitcoin price falling down. Vector illustration. Market value price decrease vectors Cryptocurrency market plunge. Vector illustration. Crypto currency market plunge. Graph showing bitcoin price falling down. Vector illustration.
Free with trial Economical value of dollar falling down vector isolated. Icon of a coin and arrow down, concept of financial crisis. Economy decrease and recession. Market value price decrease vectors Economical value of dollar falling down isolated. Economical value of dollar falling down vector isolated. Icon of a coin and arrow down, concept of financial crisis. Economy decrease and recession
Free with trial Economical value of dollar falling down vector isolated. Icon of a coin and arrow down, concept of financial crisis. Economy decrease and recession. Market value price decrease vectors Economical value of dollar falling down isolated. Economical value of dollar falling down vector isolated. Icon of a coin and arrow down, concept of financial crisis. Economy decrease and recession
Free with trial Crypto currency market plunge. Graph showing bitcoin price falling down. Vector illustration. Market value price decrease illustrations Crypto currency market plunge. Vector illustration. Crypto currency market plunge. Graph showing bitcoin price falling down. Vector illustration
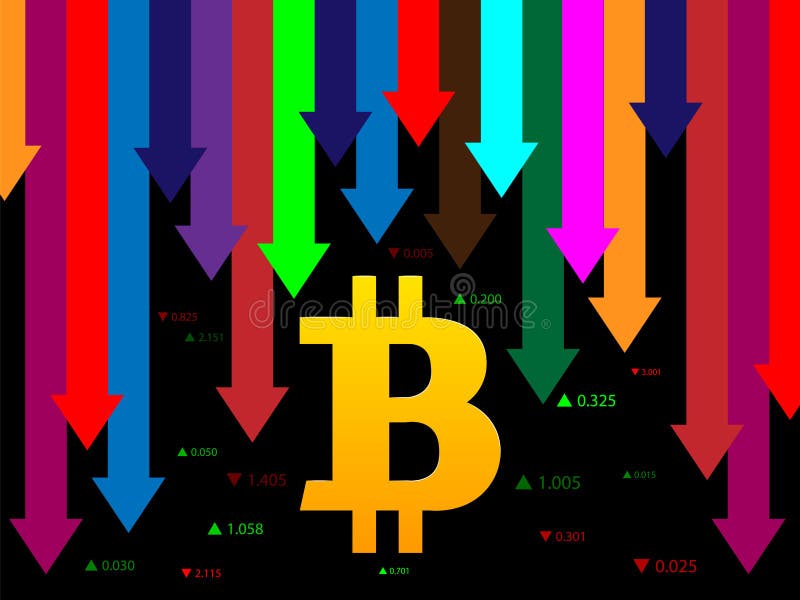
Free with trial Fall, depreciation of the Bitcoin, decrease of the value of the cryptocurrency, rate in the form of arrows of different heights and colors. For financial companies, banks, currency exchange. Market value price decrease vectors Fall, depreciation of the Bitcoin, decrease of the value of cryptocurrency. Vector. Fall, depreciation of the Bitcoin, decrease of the value of the cryptocurrency, rate in the form of arrows of different heights and colors. For financial companies, banks, currency exchange
Free with trial Falling bitcoin price pattern. Decrease in value of crypto currency. Background Vector illustration. Market value price decrease vectors Falling bitcoin price pattern. Decrease in value of crypto currency. Background Vector illustration.
Free with trial Falling bitcoin price pattern. Decrease in value of crypto currency. Background Vector illustration. Market value price decrease vectors Falling bitcoin price pattern. Decrease in value of crypto currency. Background Vector illustration.
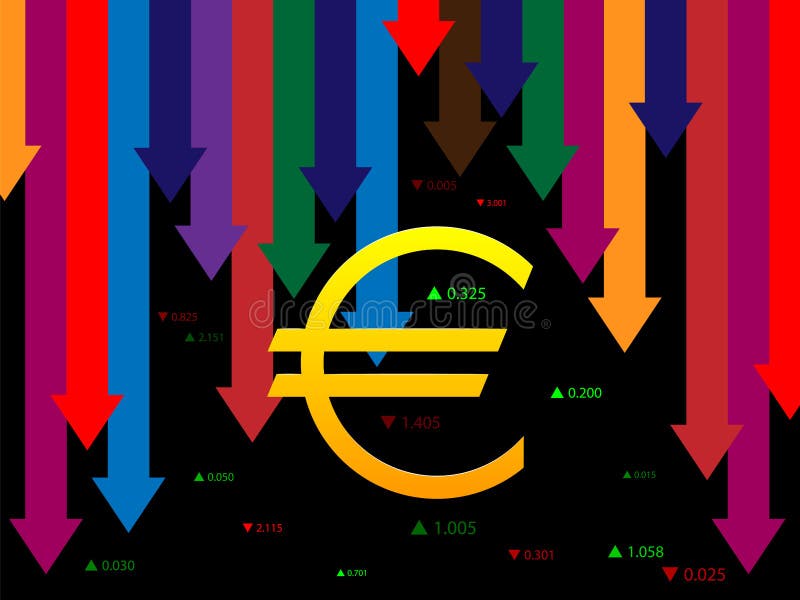
Free with trial Illustration - Fall, depreciation of the Euro, decrease of the value of the monetary unit, rate in the form of arrows of different heights and colors. For financial companies, banks, currency exchange. Market value price decrease vectors Fall, depreciation of the Euro, decrease of the value of the monetary unit. Vector. Illustration - Fall, depreciation of the Euro, decrease of the value of the monetary unit, rate in the form of arrows of different heights and colors. For financial companies, banks, currency exchange
Free with trial Fall, depreciation of the Ruble, decrease of the value of the monetary unit, rate in the form of arrows of different heights and colors. For financial company, bank, currency exchange. Market value price decrease vectors Fall, depreciation of the Ruble, decrease of the value of the monetary unit. Vector. Fall, depreciation of the Ruble, decrease of the value of the monetary unit, rate in the form of arrows of different heights and colors. For financial company, bank, currency exchange
Free with trial Tezos XTZ cryptocurrency value dip, price going down flat design. Vector eps illustration showing blue tezos icon over red downward graph with down arrow on blue background. Net worth decrease, digital wealth, profit loss illustration. Market value price decrease vectors Tezos XTZ crypto currency price dip, worth going down, vector illustration. Tezos XTZ cryptocurrency value dip, price going down flat design. Vector eps illustration showing blue tezos icon over red downward graph with down arrow on blue background. Net worth decrease, digital wealth, profit loss illustration.
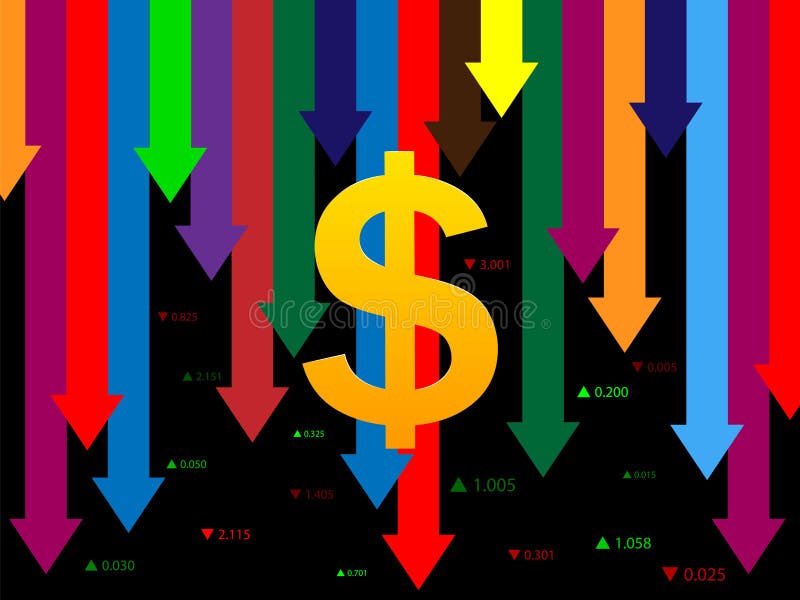
Free with trial Illustration - Fall, depreciation of the Dollar, decrease of the value of the monetary unit, rate in the form of arrows of different heights and colors. For financial company, bank, currency exchange. Market value price decrease vectors Fall, depreciation of the Dollar, decrease of the value of the monetary unit. Vector. Illustration - Fall, depreciation of the Dollar, decrease of the value of the monetary unit, rate in the form of arrows of different heights and colors. For financial company, bank, currency exchange
Free with trial Cut Price Coupon Vector Icon Concept. Cut Price Coupon For Purchasing Goods In Market, Internet Store Or Shop Seasonal Discount And Down Rate. Commercial Offer And Sales Color Illustration. Market value price decrease vectors Cut Price Coupon Vector Concept Color Illustration. Cut Price Coupon Vector Icon Concept. Cut Price Coupon For Purchasing Goods In Market, Internet Store Or Shop Seasonal Discount And Down Rate. Commercial Offer And Sales Color Illustration
Free with trial Cut Price Coupon Vector Icon Concept. Cut Price Coupon For Purchasing Goods In Market, Internet Store Or Shop Seasonal Discount And Down Rate. Commercial Offer And Sales Black Illustration. Market value price decrease illustrations Cut Price Coupon Vector Concept Black Illustration. Cut Price Coupon Vector Icon Concept. Cut Price Coupon For Purchasing Goods In Market, Internet Store Or Shop Seasonal Discount And Down Rate. Commercial Offer And Sales Black Illustration
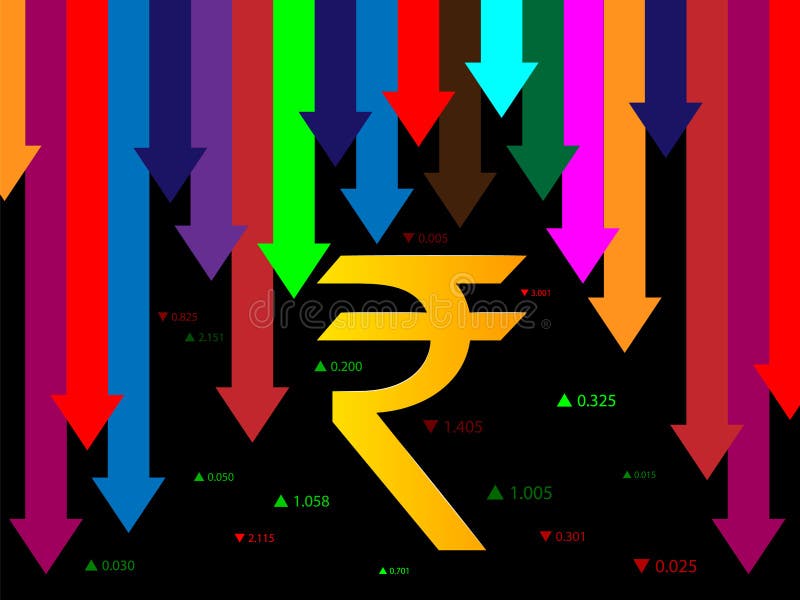
Free with trial Fall, depreciation of the Indian Rupee, decrease of the value of the monetary unit, rate in the form of arrows of different heights and colors. For financial companies, banks, currency exchange. Market value price decrease vectors Fall, depreciation of the Indian Rupee, decrease of the value of the monetary unit. Vector. Fall, depreciation of the Indian Rupee, decrease of the value of the monetary unit, rate in the form of arrows of different heights and colors. For financial companies, banks, currency exchange
Free with trial Decrease in the value of securities. Drop in stock prices. The fall of corporate bonds. Decrease in income. Discount on insurance. Vector icon. Market value price decrease vectors Decrease in the value of securities. Drop in stock prices
Free with trial Recession and inflation after the Covid-19 pandemic. War around the world, dollar value decreasing. Market crash and global economy fall concepts. Market value price decrease illustrations Recession and inflation after the Covid-19 pandemic. War around the world, dollar value decreasing. Market crash and global
Free with trial 3D Rendering stock market trading graph with gold bars and arrow pointing up on background concept of gold price financial investment. 3D Render illustration. Market value price decrease illustrations 3D Rendering stock market trading graph with gold bars and arrow pointing up
Free with trial Fall, depreciation of the English, British pound sterling, decrease of the value of the monetary unit, rate in the form of arrows of different heights, colors. Company, bank, currency exchange. Market value price decrease vectors Fall, depreciation of the English, British pound sterling, decrease of the value of the monetary unit
Free with trial Inflation, deflation, money lost concept. Decrease graph with flying money on balloon. Profit lost, value reduce due to global financial economic recession. Market value price decrease vectors Inflation, deflation, money lost concept. Decrease graph with flying money on balloon. Profit lost, value reduce due to global
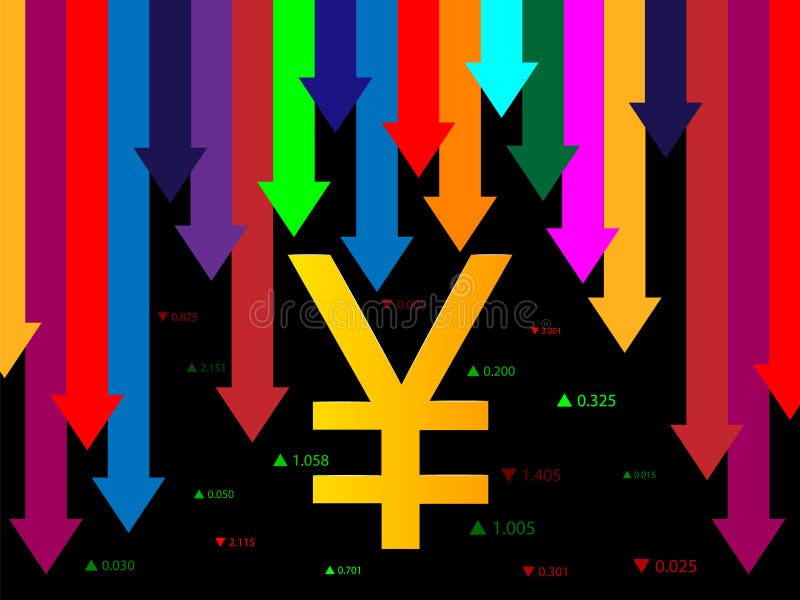
Free with trial Fall depreciation of the Chinese yuan, Japanese yen, decrease of the value of the monetary unit, rate in the form of arrows of different heights, colors. For financial company, bank, currency exchange. Market value price decrease vectors Fall, depreciation of the Chinese yuan and Japanese yen, decrease of the value of the monetary unit. Vector. Fall depreciation of the Chinese yuan, Japanese yen, decrease of the value of the monetary unit, rate in the form of arrows of different heights, colors. For financial company, bank, currency exchange
Free with trial Recession and inflation after the Covid-19 pandemic. War around the world, dollar value decreasing. Market crash and global economy fall concepts. Market value price decrease illustrations Recession and inflation after the Covid-19 pandemic. War around the world, dollar value decreasing. Market crash and global
Free with trial Recession and inflation after the Covid-19 pandemic. War around the world, dollar value decreasing. Market crash and global economy fall concepts. Market value price decrease illustrations Recession and inflation after the Covid-19 pandemic. War around the world, dollar value decreasing. Market crash and global
Free with trial Recession and inflation after the Covid-19 pandemic. War around the world, dollar value decreasing. Market crash and global economy fall concepts. Market value price decrease illustrations Recession and inflation after the Covid-19 pandemic. War around the world, dollar value decreasing. Market crash and global
Free with trial Recession and inflation after the Covid-19 pandemic. War around the world, dollar value decreasing. Market crash and global economy fall concepts. Market value price decrease illustrations Recession and inflation after the Covid-19 pandemic. War around the world, dollar value decreasing. Market crash and global
Free with trial Recession and inflation after the Covid-19 pandemic. War around the world, dollar value decreasing. Market crash and global economy fall concepts. Market value price decrease illustrations Recession and inflation after the Covid-19 pandemic. War around the world, dollar value decreasing. Market crash and global
Free with trial Recession and inflation after the Covid-19 pandemic. War around the world, dollar value decreasing. Market crash and global. Economy fall concepts. Market value price decrease illustrations Recession and inflation after the Covid-19 pandemic. War around the world, dollar value decreasing. Market crash and global. Economy fall concepts
Free with trial Recession and inflation after the Covid-19 pandemic. War around the world, dollar value decreasing. Market crash and global economy fall concepts. Market value price decrease illustrations Recession and inflation after the Covid-19 pandemic. War around the world, dollar value decreasing. Market crash and global
Free with trial Recession and inflation after the Covid-19 pandemic. War around the world, dollar value decreasing. Market crash and global economy fall concepts. Market value price decrease illustrations Recession and inflation after the Covid-19 pandemic. War around the world, dollar value decreasing. Market crash and global
Free with trial Recession and inflation after the Covid-19 pandemic. War around the world, dollar value decreasing. Market crash and global economy fall concepts. Market value price decrease illustrations Recession and inflation after the Covid-19 pandemic. War around the world, dollar value decreasing. Market crash and global
Free with trial Bitcoin and down arrow. Decrease in the value of the currency. Fluctuations and forecasting of the cryptocurrency rate. 3D rendering. Market value price decrease illustrations Bitcoin and down arrow. Decrease in the value of the currency. Fluctuations and forecasting of the cryptocurrency rate
Free with trial Bitcoin cryptocurrency price up. Bitcoin going up. Crypto currency and financial concept element. bitcoin symbol and arrow up. Bitcoin value increasing statistic vector icon logo illustration design. Market value price decrease vectors Bitcoin cryptocurrency price up. Bitcoin going up
Free with trial Bitcoin cryptocurrency price up. Bitcoin going up. Crypto currency and financial concept element. bitcoin symbol and arrow up. Bitcoin value increasing statistic vector icon logo illustration design. Market value price decrease vectors Bitcoin cryptocurrency price up. Bitcoin going up
Free with trial Bitcoin cryptocurrency price up. Bitcoin going up. Crypto currency and financial concept element. bitcoin symbol and arrow up. Bitcoin value increasing statistic vector icon logo illustration design. Market value price decrease vectors Bitcoin cryptocurrency price up. Bitcoin going up
Free with trial Bitcoin cryptocurrency price up. Bitcoin going up. Crypto currency and financial concept element. bitcoin symbol and arrow up. Bitcoin value increasing statistic vector icon logo illustration design. Market value price decrease vectors Bitcoin cryptocurrency price up. Bitcoin going up
Free with trial Bitcoin cryptocurrency price up. Bitcoin going up. Crypto currency and financial concept element. bitcoin symbol and arrow up. Bitcoin value increasing statistic vector icon logo illustration design. Market value price decrease vectors Bitcoin cryptocurrency price up. Bitcoin going up
Free with trial Bitcoin cryptocurrency price up. Bitcoin going up. Crypto currency and financial concept element. bitcoin symbol and arrow up. Bitcoin value increasing statistic vector icon logo illustration design. Market value price decrease vectors Bitcoin cryptocurrency price up. Bitcoin going up
Free with trial Bitcoin cryptocurrency price up. Bitcoin going up. Crypto currency and financial concept element. bitcoin symbol and arrow up. Bitcoin value increasing statistic vector icon logo illustration design. Market value price decrease vectors Bitcoin cryptocurrency price up. Bitcoin going up
Free with trial Bitcoin cryptocurrency price up. Bitcoin going up. Crypto currency and financial concept element. bitcoin symbol and arrow up. Bitcoin value increasing statistic vector icon logo illustration design. Market value price decrease vectors Bitcoin cryptocurrency price up. Bitcoin going up
Free with trial Euro dollar balance scale, high currency value, finance exchange simple vector illustration, gold coins. Market value price decrease vectors Euro dollar balance scale, high currency value, finance exchange vector illustration, financial market concept. euro dollar balance scale, high currency value, finance exchange simple vector illustration, gold coins
Free with trial Recession of money value on finance market. Price increase, business risk and percentage rate. Economy default, devaluation and inflation concept. Financial growth, investment. Vector illustration. Market value price decrease illustrations Recession of money value on finance market. Price increase, business risk and percentage rate. Economy default
Free with trial This stock image showcases a trading chart and candlesticks that represent a rising uptrend in the stock market. The candlesticks represent the price movements of a particular stock, and the chart shows the overall trend over a specific period of time. The high-quality production values of this stock image make it an ideal asset for a wide range of projects related to stock market trends, financial news, or investment advice. Market value price decrease illustrations Stock market or trading chart and candlesticks showing a rising uptrend. This stock image showcases a trading chart and candlesticks that represent a rising uptrend in the stock market. The candlesticks represent the price movements of a particular stock, and the chart shows the overall trend over a specific period of time. The high-quality production values of this stock image make it an ideal asset for a wide range of projects related to stock market trends, financial news, or investment advice.
Free with trial This stock image showcases a trading chart and candlesticks that represent a rising uptrend in the stock market. The candlesticks represent the price movements of a particular stock, and the chart shows the overall trend over a specific period of time. The high-quality production values of this stock image make it an ideal asset for a wide range of projects related to stock market trends, financial news, or investment advice. Market value price decrease illustrations Stock market or trading chart and candlesticks showing a rising uptrend. This stock image showcases a trading chart and candlesticks that represent a rising uptrend in the stock market. The candlesticks represent the price movements of a particular stock, and the chart shows the overall trend over a specific period of time. The high-quality production values of this stock image make it an ideal asset for a wide range of projects related to stock market trends, financial news, or investment advice.
Free with trial This stock image showcases a trading chart and candlesticks that represent a rising uptrend in the stock market. The candlesticks represent the price movements of a particular stock, and the chart shows the overall trend over a specific period of time. The high-quality production values of this stock image make it an ideal asset for a wide range of projects related to stock market trends, financial news, or investment advice. Market value price decrease illustrations Stock market or trading chart and candlesticks showing a rising uptrend. This stock image showcases a trading chart and candlesticks that represent a rising uptrend in the stock market. The candlesticks represent the price movements of a particular stock, and the chart shows the overall trend over a specific period of time. The high-quality production values of this stock image make it an ideal asset for a wide range of projects related to stock market trends, financial news, or investment advice.
Free with trial This stock image showcases a trading chart and candlesticks that represent a rising uptrend in the stock market. The candlesticks represent the price movements of a particular stock, and the chart shows the overall trend over a specific period of time. The high-quality production values of this stock image make it an ideal asset for a wide range of projects related to stock market trends, financial news, or investment advice. Market value price decrease illustrations Stock market or trading chart and candlesticks showing a rising uptrend. This stock image showcases a trading chart and candlesticks that represent a rising uptrend in the stock market. The candlesticks represent the price movements of a particular stock, and the chart shows the overall trend over a specific period of time. The high-quality production values of this stock image make it an ideal asset for a wide range of projects related to stock market trends, financial news, or investment advice.
Free with trial Energy crisis with financial drop and industry crash tiny person concept. Power production value rising or trade recession with global politics problem vector illustration. Electricity market collapse. Market value price decrease vectors Energy crisis with financial drop and industry crash tiny person concept
Free with trial Decreasing value of money effect from inflation with down arrow, isometric vector. Market value price decrease vectors Decreasing value of money effect from inflation with down arrow
Free with trial Stock market concept , stock market crisis. Market value price decrease illustrations Stock market concept
Free with trial Stock market concept , stock market crisis. Market value price decrease illustrations Stock market concept
Free with trial Stock market down. Financial crisis concept. Stock prices are falling. Vector Illustration. Market value price decrease vectors Stock market down. Financial crisis concept. Vector Illustration. Stock market down. Financial crisis concept. Stock prices are falling. Vector Illustration
Free with trial Money icon with arrows, capital decrease and increase, dollar rate increase, investment concept – stock vector. Market value price decrease illustrations Money icon with arrows, capital decrease and increase, dollar rate increase, investment concept – vector
Free with trial Increase and decrease related icons: thin vector icon set, black and white kit. Market value price decrease vectors Increase and decrease related icons
Free with trial Half price sale text - 3d red and white letters and block, business shopping concept. Market value price decrease illustrations Half price sale in 3d letters and block. Half price sale text - 3d red and white letters and block, business shopping concept
Free with trial Money icon with arrows, capital decrease and increase, dollar rate increase, investment concept – stock vector. Market value price decrease illustrations Money icon with arrows, capital decrease and increase, dollar rate increase, investment concept – vector
Free with trial Oil price fall in European Union graph on Europe map background and red down arrow. Market value price decrease vectors Oil price fall in European Union graph
Free with trial Crude oil price. Abstract illustration with barrel. Oil and gas production. Fall and rise of the price. Oil container. Finance diagram. Black money. Vector design illustration. Market value price decrease vectors Crude oil price. Abstract illustration with barrel
Free with trial 3D rendering of a chart representing the price of copper going down. Market value price decrease illustrations A chart representing the price of copper going down
Free with trial Oil price fall graph with red down arrow vector illustration. Market value price decrease vectors Oil price fall graph with red down arrow
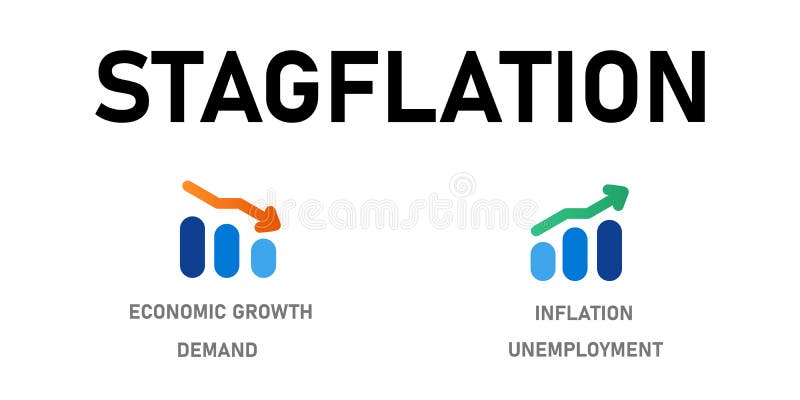
Free with trial Stagflation economic condition with high inflation increase price unemployment but low decrease economic growth and demand chart vector. Market value price decrease vectors Stagflation economic condition with high inflation increase price unemployment but low decrease economic growth and