Free with trial SMART Goals Infographic with Layered Steps and Business Icons Vector Illustration. Measurable icon vectors SMART Goals Infographic with Layered Steps and Business Icons
Free with trial SMART goals setting framework infographic with gear cycle arrow circular on horizontal direction with 5 step points for slide presentation vector. Measurable icon vectors SMART goals setting framework infographic with gear cycle arrow circular on horizontal direction with 5 step points for slide
Free with trial SMART goals setting framework infographic with arrow shape top direction with 5 step points for slide presentation vector. Measurable icon vectors SMART goals setting framework infographic with arrow shape top direction with 5 step points for slide presentation
Free with trial A clean vector illustration representing the concept of an award winner. This graphic features two distinct icons: a green checkmark in a circle, symbolizing approval and success, and a bar chart with a rising arrow, indicating growth and positive performance. The text 'AWARD WINNER' is prominently displayed below. This versatile image is perfect for business presentations, financial reports, marketing materials, and websites to signify achievement, excellence, quality, and measurable success. Isolated on a white background for easy integration into any design. Measurable icon vectors Award Winner Concept with Check Mark and Growth Chart Icons. A clean vector illustration representing the concept of an award winner. This graphic features two distinct icons: a green checkmark in a circle, symbolizing approval and success, and a bar chart with a rising arrow, indicating growth and positive performance. The text 'AWARD WINNER' is prominently displayed below. This versatile image is perfect for business presentations, financial reports, marketing materials, and websites to signify achievement, excellence, quality, and measurable success. Isolated on a white background for easy integration into any design.
Free with trial Circular SMART chart with five colorful initials and text blocks for each principle Vector Illustration. Measurable icon vectors Circular SMART chart with five colorful initials and text blocks for each principle
Free with trial A contemporary flat design vector illustration of a male character (man) working diligently on a laptop. The background elements, including a progress bar, a chat speech bubble, and a cogwheel connected by lines, symbolize business strategy, workflow optimization, communication, and measurable project advancement. The illustration uses a modern, clean color palette, making it highly suitable for corporate websites, e-commerce platforms, digital marketing materials, software interfaces, presentations, and applications. It effectively conveys themes of productivity, online business management, remote work, and technological process in an approachable and professional manner. Measurable icon vectors Man Working on Laptop with Process Flow and Progress Bar Icon. A contemporary flat design vector illustration of a male character (man) working diligently on a laptop. The background elements, including a progress bar, a chat speech bubble, and a cogwheel connected by lines, symbolize business strategy, workflow optimization, communication, and measurable project advancement. The illustration uses a modern, clean color palette, making it highly suitable for corporate websites, e-commerce platforms, digital marketing materials, software interfaces, presentations, and applications. It effectively conveys themes of productivity, online business management, remote work, and technological process in an approachable and professional manner.
Free with trial Project planning, time management, goal setting, team productivity, efficiency, achievement. A calendar, clock dartboard and desk with a pen. Time management and goal setting concept. Measurable icon illustrations Productivity and Goal Achievement Concept with Calendar, Clock, and Target Symbol. Project planning, time management, goal setting, team productivity, efficiency, achievement. A calendar, clock dartboard and desk with a pen. Time management and goal setting concept
Free with trial Outlined SMART circle with core label, floating goal initials, and structured info layout Vector Illustration. Measurable icon vectors Outlined SMART circle with core label, floating goal initials, and structured info layout
Free with trial Data analysis concept. Data analysis through graph, chart, and analytics tools. Data analysis drives business insights, decisions, and measurable outcomes. Ideal for analytics, finance marketing. Measurable icon vectors Data Analysis and Business Insights Concept with Charts, Graphs, and User Profile Interface. Data analysis concept. Data analysis through graph, chart, and analytics tools. Data analysis drives business insights, decisions, and measurable outcomes. Ideal for analytics, finance marketing
Free with trial Rotating arrow SMART cycle with modern color scheme and acronym-based layout Vector Illustration. Measurable icon vectors Rotating arrow SMART cycle with modern color scheme and acronym-based layout
Free with trial Hand drawn SMART goals infographic for business management and strategy planning on white background. Measurable icon illustrations Hand drawn SMART goals infographic for business management and strategy planning on white background
Free with trial Gradient pentagon infographic highlighting SMART components with labeled icons Vector Illustration. Measurable icon vectors Gradient pentagon infographic highlighting SMART components with labeled icons
Free with trial Quality assessment, customer reviews, data analytics, business evaluation, consumer satisfaction, user feedback. A five-star rating bar and a segmented pie chart. Customer reviews and data analytics. Measurable icon vectors Five-Star Rating with Pie Chart, Business Analytics, Customer Feedback, and Review Concept. Quality assessment, customer reviews, data analytics, business evaluation, consumer satisfaction, user feedback. A five-star rating bar and a segmented pie chart. Customer reviews and data analytics
Free with trial Collaborative team effort with tangled thoughts resolving into clarity, upward graph growth, and progress representation. Ideal for teamwork, innovation, mental clarity, planning, success, personal. Measurable icon vectors Team brainstorming and problem-solving journey toward achieving success and measurable growth. Collaborative team effort with tangled thoughts resolving into clarity, upward graph growth, and progress representation. Ideal for teamwork, innovation, mental clarity, planning, success, personal
Free with trial Data visualization, workflow processes, technology innovation, emotional intelligence, business strategy, performance tracking. Pie chart, heart and gear icons. Data visualization and workflow. Measurable icon vectors Pie Chart, Heart, and Gear Symbols Data Analytics, Emotional Connection, and Process Optimization. Data visualization, workflow processes, technology innovation, emotional intelligence, business strategy, performance tracking. Pie chart, heart and gear icons. Data visualization and workflow
Free with trial Person silhouette walking near a calculator and stacked boxes, emphasizing calculation, shipping, delivery, planning, retail, warehouse, and organization simple flat metaphor. Measurable icon vectors Person Walking with Calculator and Stacked Boxes Representing Logistics and Inventory Management. Person silhouette walking near a calculator and stacked boxes, emphasizing calculation, shipping, delivery, planning, retail, warehouse, and organization simple flat metaphor
Free with trial User rating concept. User rating highlighted with a speed meter and star review system. User rating improves product quality, customer trust, and feedback analysis. For apps, platforms, marketing. Measurable icon illustrations User Rating and Performance Concept with Speed Meter and Star Review Symbols on White Background. User rating concept. User rating highlighted with a speed meter and star review system. User rating improves product quality, customer trust, and feedback analysis. For apps, platforms, marketing
Free with trial Pie chart and statistics on screen beside a person holding a mask. Ideal for data privacy, insight analysis, identity, confidentiality, anonymity, professional security, simple flat metaphor. Measurable icon illustrations Analyzing Data Insights with a Concealed Identity Concept in Professional Environment. Pie chart and statistics on screen beside a person holding a mask. Ideal for data privacy, insight analysis, identity, confidentiality, anonymity, professional security, simple flat metaphor
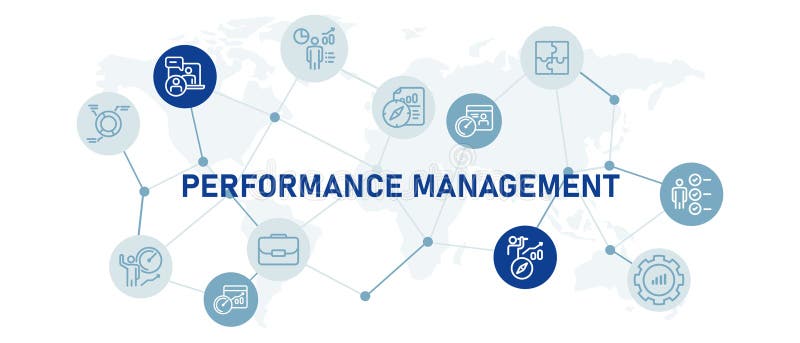
Free with trial Performance Management employee or system review measurement perform analysis optimization of productivity effectiveness vector. Measurable icon illustrations Performance Management employee or system review measurement perform analysis optimization of productivity effectiveness
Free with trial Upgrade process learning curve and performance roadmap icons help communicate transformation stages skill progression and structured paths toward higher efficiency and measurable growth outcomes. Measurable icon vectors A set of four outline icons depicting abstract concepts like surface, process flow, task, and refresh. Upgrade process learning curve and performance roadmap icons help communicate transformation stages skill progression and structured paths toward higher efficiency and measurable growth outcomes
Free with trial Blue thermometer gauge rising, calendar with marked days, and highlighted dollar coin. Ideal for funding, budgeting, savings, time management, goal tracking, project planning simple flat metaphor. Measurable icon illustrations Thermometer Gauge, Calendar, and Dollar Coin Representing Progress, Goals, and Financial Planning. Blue thermometer gauge rising, calendar with marked days, and highlighted dollar coin. Ideal for funding, budgeting, savings, time management, goal tracking, project planning simple flat metaphor
Free with trial Icons like sales performance market success and ROI result help illustrate measurable business impact revenue metrics and return on investment tracking for dashboards reports and analytics platforms. Measurable icon vectors A versatile set of outline business and communication icons, including financial growth, announcement, rejection, and success. Icons like sales performance market success and ROI result help illustrate measurable business impact revenue metrics and return on investment tracking for dashboards reports and analytics platforms
Free with trial This vibrant illustration depicts the dynamic process of a startup launch and business growth. A rocket takes off from a glowing lightbulb, symbolizing the ignition of a new idea and its rapid development. Surrounding elements include a gear representing operational processes and efficiency, alongside various charts and graphs (bar charts, line graphs, pie charts) that signify data analysis, strategic planning, and measurable progress. This modern vector graphic is ideal for conveying concepts of innovation, entrepreneurship, project management, and the journey from concept to successful execution. Measurable icon vectors Startup Idea Launch and Business Growth Concept. This vibrant illustration depicts the dynamic process of a startup launch and business growth. A rocket takes. This vibrant illustration depicts the dynamic process of a startup launch and business growth. A rocket takes off from a glowing lightbulb, symbolizing the ignition of a new idea and its rapid development. Surrounding elements include a gear representing operational processes and efficiency, alongside various charts and graphs (bar charts, line graphs, pie charts) that signify data analysis, strategic planning, and measurable progress. This modern vector graphic is ideal for conveying concepts of innovation, entrepreneurship, project management, and the journey from concept to successful execution.
Free with trial Increasing bar graph with upward trending arrow symbol graphic. Measurable icon vectors Increasing bar graph with upward trending arrow symbol graphic
Free with trial A modern target icon symbolizing objectives, planning, and measurable success. Suitable for analytics dashboards, consulting presentations, corporate reports, and strategic planning visuals. Measurable icon illustrations Abstract Business Goal Target Symbol with Clean Design and Corporate Performance Focus Concept. A modern target icon symbolizing objectives, planning, and measurable success. Suitable for analytics dashboards, consulting presentations, corporate reports, and strategic planning visuals.
Free with trial Colorful target with arrow precisely hitting bullseye. Illustration represents smart goals, business strategy, planning success. Perfect for presentations, reports coaching on achieving. Measurable icon illustrations Colorful target with arrow precisely hitting bullseye. Illustration represents smart goals, business strategy, planning success.
Free with trial Featuring personal growth success target and achievement badge icons this set supports measurable progress tracking goal achievement recognition and structured self improvement planning for individuals and teams. Measurable icon vectors Business strategy and success concept with quality, task, idea, and target icons. Featuring personal growth success target and achievement badge icons this set supports measurable progress tracking goal achievement recognition and structured self improvement planning for individuals and teams
Free with trial Flat vector icons for visualizing customer feedback, survey responses and service quality on dashboards and presentations. Measurable icon vectors Satisfaction meter trio with thumbs up and thumbs down dials showing low, medium and high ratings. Flat vector icons for visualizing customer feedback, survey responses and service quality on dashboards and presentations.
Free with trial QMS linear icons set. Performance improvement. Measurable goals, accountability. Lean management. Customizable thin line symbols. Isolated vector outline illustrations. Editable stroke. Measurable icon vectors QMS linear icons set
Free with trial An isometric visualization of a customer experience framework with distinct zones for awareness, engagement, conversion, and retention. Each zone includes abstract icons, dashboards, and user touchpoints connected by clear directional paths. The composition emphasizes clarity, strategy, and measurable progress. Rendered in a flat-isometric style, the image is scalable and suitable for business and analytics stock platforms. Measurable icon illustrations An isometric customer journey map illustrating awareness, engagement, conversion, and retention stages across digital platforms. An isometric visualization of a customer experience framework with distinct zones for awareness, engagement, conversion, and retention. Each zone includes abstract icons, dashboards, and user touchpoints connected by clear directional paths. The composition emphasizes clarity, strategy, and measurable progress. Rendered in a flat-isometric style, the image is scalable and suitable for business and analytics stock platforms.
Free with trial A professional and clean black and white line art illustration of a data chart featuring a line graph that trends upward, ending in a bold arrow. The design includes clear X and Y axes with tick marks, symbolizing measurable growth, financial recovery, market success, and positive statistical momentum. This minimalist graphic is ideal for financial reports, stock market blogs, corporate presentations, and educational materials regarding economics and data visualization. Measurable icon vectors Minimalist Rising Line Graph with Upward Arrow Line Art for Business Trends and Data Success Themes. A professional and clean black and white line art illustration of a data chart featuring a line graph that trends upward, ending in a bold arrow. The design includes clear X and Y axes with tick marks, symbolizing measurable growth, financial recovery, market success, and positive statistical momentum. This minimalist graphic is ideal for financial reports, stock market blogs, corporate presentations, and educational materials regarding economics and data visualization.
Free with trial This striking 3D rendered illustration combines a teal rounded speech bubble filled with four golden stars hovering above a set of ascending orange bar chart columns on a teal base, creating a compelling visual fusion of customer satisfaction ratings and measurable business growth. The vibrant teal and warm golden-orange color palette communicates both positive feedback and upward performance in a. Measurable icon vectors A 3D teal speech bubble with golden stars floats above a rising bar chart representing customer review and growth concept. This striking 3D rendered illustration combines a teal rounded speech bubble filled with four golden stars hovering above a set of ascending orange bar chart columns on a teal base, creating a compelling visual fusion of customer satisfaction ratings and measurable business growth. The vibrant teal and warm golden-orange color palette communicates both positive feedback and upward performance in a
Free with trial SMART goals setting framework infographic with big circle vertical with 5 step points for slide presentation vector. Measurable icon vectors SMART goals setting framework infographic with big circle vertical with 5 step points for slide presentation
Free with trial SMART goals setting framework infographic with box table up and down with 5 step points for slide presentation vector. Measurable icon vectors SMART goals setting framework infographic with box table up and down with 5 step points for slide presentation
Free with trial SMART goals setting framework infographic with rectangle arrow stack with 5 step points for slide presentation vector. Measurable icon vectors SMART goals setting framework infographic with rectangle arrow stack with 5 step points for slide presentation
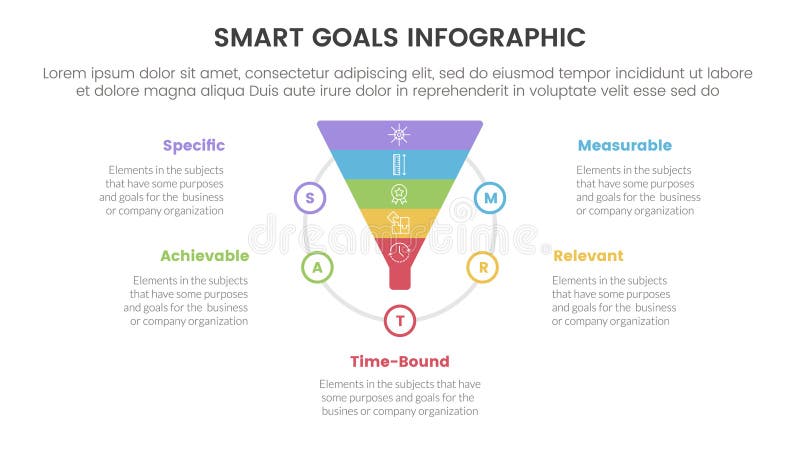
Free with trial SMART goals setting framework infographic with funnel shape on circle with 5 step points for slide presentation vector. Measurable icon vectors SMART goals setting framework infographic with funnel shape on circle with 5 step points for slide presentation
Free with trial SMART goals setting framework infographic with gear on horizontal line with 5 step points for slide presentation vector. Measurable icon vectors SMART goals setting framework infographic with gear on horizontal line with 5 step points for slide presentation
Free with trial SMART goals setting framework infographic with long rectangle top arrow with 5 step points for slide presentation vector. Measurable icon vectors SMART goals setting framework infographic with long rectangle top arrow with 5 step points for slide presentation
Free with trial SMART goals setting framework infographic with gear shape line up and down with 5 step points for slide presentation vector. Measurable icon vectors SMART goals setting framework infographic with gear shape line up and down with 5 step points for slide presentation
Free with trial SMART goals setting framework infographic with big gear on left and round rectangle stack with 5 step points for slide presentation vector. Measurable icon vectors SMART goals setting framework infographic with big gear on left and round rectangle stack with 5 step points for slide
Free with trial SMART goals setting framework infographic with outline box timeline horizontal up and down with 5 step points for slide presentation vector. Measurable icon vectors SMART goals setting framework infographic with outline box timeline horizontal up and down with 5 step points for slide
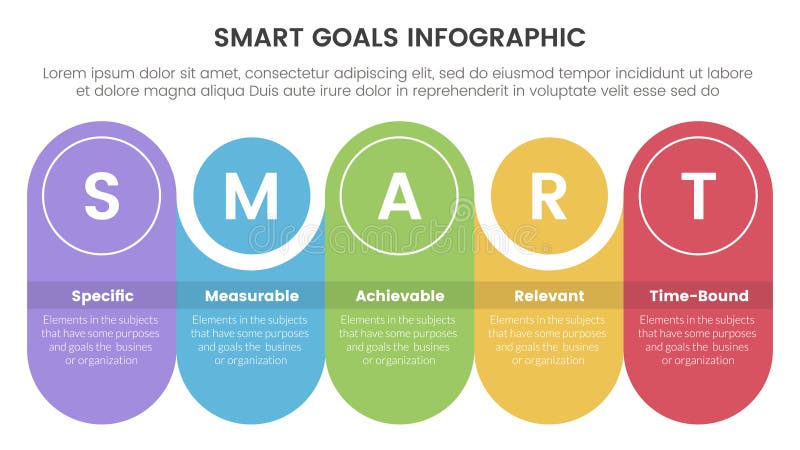
Free with trial SMART goals setting framework infographic with round rectangle with circle combination timeline with 5 step points for slide presentation vector. Measurable icon vectors SMART goals setting framework infographic with round rectangle with circle combination timeline with 5 step points for slide
Free with trial SMART goals setting framework infographic with outline box with circle header badge with 5 step points for slide presentation vector. Measurable icon vectors SMART goals setting framework infographic with outline box with circle header badge with 5 step points for slide presentation
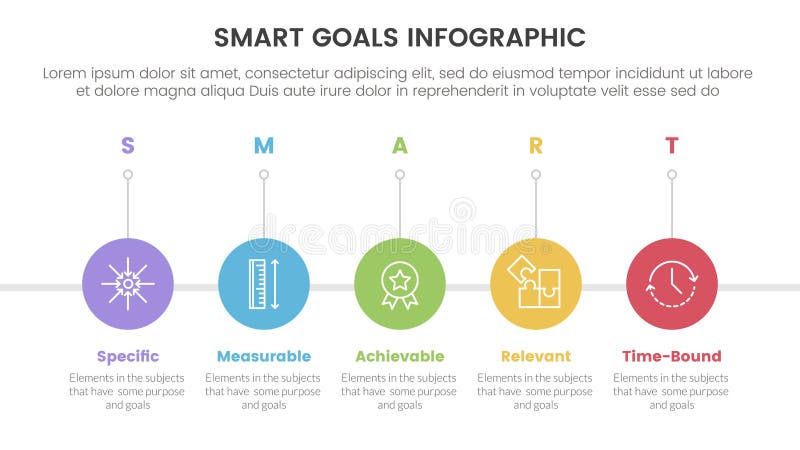
Free with trial SMART goals setting framework infographic with timeline circle right direction with 5 step points for slide presentation vector. Measurable icon vectors SMART goals setting framework infographic with timeline circle right direction with 5 step points for slide presentation
Free with trial SMART goals setting framework infographic with big circle stack arrow structure with 5 step points for slide presentation vector. Measurable icon vectors SMART goals setting framework infographic with big circle stack arrow structure with 5 step points for slide presentation
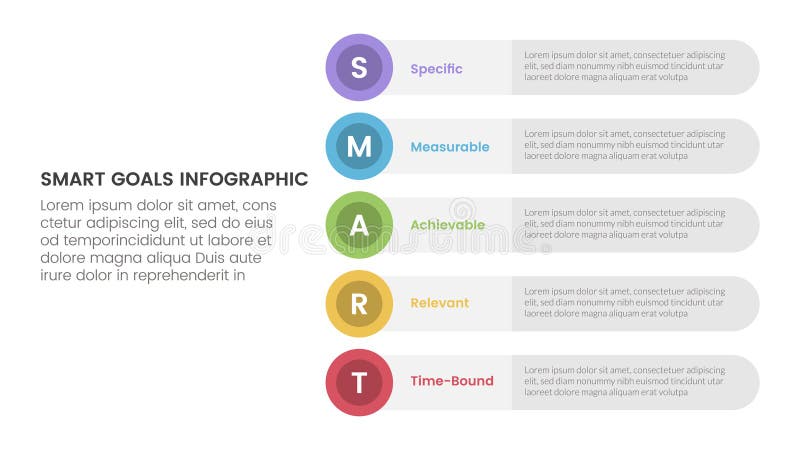
Free with trial SMART goals setting framework infographic with big round rectangle box and vertical point stack with 5 step points for slide presentation vector. Measurable icon vectors SMART goals setting framework infographic with big round rectangle box and vertical point stack with 5 step points for slide
Free with trial SMART goals setting framework infographic with round circle rectangle stack vertical with 5 step points for slide presentation vector. Measurable icon vectors SMART goals setting framework infographic with round circle rectangle stack vertical with 5 step points for slide presentation
Free with trial A flat design vector illustration showing two business professionals, a man and a woman, engaged in a conceptual exchange. The man's thought bubble contains a glowing lightbulb, symbolizing new ideas, creativity, and innovation. The woman's thought bubble features a gear icon and a rising bar chart, representing strategy, execution, process, and business growth. A connecting line between their thoughts illustrates the transformation of ideas into actionable plans and measurable results. This image effectively conveys concepts of collaboration, strategic planning, project development, and turning innovation into successful outcomes. Measurable icon illustrations Idea to Execution: Business Strategy and Collaboration Concept. A flat design vector illustration showing two business professionals, a man and a woman, engaged in a conceptual exchange. The man's thought bubble contains a glowing lightbulb, symbolizing new ideas, creativity, and innovation. The woman's thought bubble features a gear icon and a rising bar chart, representing strategy, execution, process, and business growth. A connecting line between their thoughts illustrates the transformation of ideas into actionable plans and measurable results. This image effectively conveys concepts of collaboration, strategic planning, project development, and turning innovation into successful outcomes.
Free with trial SMART goals setting framework infographic with rectangle round stack vertical with 5 step points for slide presentation vector. Measurable icon vectors SMART goals setting framework infographic with rectangle round stack vertical with 5 step points for slide presentation
Free with trial SMART goals setting framework infographic with gear cycle arrow circular on horizontal direction with 5 step points for slide presentation vector. Measurable icon vectors SMART goals setting framework infographic with gear cycle arrow circular on horizontal direction with 5 step points for slide
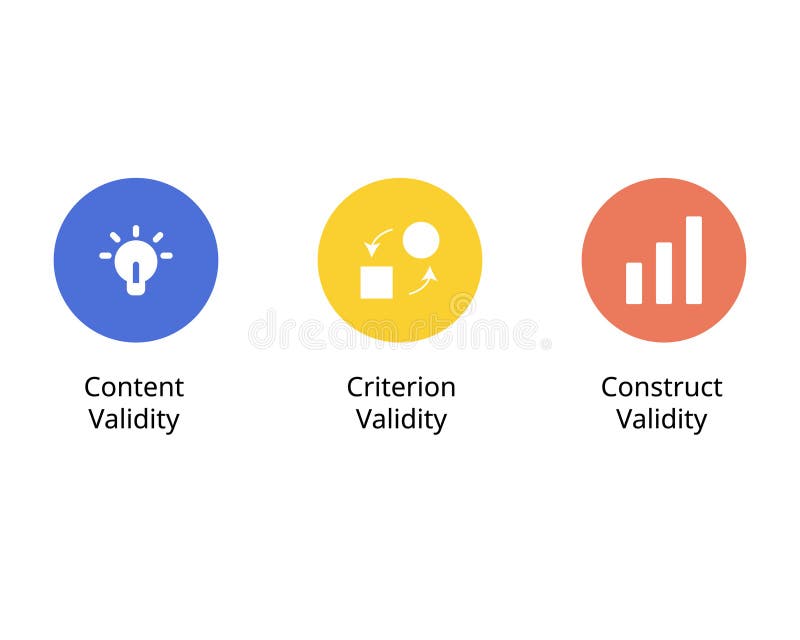
Free with trial Difference of Content Validity, Criterion Validity, Construct Validity vector. Measurable icon vectors Difference of Content Validity, Criterion Validity, Construct Validity
Free with trial This graphic illustrates the SMART goals framework, a helpful tool for setting and achieving objectives. Measurable icon illustrations SMART goals concept with icons on a black background for business planning. This graphic illustrates the SMART goals framework, a helpful tool for setting and achieving objectives
Free with trial A human hand carefully places a green block with a white heart symbol onto an ascending bar graph of similar blocks, demonstrating a clear upward trend. This conceptual image, set against a soft yellow background, illustrates the progressive growth of social media engagement, customer loyalty, or increasing positive feedback. It's ideal for themes of business success, relationship development, and measurable progress. Measurable icon illustrations Hand Building Green Heart Blocks Graph Illustrating Social Media Engagement and Love Growth. A human hand carefully places a green block with a white heart symbol onto an ascending bar graph of similar blocks, demonstrating a clear upward trend. This conceptual image, set against a soft yellow background, illustrates the progressive growth of social media engagement, customer loyalty, or increasing positive feedback. It's ideal for themes of business success, relationship development, and measurable progress.
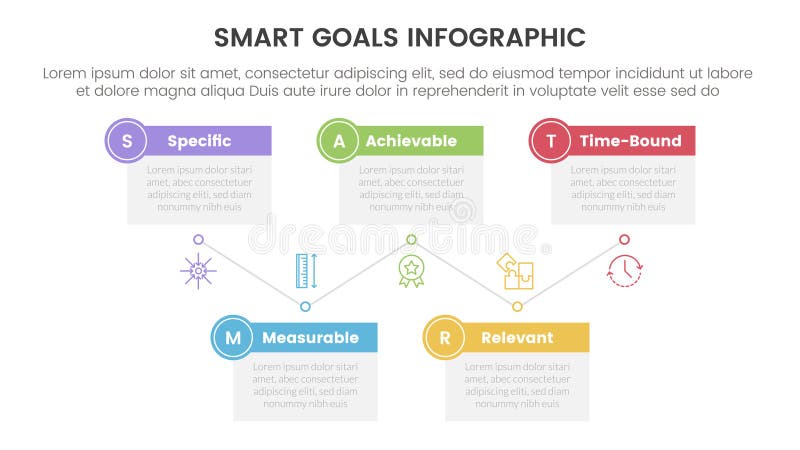
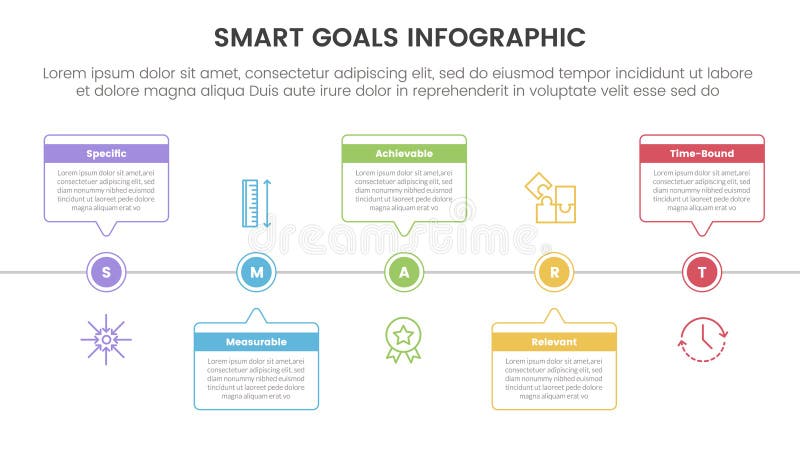
Free with trial Flat vector infographic illustrating the five SMART goal setting steps. Ideal for business planning, project strategy, and productivity visuals. Measurable icon vectors Smart goal setting steps vector infographic flat design. Flat vector infographic illustrating the five SMART goal setting steps. Ideal for business planning, project strategy, and productivity visuals.
Free with trial KPI text beside interconnected cubes highlights data tracking, performance metrics, and measurable goals. Ideal for analytics, strategy, planning, productivity, efficiency, progress simple flat. Measurable icon vectors KPI with Networked Cubes Representing Data Analysis and Performance Tracking. KPI text beside interconnected cubes highlights data tracking, performance metrics, and measurable goals. Ideal for analytics, strategy, planning, productivity, efficiency, progress simple flat
Free with trial A conceptual vector illustration of a magnifying glass examining abstract bar graphs, symbolizing quantitative analysis, statistical research, or numerical data interpretation. This design is ideal for scientific studies, financial reporting, or business intelligence platforms, providing a clear and precise visual for exploring and understanding measurable information, vector design Generative AI. Measurable icon vectors Quantitative Analysis Search Icon, vector design Generative AI. A conceptual vector illustration of a magnifying glass examining abstract bar graphs, symbolizing quantitative analysis, statistical research, or numerical data interpretation. This design is ideal for scientific studies, financial reporting, or business intelligence platforms, providing a clear and precise visual for exploring and understanding measurable information, vector design Generative AI
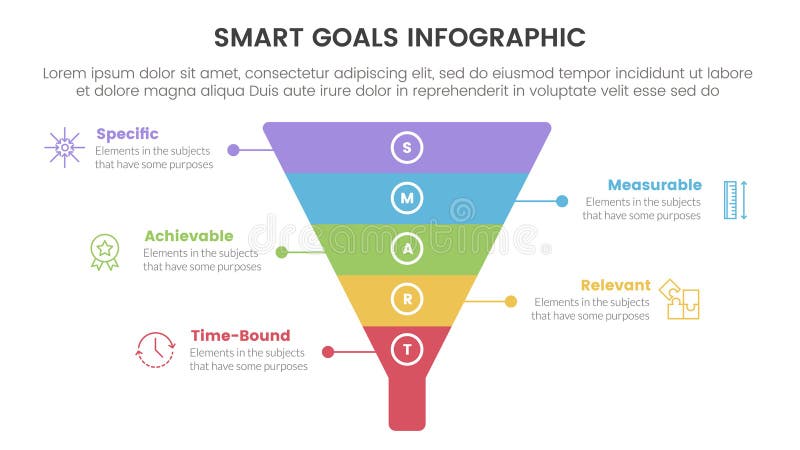
Free with trial SMART goals setting framework infographic with funnel pyramid shape with 5 step points for slide presentation vector. Measurable icon vectors SMART goals setting framework infographic with funnel pyramid shape with 5 step points for slide presentation
Free with trial SMART goals setting framework infographic with funnel shrink v shape with 5 step points for slide presentation vector. Measurable icon vectors SMART goals setting framework infographic with funnel shrink v shape with 5 step points for slide presentation
Free with trial Blue line graph with data points, vertical bar chart, magnifying glass, and CRM text. Ideal for analytics, data tracking, customer insights, marketing, performance growth technology productivity. Measurable icon vectors CRM Data Analysis With Rising Graph, Bars, and Magnifying Glass for Growth Insights. Blue line graph with data points, vertical bar chart, magnifying glass, and CRM text. Ideal for analytics, data tracking, customer insights, marketing, performance growth technology productivity
Free with trial Magnifying glass focuses on data visualization with pie chart, global network wireframe. Ideal for analysis, research, insight, exploration, data management, innovation scientific study. Simple flat. Measurable icon vectors Hand holding magnifying glass examining data charts and global network connections. Magnifying glass focuses on data visualization with pie chart, global network wireframe. Ideal for analysis, research, insight, exploration, data management, innovation scientific study. Simple flat
Free with trial SMART goals setting framework infographic with funnel bending on center with 5 step points for slide presentation vector. Measurable icon vectors SMART goals setting framework infographic with funnel bending on center with 5 step points for slide presentation
Free with trial Bar charts, pie chart, and progress bar illustrating analytics and measurable results. Ideal for business strategy, progress tracking, data insights, performance reviews, financial reports. Measurable icon vectors Data analysis and performance metrics with bar charts, pie chart, and progress bar visualization. Bar charts, pie chart, and progress bar illustrating analytics and measurable results. Ideal for business strategy, progress tracking, data insights, performance reviews, financial reports
Free with trial SMART goals setting framework infographic with funnel cutted or sliced shape with 5 step points for slide presentation vector. Measurable icon vectors SMART goals setting framework infographic with funnel cutted or sliced shape with 5 step points for slide presentation
Free with trial SMART goals setting framework infographic with height rectangle shape balance with 5 step points for slide presentation vector. Measurable icon vectors SMART goals setting framework infographic with height rectangle shape balance with 5 step points for slide presentation
Free with trial SMART goals setting framework infographic with creative square box slice timeline horizontal with 5 step points for slide presentation vector. Measurable icon vectors SMART goals setting framework infographic with creative square box slice timeline horizontal with 5 step points for slide
Free with trial SMART goals setting framework infographic with big circle timeline ups and down with 5 step points for slide presentation vector. Measurable icon vectors SMART goals setting framework infographic with big circle timeline ups and down with 5 step points for slide presentation