Free with trial Albinism vector illustration. Labeled medical melanin pigment loss scheme. Genetic problem with skin, eyes, eyebrows and hair color symptoms. Compared normal skin cross section with lack of melanocyte. Normal cross vectors Albinism vector illustration. Labeled medical melanin pigment loss scheme.
Free with trial Make a bold statement with this Christian t-shirt design featuring the message "Normal Isn’t Coming Back, Jesus Is" along with a powerful cross. Inspired by Revelation 14, this design speaks to faith, change, and hope, offering a modern and impactful way to showcase your Christian belief. Normal cross vectors Normal Isn’t Coming Back Jesus Is Christian T-shirt Design with Cross. Make a bold statement with this Christian t-shirt design featuring the message "Normal Isn’t Coming Back, Jesus Is" along with a powerful cross. Inspired by Revelation 14, this design speaks to faith, change, and hope, offering a modern and impactful way to showcase your Christian belief
Free with trial Normal, dry and oily skin. Acne. Skin disorder. Cross-section of the human skin. Normal cross vectors Normal, dry and oily skin. Acne. Skin disorder
Free with trial Normal artery, inflamed or narrowed artery and artery with an aneurysm. cross-section. Normal cross vectors Normal artery, inflamed or narrowed artery and artery with an an
Free with trial Human silhouette in the cross shape, normal sinus heart rhythm. Beautiful colorful health care icon with reflection. Normal cross vectors Human silhouette in the cross shape
Free with trial Make a bold statement with this Christian t-shirt design featuring the message "Normal Isn’t Coming Back, Jesus Is" along with a powerful cross. Inspired by Revelation 14, this design speaks to faith, change, and hope, offering a modern and impactful way to showcase your Christian belief. Normal cross vectors Normal Isn’t Coming Back Jesus Is Christian T-shirt Design with Cross. Make a bold statement with this Christian t-shirt design featuring the message "Normal Isn’t Coming Back, Jesus Is" along with a powerful cross. Inspired by Revelation 14, this design speaks to faith, change, and hope, offering a modern and impactful way to showcase your Christian belief
Free with trial Laryngitis is inflammation of the voice box. normal and Inflamed larynx. Cross section of the voice box. Vocal cords, thyroid cartilage and trachea. Human anatomy. Vector illustration for medical and educational use. Normal cross vectors Laryngitis. normal and Inflamed larynx. Laryngitis is inflammation of the voice box. normal and Inflamed larynx. Cross section of the voice box. Vocal cords, thyroid cartilage and trachea. Human anatomy. Vector illustration for medical and educational use.
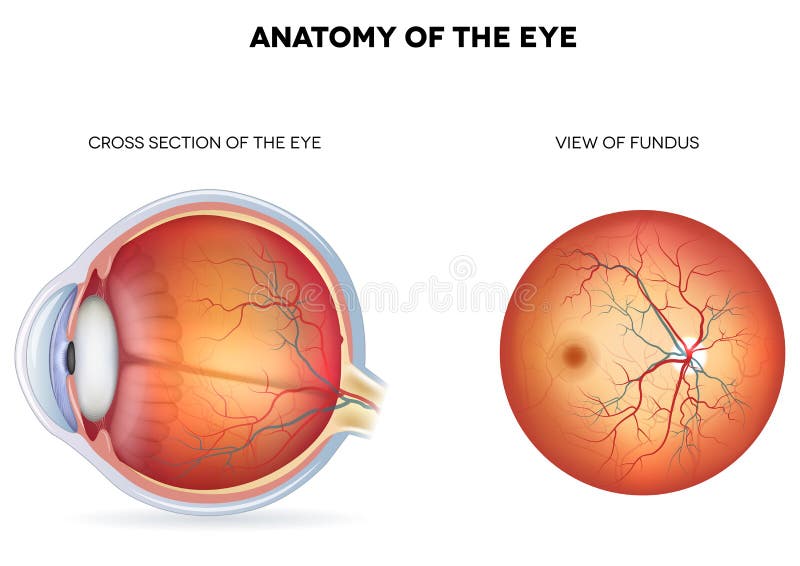
Free with trial Anatomy of the eye, cross section and view of fundus. Detailed illustration. Normal cross vectors Anatomy of the eye, cross section and view of fund
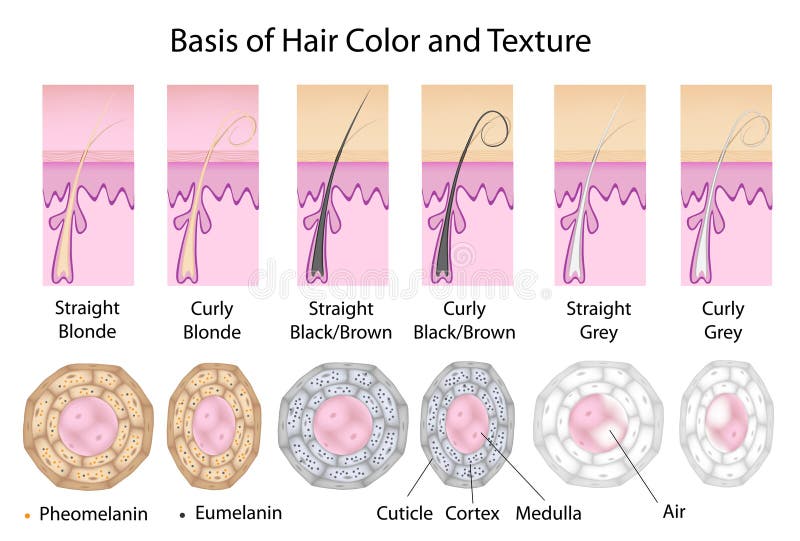
Free with trial In cross section straight hair is round and curly is flatten. Black hair has mostly eumelanin, blonde has more pheomelanin. Grey hair has no pigment and has air in the medulla. Eps8, gradient and mesh printing compatible. Normal cross vectors Cross section of different hair texture and color. In cross section straight hair is round and curly is flatten. Black hair has mostly eumelanin, blonde has more pheomelanin. Grey hair has no pigment and has air in the medulla. Eps8, gradient and mesh printing compatible
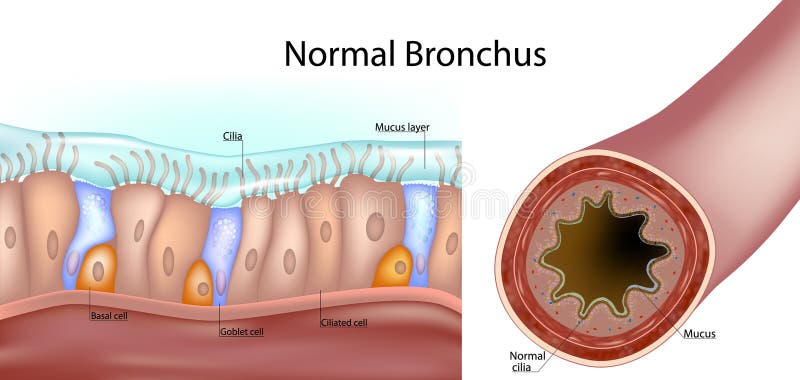
Free with trial Structure of a normal human bronchus. Cross-section of the airway and a close-up of the pseudostratified ciliated epithelium with ciliated cells, goblet cells, basal cells, and the mucus layer. Normal cross vectors Structure of a normal human bronchus. Cross-section of the airway and a close-up of the pseudostratified ciliated epithelium with. Ciliated cells, goblet cells. Structure of a normal human bronchus. Cross-section of the airway and a close-up of the pseudostratified ciliated epithelium with ciliated cells, goblet cells, basal cells, and the mucus layer.
Free with trial Medical icon with green cross and normal heart rate. Normal cross vectors Medical icon
Free with trial Illustration showing Varicose Veins and normal veins. Isolated white background. Normal cross vectors Varicose Veins and normal veins
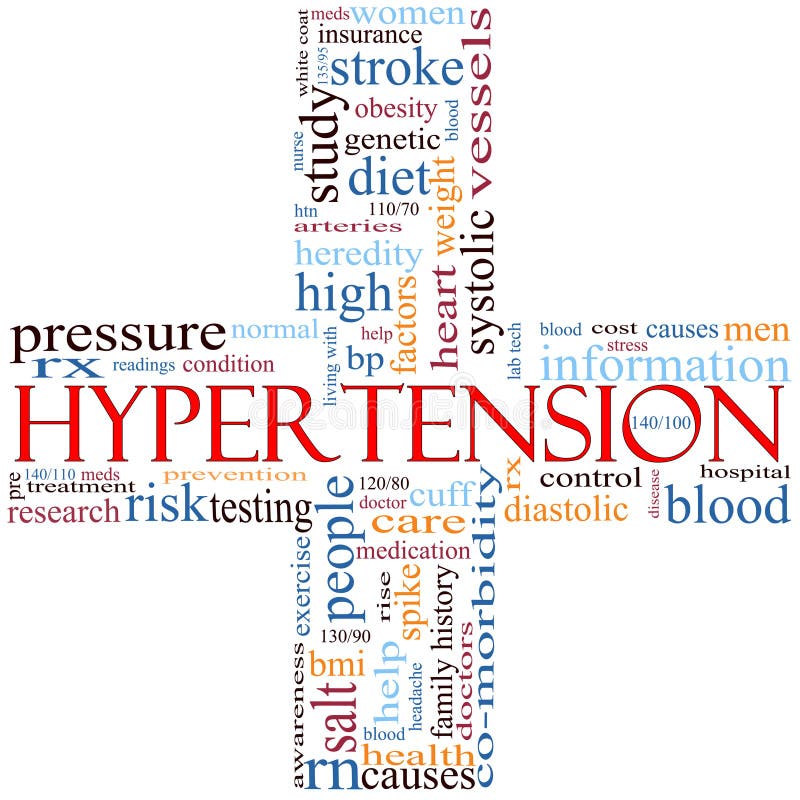
Free with trial A cross shaped word cloud concept around the word Hypertension and other words including high, blood, pressure, doctor, readings, and more. Normal cross illustrations Hypertension cross word cloud. A cross shaped word cloud concept around the word Hypertension and other words including high, blood, pressure, doctor, readings, and more.
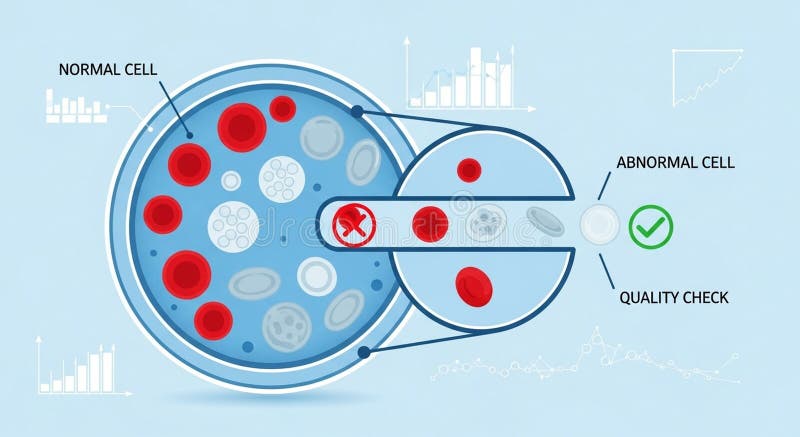
Free with trial An illustrated diagram displays a petri dish with cells, labeled as normal and abnormal. Normal cells are red, while abnormal ones are gray with a cross mark. A magnifying section highlights these differences, with a check mark indicating a quality check process. The background features molecular structures and graphs, suggesting a scientific or analytical setting. The focus is on identifying cell types, relevant in medical or laboratory environments. Normal cross illustrations An illustrated diagram displays a petri dish with cells, labeled as normal and
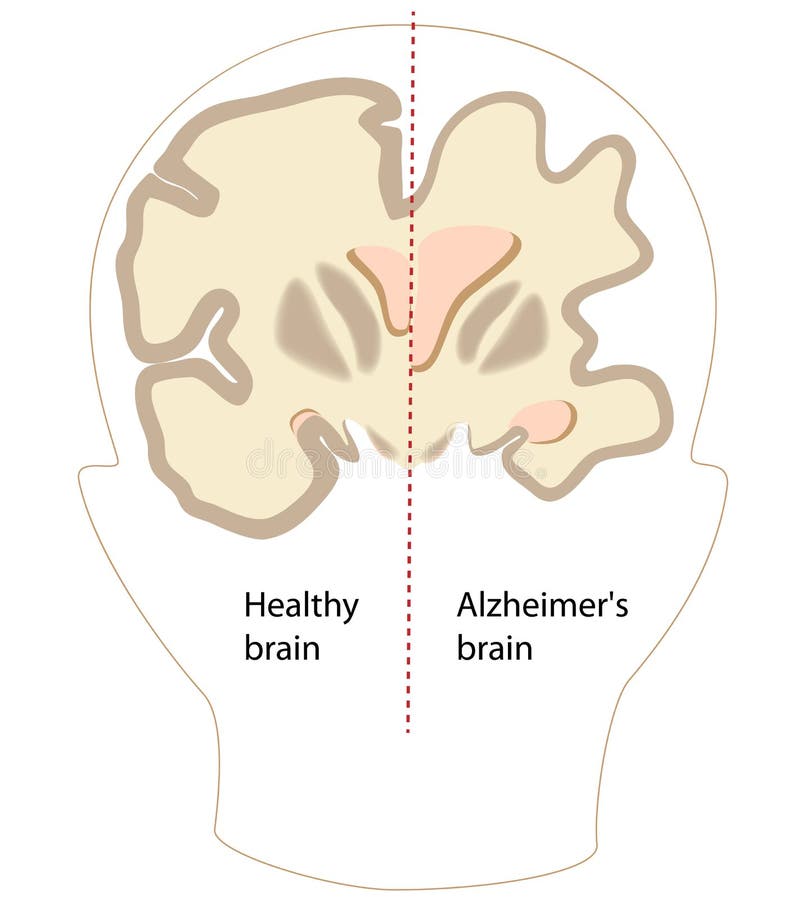
Free with trial The human brain. Cross section. Healthy and brain with Alzheimer`s disease dementia, senility. Normal cross vectors Cross-section of the human brain with Alzheimer`s disease. The human brain. Cross section. Healthy and brain with Alzheimer`s disease dementia, senility
Free with trial Isolated brain cross section. Illustration of human brain for medical design or study. Set illustration of parts cerebellum: thalamus, hypothalamus, pineal gland and other. Easy recolor. Normal cross vectors Isolated brain cross section.
Free with trial Cholangitis Ascending cholangitis, acute cholangitis is an infection of the bile duct. Cross section of the human liver, bile duct, and gallbladder. vector illustration for medical, educational and science use. Normal cross vectors Cholangitis. Cross section of the human liver, bile duct, and ga. Cholangitis Ascending cholangitis, acute cholangitis is an infection of the bile duct. Cross section of the human liver, bile duct, and gallbladder. vector illustration for medical, educational and science use
Free with trial Illustration of a cell sorting process. A large circle labeled "Normal Cell" contains various red and grey circular shapes, representing a mix of normal and abnormal components. A smaller section filters out abnormal cells, indicated by a red cross, while normal cells pass through, marked with a green check. Bar graphs and line charts in the background suggest data analysis. The design uses shades of blue, red, and grey, emphasizing a scientific and analytical theme. Normal cross illustrations Illustration of a cell sorting process. A large circle labeled \'Normal Cell\' contains. Illustration of a cell sorting process. A large circle labeled "Normal Cell" contains various red and grey circular shapes, representing a mix of normal and abnormal components. A smaller section filters out abnormal cells, indicated by a red cross, while normal cells pass through, marked with a green check. Bar graphs and line charts in the background suggest data analysis. The design uses shades of blue, red, and grey, emphasizing a scientific and analytical theme.
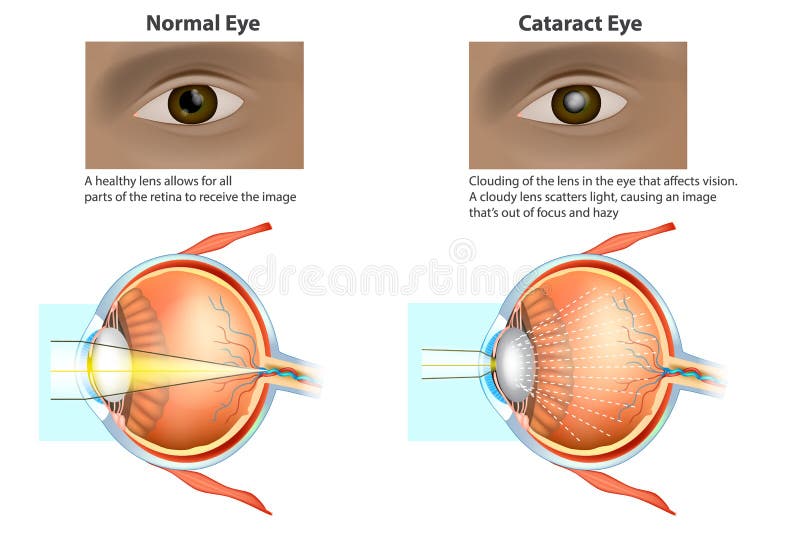
Free with trial Сataract is a clouding of the lens. Medical illustration of a normal eye and an eye with a cataract, clouded lens. Normal cross vectors Medical illustration of a normal eye and an eye with a cataract
Free with trial Cataracts Vision Disorder and Normal Eye Vision Anatomy Vector illustration. Normal cross vectors Cataracts Vision Disorder and Normal Eye Vision Anatomy
Free with trial Coeliac disease is a autoimmune disorder that affects the small intestine. Signs and symptoms of celiac disease. Cross section of small bowel with normal and shortening of the villi villous atrophy. Vector illustration. Normal cross vectors Coeliac disease. celiac autoimmune disorder. Coeliac disease is a autoimmune disorder that affects the small intestine. Signs and symptoms of celiac disease. Cross section of small bowel with normal and shortening of the villi villous atrophy. Vector illustration
Free with trial Anatomy of the Spinal Cord and Intervertebral Disc Cross Section Illustration. Medical Diagram of Normal Intervertebral Disc and Spinal Cord Structure. Educational Anatomy Chart of Spinal Nerve, Disc, and Spinal Cord. Normal cross vectors Anatomy of the Spinal Cord and Intervertebral Disc Cross Section Illustration. Medical Diagram of Normal Intervertebral Disc and
Free with trial Urinary bladder with urine. Cross section of urinary bladder. X-Ray view. Normal cross illustrations Urinary bladder with urine. Cross section of urinary bladder.
Free with trial Cross section of the mouth and throat, showing action of the epiglottis during normal swallowing and aspiration of vomit in the unconscious. Created in Adobe Illustrator. EPS 10. Normal cross vectors The airway in conscious and unconscious patients. Cross section of the mouth and throat, showing action of the epiglottis during normal swallowing and aspiration of vomit in the unconscious. Created in Adobe Illustrator. EPS 10.
Free with trial Cardiomyopathy - human heart medical disorders cross section diagram, vector illustration examples with normal, dilated, hypertrophic and restrictive conditions. Heart muscle diseases. Normal cross vectors Cardiomyopathy medical disorders cross section diagram, vector illustration examples. Cardiomyopathy - human heart medical disorders cross section diagram, vector illustration examples with normal, dilated, hypertrophic and restrictive conditions. Heart muscle diseases.
Free with trial Educational medical diagram showing different types of ingrown hairs in human skin cross-section. Illustration presents normal hair growth, hair trapped under the skin, curling back into the dermis, and inflamed ingrown hair. Normal cross vectors Educational medical diagram showing different types of ingrown hairs in human skin cross-section. Illustration presents normal
Free with trial Cross section of the human brain. Healthy brain compared to Alzheimer`s disease dementia, senility. Normal cross vectors Cross section of the human brain. Healthy brain compared to Alzh
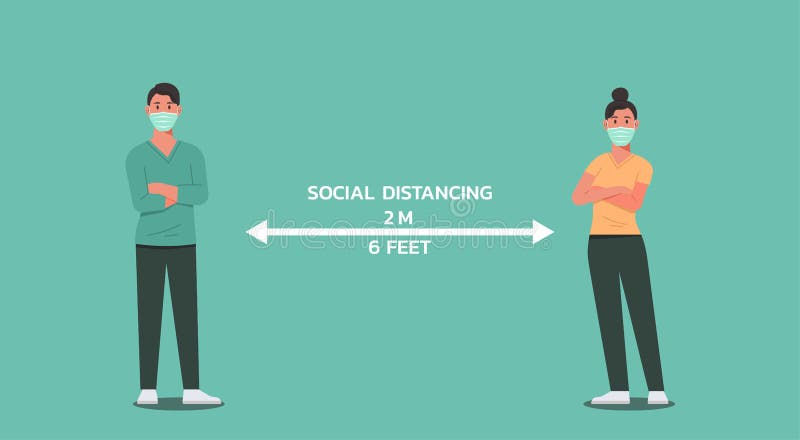
Free with trial Man and woman wear face mask and cross their arms standing together maintain social distancing, keep distance, character flat vector illustration. Normal cross vectors Man and woman wear face mask and cross their arms standing together maintain social distancing
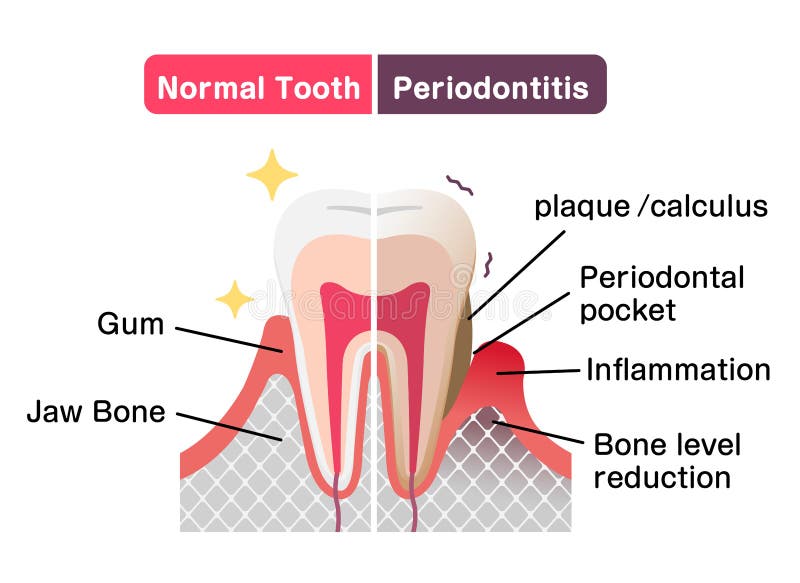
Free with trial Comparison of normal teeth and periodontal disease. flat vector illustration. Normal cross vectors Comparison of normal teeth and periodontal disease. flat vector illustration
Free with trial Cross-section illustration of a normal body. Normal cross vectors Cross-section illustration of a normal body
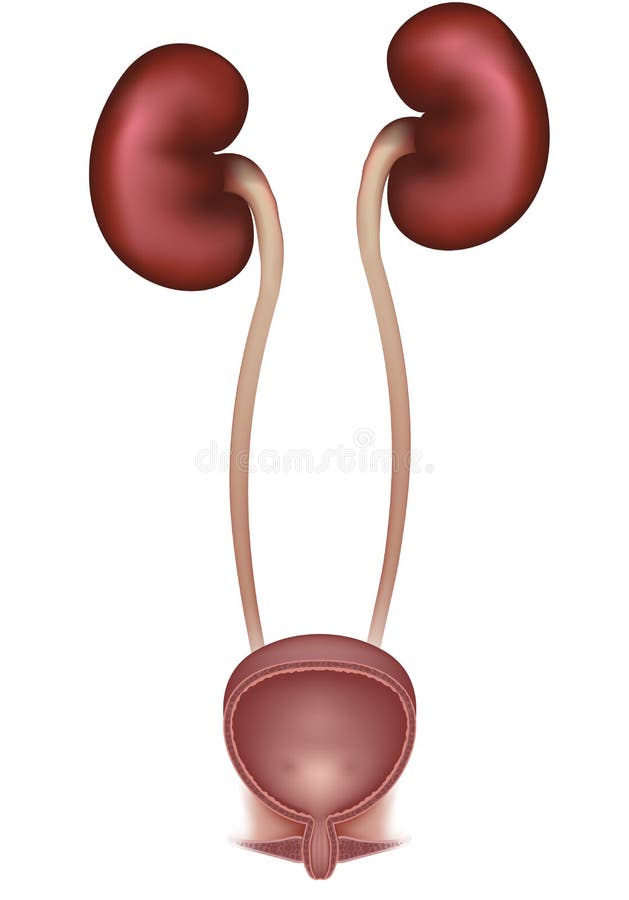
Free with trial Kidneys and cross section of urinary bladder, urinary system (female). Detailed medical illustration. Normal cross vectors Kidneys and urinary bladder. Kidneys and cross section of urinary bladder, urinary system (female). Detailed medical illustration.
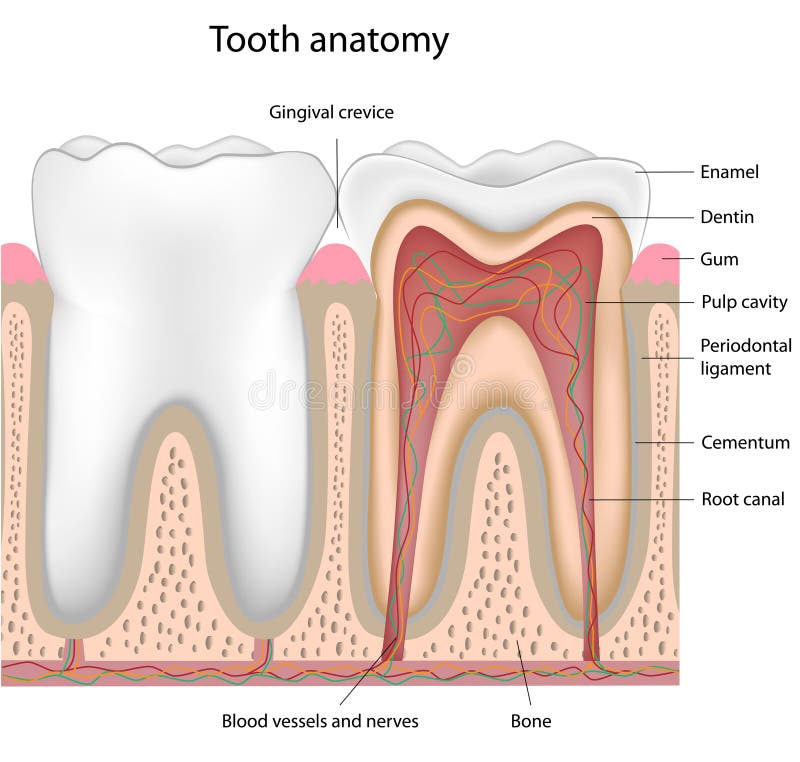
Free with trial Cross section of a human tooth, eps8, gradient and mesh printing compatible. Normal cross vectors Tooth anatomy, eps8. Cross section of a human tooth, eps8, gradient and mesh printing compatible
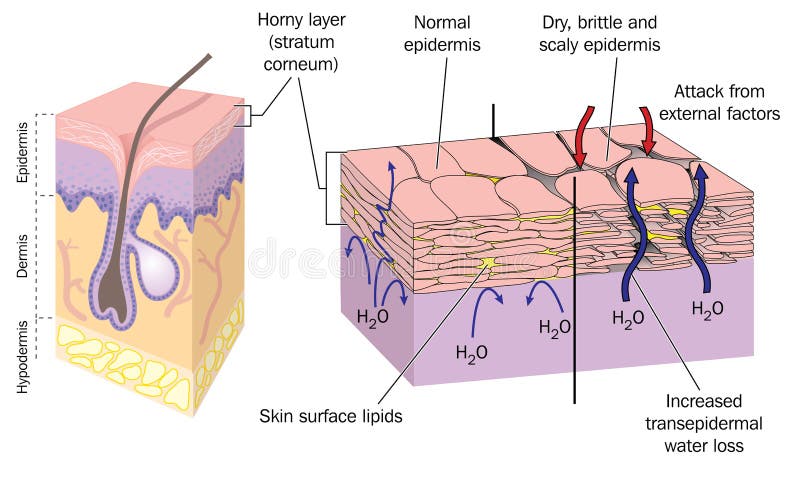
Free with trial Section through skin showing normal epidermis and skin surface structure resulting in water loss and dry, brittle, scaly skin. Created in Adobe Illustrator. EPS 10. Normal cross vectors Dry skin. Section through skin showing normal epidermis and skin surface structure resulting in water loss and dry, brittle, scaly skin. Created in Adobe Illustrator. EPS 10.
Free with trial Cross-sectional diagrams compare a normal airway and an asthmatic airway. The normal airway has smooth muscle and a clear airway passage, while the asthmatic airway shows inflammation, mucus plugs, and constriction. The asthmatic side demonstrates excess mucus and thickened airway walls, indicating blockage and airflow restriction common in asthma. Labels point to structural differences, highlighting the impact of asthma on breathing. Normal cross illustrations Cross-sectional diagrams compare a normal airway and an asthmatic airway. The
Free with trial Anatomy of the healthy eye, detailed illustration. Normal cross vectors Normal eye. Anatomy of the healthy eye, detailed illustration
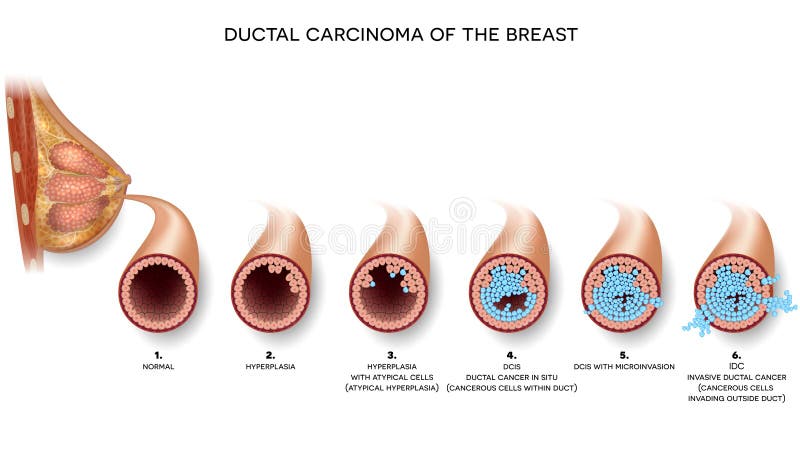
Free with trial Ductal carcinoma of the breast cross section anatomy, detailed anatomy illustration. At the beginning normal duct, then hyperplasia, after that atypical cells are invading. Normal cross vectors Breast carcinoma. Ductal carcinoma of the breast cross section anatomy, detailed anatomy illustration. At the beginning normal duct, then hyperplasia, after that atypical cells are invading
Free with trial Alzheimer disease brain compared to normal, eps8. Normal cross vectors Alzheimer disease
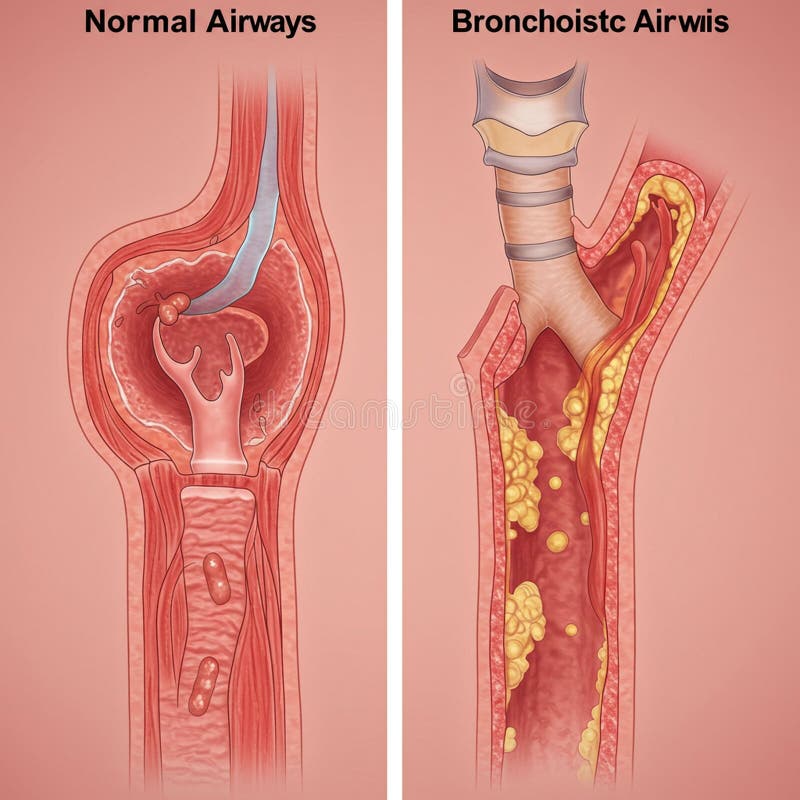
Free with trial Bronchiectasis and Normal Bronchus Cross Section Medical Illustration. Airway Damage Comparison in Bronchiectasis Anatomy Diagram. Normal cross vectors Bronchiectasis and Normal Bronchus Cross Section Medical Illustration. Airway Damage Comparison in Bronchiectasis Anatomy
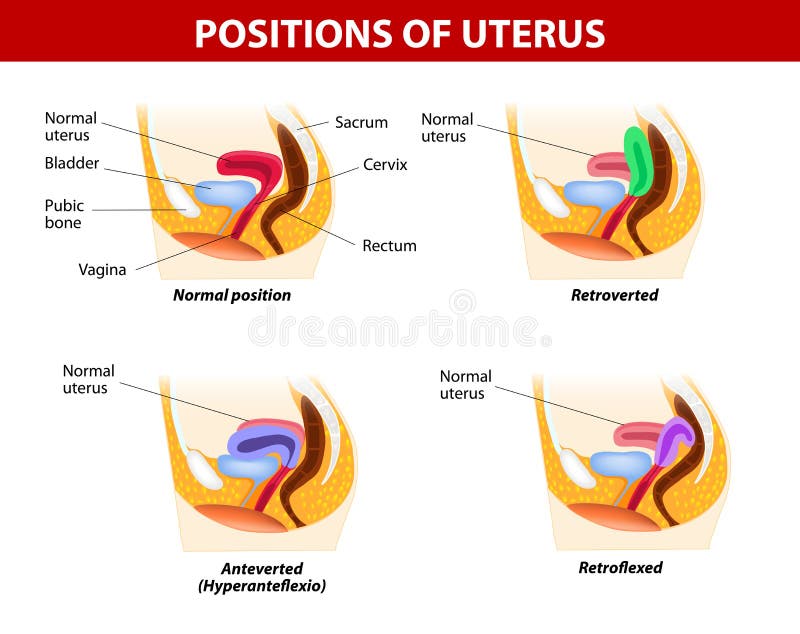
Free with trial Diagram for variants of uterine position. Normal uterus rests on the superior surface of the empty bladder. Normal Uterus Positions: Anteflexed and Anteverted. Abnormal Uterus Positions: Retroflexed and Retroverted. Normal cross vectors Positions of uterus. Diagram for variants of uterine position. Normal uterus rests on the superior surface of the empty bladder. Normal Uterus Positions: Anteflexed and Anteverted. Abnormal Uterus Positions: Retroflexed and Retroverted
Free with trial Urinary bladder with urine. Cross section of urinary bladder. Detailed illustration. Normal cross vectors Urinary bladder with urine
Free with trial Female urinary bladder and kidneys, cross section of the kidney and urinary bladder, blood supply to the kidney. Normal cross vectors Urinary bladder and kidneys
Free with trial Comparison of oily, normal and dry skin vector illustration. Cross section of oily skin overproduction of sebum, normal skin keep moisturize, prevent water loss and lack of sebum in dry skin. Normal cross vectors Comparison of oily, normal and dry skin vector illustration.
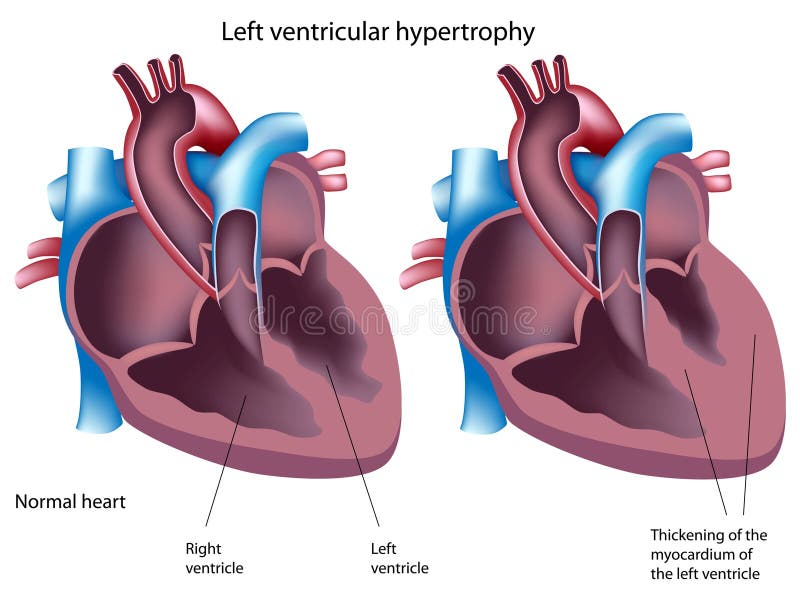
Free with trial Normal heart and heart with left ventricular hypertrophy, eps8. Normal cross vectors Left ventricular hypertrophy
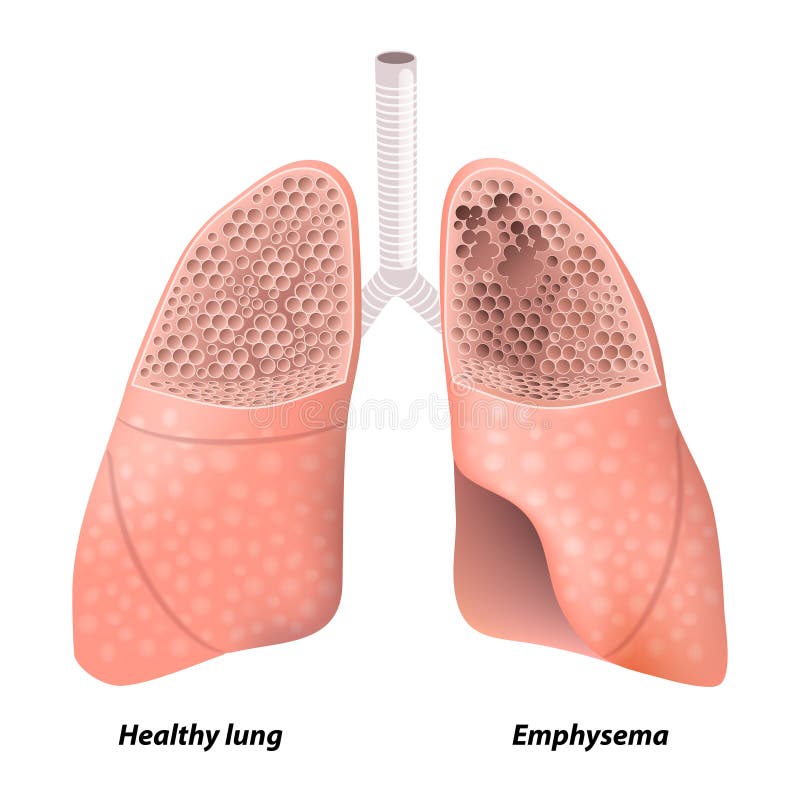
Free with trial Emphysema. Chronic obstructive pulmonary disease. diagram showing a cross-section of normal lung and lungs damaged by COPD. Human anatomy. Normal cross vectors Chronic obstructive pulmonary disease
Free with trial Healthy vein and Varicose vein. human veins. Vector diagram. Normal cross vectors Normal vein and Varicose vein. Healthy vein and Varicose vein. human veins. Vector diagram
Free with trial Diagram illustrating pregnancy stages: normal uterus size and first, second, third trimesters. Each stage shows the uterus, fetus growth, and anatomical changes. Labels contain misspellings: "NORRAL SIZE," "FERST TIRMET," "FITUS CANALORURA," "MES WARTERTUPE. " The first trimester mentions "Size Cantloupe," second "Size Emetion," third "Size Fetion. " The uterus and fetus are shown in cross-sectional views with developing size and position changes. Normal cross illustrations Diagram illustrating pregnancy stages: normal uterus
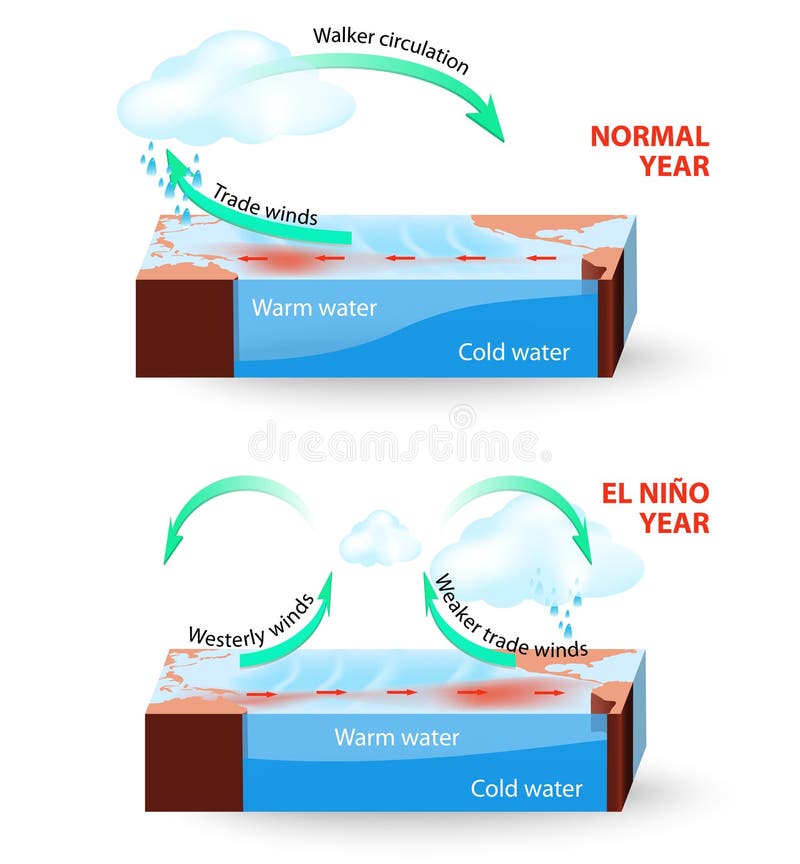
Free with trial El Nino Southern Oscillation (ENSO) is a global phenomenon in ocean and atmosphere. For an unknown reason El Nino events occur irregularly at intervals once every 2-7 years. The effects of El Niño mess up normal winter conditions throughout the Pacific Ocean and change global weather patterns and disrupt fisheries worldwide. Normal cross vectors Vector infographic. Cross section of El Nino South. El Nino Southern Oscillation (ENSO) is a global phenomenon in ocean and atmosphere. For an unknown reason El Nino events occur irregularly at intervals once every 2-7 years. The effects of El Niño mess up normal winter conditions throughout the Pacific Ocean and change global weather patterns and disrupt fisheries worldwide.
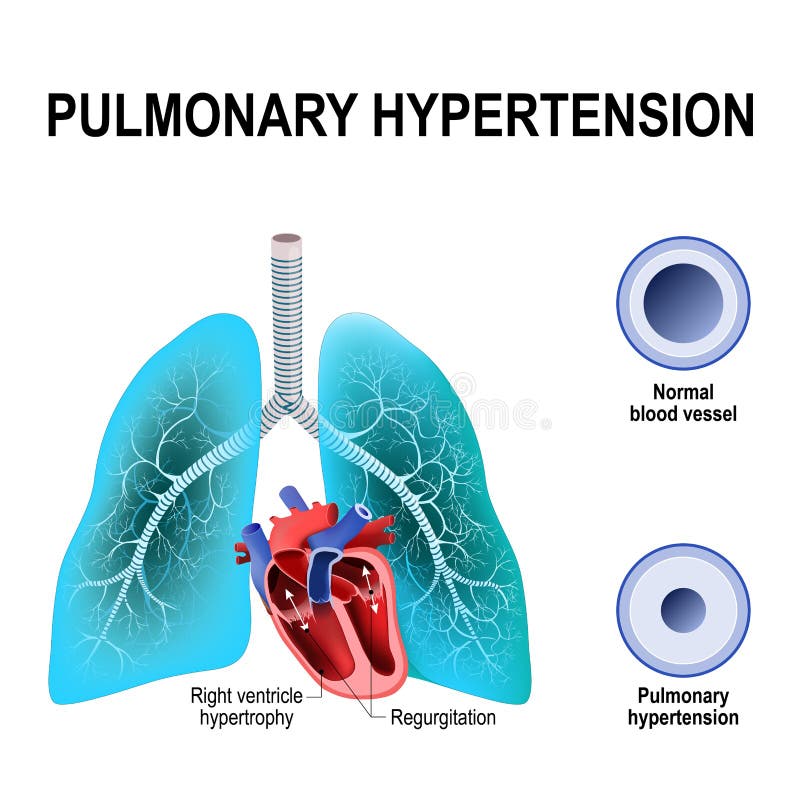
Free with trial Pulmonary hypertension is an increased blood pressure within the arteries of the lungs. Cross section of the Normal, and narrowing of blood vessels. Humans heart with hypertrophy of Right ventricle and pulmonic regurgitation. Normal cross vectors Pulmonary hypertension
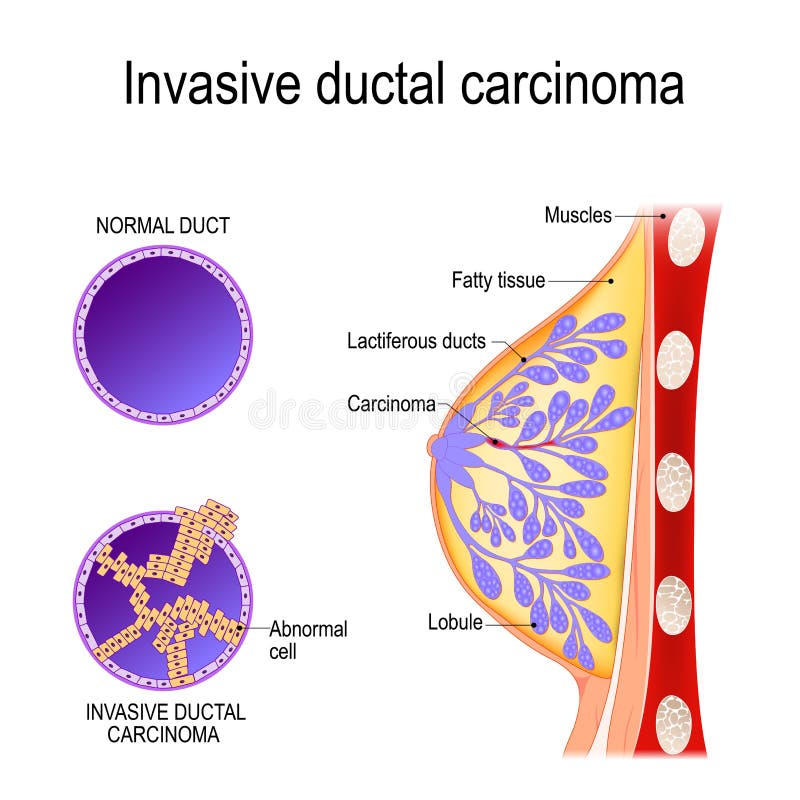
Free with trial Invasive ductal carcinoma. cross-section scheme of the mammary gland. Breast with cancer, and cross-section of the Lactiferous ducts with normal and abnormal cells. Vector illustration for medical use. Normal cross vectors Invasive ductal carcinoma
Free with trial Diagram illustrating cervical dysplasia stages: Normal, CIN 1, CIN 2, and CIN 3 CIS. Each section shows cross-sections of cervical tissue with varying cell abnormalities. "Normal" displays healthy cells, while "CIN 1" shows minor alterations. "CIN 2" presents moderate dysplasia with increased cellular changes. "CIN 3 CIS" exhibits severe dysplasia or carcinoma in situ with significant cell alterations. Labels include "Basement membrane," "Epithelial," and "Stroma," highlighting tissue layers. Vivid colors distinguish cellular structures, aiding in visual differentiation of stages. Normal cross illustrations Diagram illustrating cervical dysplasia stages: Normal
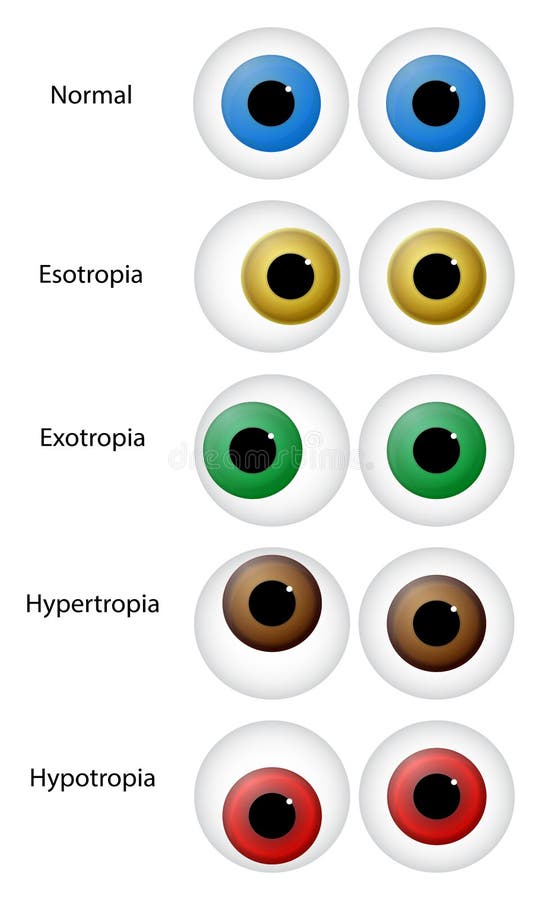
Free with trial Illustration Of Different Eye Disorders. Gaze disorders or ocular misalignment disorders (strabismus) include: esotropia (inward-aiming, convergent or cross-eye), exotropia (outward-aiming, divergent or wall-eye), hypertropia (high-aiming eye or vertical strabismus), and hypotropia (low-aiming eye). Normal cross vectors Eye Disorders
Free with trial Eye with Diabetic retinopathy, vision disorder and normal eye anatomy on an abstract blue scientific background, detailed info poster digital futuristic illustration. Normal cross vectors Eye with Diabetic retinopathy
Free with trial Stomach erosion and peptic ulcer stages infographic: stomach lining and mucosa cross section diagram, medical illustration. Normal cross vectors Stomach erosion and peptic ulcer
Free with trial Illustration depicting cervical dysplasia stages: Normal, CIN 1 (Mild Dysplasia), CIN 2 (Moderate Dysplasia), and CIN 3 (Severe Dysplasia Carcinoma in Situ). Each panel shows cross-sectional views of cervical cells, with increasing irregularity and abnormality as dysplasia progresses. The images highlight changes in cellular appearance and organization, illustrating progressive pathology with alterations in cell size, shape, and arrangement. Normal cross illustrations Illustration depicting cervical dysplasia stages: Normal
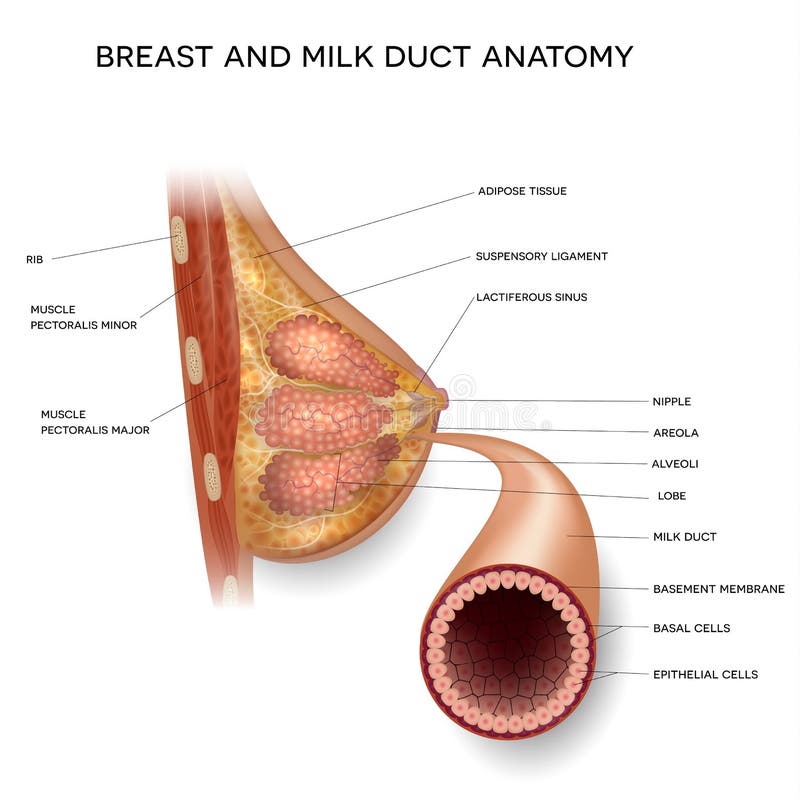
Free with trial Female Breast and normal milk duct anatomy detailed colorful illustration. Normal cross vectors Female Breast and normal milk duct
Free with trial Glossy red heart with normal EKG sinus rhythm and drop of blood, white croos. Normal cross vectors Heart-rhythm-blood-cross-illustration. Glossy red heart with normal EKG sinus rhythm and drop of blood, white croos.
Free with trial Keratoconus. Normal cornea and cone shaped cornea. Anatomy of the human eye. Vertical section of the eye and eyelids. Schematic diagram. detailed illustration. for biological, science, and medical use. Normal cross vectors Keratoconus. Normal cornea and cone shaped cornea
Free with trial Diagram comparing normal and asthmatic airways. On the left, the healthy airway shows clear, open passages in the lungs and bronchial tubes, indicative of smooth airflow. On the right, the asthmatic airway image displays inflamed and constricted bronchial tubes, with thicker walls and excess mucus, representing restricted airflow. Labels highlight these differences, with anatomical cross-sections illustrating the structural changes. Normal cross illustrations Diagram comparing normal and asthmatic airways. On the left, the healthy airway
Free with trial Human Eye Anatomy and Normal Lens Vector Illustration. Normal cross vectors Human Eye Anatomy and Normal Lens
Free with trial Human Eye Anatomy and Normal Lens Vector Illustration. Normal cross vectors Human Eye Anatomy and Normal Lens
Free with trial Urinary bladder with urine isometric 3d icon. Cross section of urinary bladder. Normal cross vectors Urinary bladder with urine icon. Urinary bladder with urine isometric 3d icon. Cross section of urinary bladder
Free with trial Comparison of normal and bronchiectatic airways is shown. On the left, a healthy airway with clear passage and smooth walls. On the right, an airway affected by bronchiectasis, displaying thickened walls and excess mucus buildup, indicating obstruction. Both sections depict cross-sectional views with detailed anatomy, including cartilage and mucosal layers. The illustration highlights structural differences, emphasizing the pathological changes in bronchiectasis, such as dilation and mucus accumulation, typical signs of chronic airway disease. Normal cross illustrations Comparison of normal and bronchiectatic airways is shown. On the left, a healthy
Free with trial A set of pictogram about man basic posture. Normal cross vectors Man Basic Posture People Icon Sign Symbol Pictogra. A set of pictogram about man basic posture.
Free with trial Anatomy of the nose and throat. Median section of human head. Normal cross vectors Nose anatomy. Anatomy of the nose and throat. Median section of human head
Free with trial Human eye anatomy, detailed illustration. on a white bacground. Normal cross vectors Human eye anatomy
Free with trial Illustration comparing normal and asthmatic airways. The left side shows open, clear airways with smooth muscle and wide passages, indicating normal lung function. The right side displays constricted, inflamed airways with thick mucus and swollen muscle tissue, typical of asthma. Lungs are depicted with different textures and structures to illustrate the differences in airway conditions. The trachea, bronchi, and surrounding tissues are shown in cross-section. Text labels are present but contain gibberish, indicating the diagram's focus on visual comparison rather than detailed text explanation. Normal cross illustrations Llustration comparing normal and asthmatic airways. The left side shows open, clea
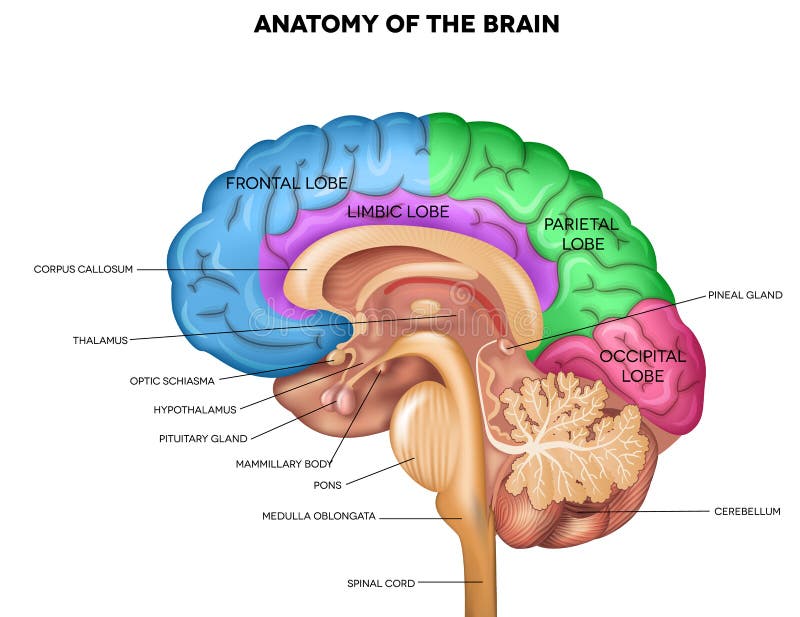
Free with trial Human brain lobes, beautiful colorful illustration detailed anatomy. Sagittal view of the brain. Isolated on a white background. Normal cross vectors Human brain anatomy. Human brain lobes, beautiful colorful illustration detailed anatomy. Sagittal view of the brain. Isolated on a white background.
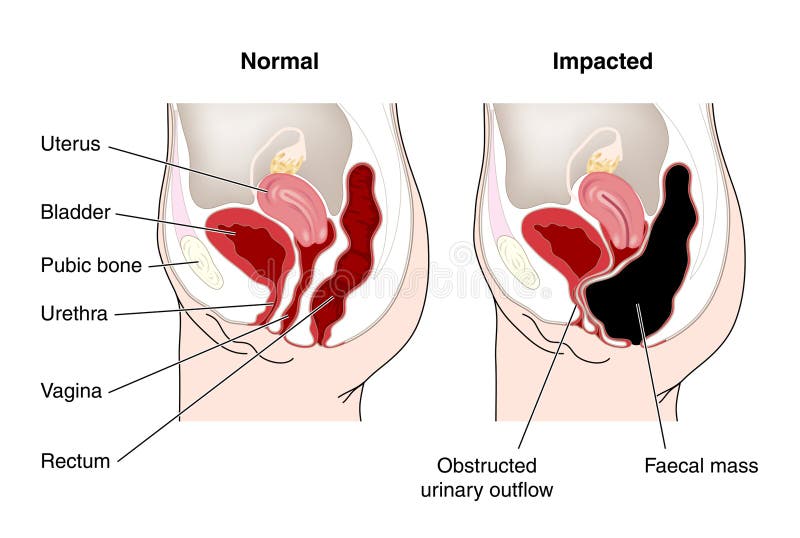
Free with trial Cross section of the abdomen showing normal and constipated bowel. Normal cross vectors Diagram of constipated bowel. Cross section of the abdomen showing normal and constipated bowel
Free with trial Glaucoma. Detailed anatomy of Glaucoma and healthy eye. Normal cross vectors Glaucoma
Free with trial Illustration shows a schematic of blood quality control. A circular diagram displays red and white cells, labeled as normal and abnormal. Abnormal cells are highlighted with a cross mark, while normal ones have a check mark. Graphs at the corners provide additional data analysis. Blue background emphasizes the medical theme, with text annotations for clarity. Normal cross illustrations Illustration shows a schematic of blood quality control. A circular diagram displays
Free with trial Cataracts. Human vision disorder, detailed anatomy of cataracts and healthy eye. Normal cross vectors Cataracts
Free with trial Illustration of the human eye anatomy on the white background. Normal cross vectors Human eye anatomy
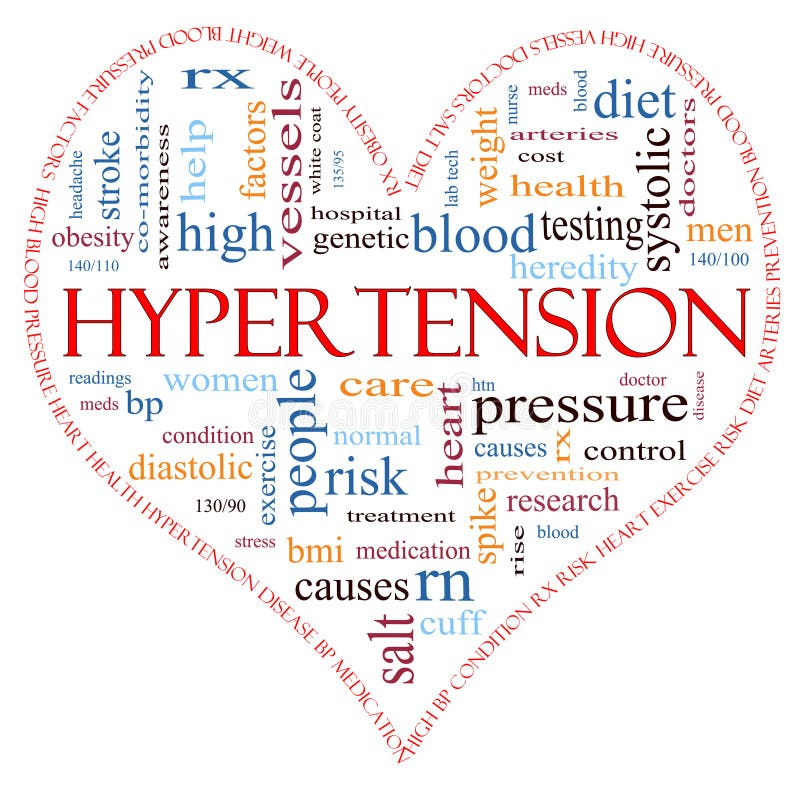
Free with trial A heart shaped word cloud concept around the word Hypertension including words such as reading, control, doctor, rx and more. Normal cross illustrations Hypertension heart shaped word cloud concept. A heart shaped word cloud concept around the word Hypertension including words such as reading, control, doctor, rx and more.
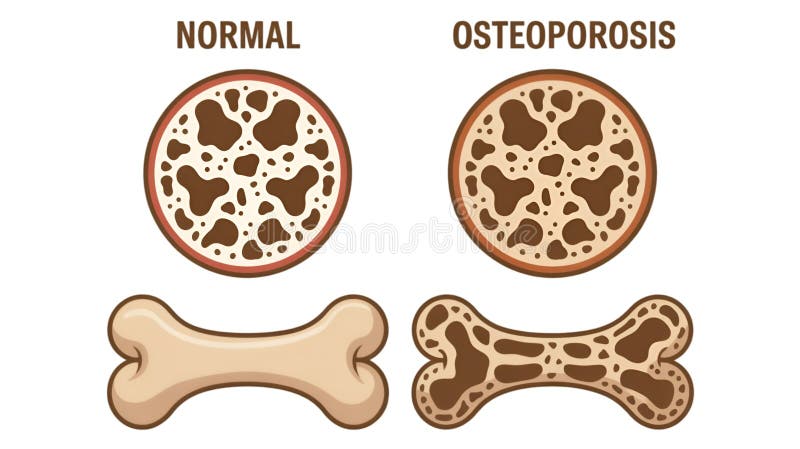
Free with trial This illustration visually compares a normal bone with a bone affected by osteoporosis. The top section shows cross-sections of both bones, highlighting the denser, more interconnected structure of the normal bone versus the thinner, more porous structure of the osteoporotic bone. Below, a whole bone representation further emphasizes the difference, with the osteoporotic bone appearing. Normal cross illustrations Normal vs. Osteoporosis Bone Comparison. This illustration visually compares a normal bone with a bone affected by osteoporosis. The top section shows cross-sections of both bones, highlighting the denser, more interconnected structure of the normal bone versus the thinner, more porous structure of the osteoporotic bone. Below, a whole bone representation further emphasizes the difference, with the osteoporotic bone appearing
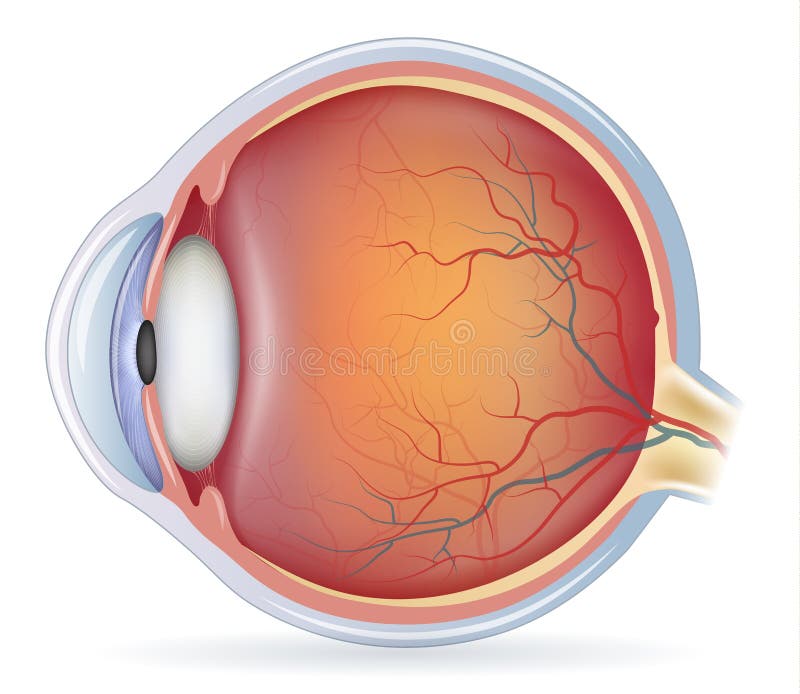
Free with trial Human eye anatomy, retina, optic disc artery and vein etc. detailed illustration. Normal cross vectors Human eye anatomy, retina detailed illustration. Human eye anatomy, retina, optic disc artery and vein etc. detailed illustration.
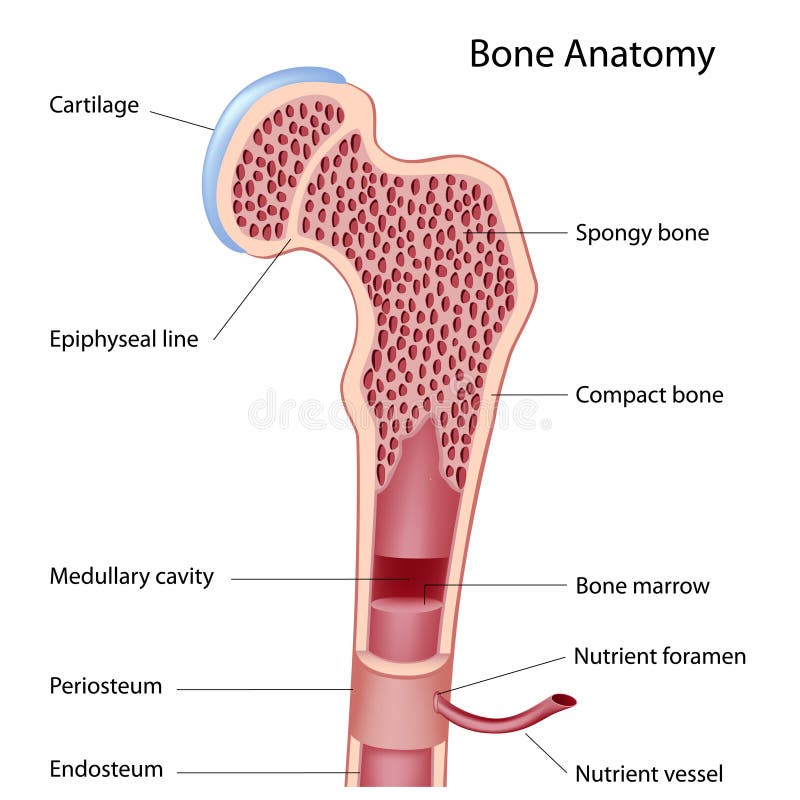
Free with trial Anatomy of a long bone, eps8, gradient and mesh printing compatible. Normal cross vectors Bone structure. Anatomy of a long bone, eps8, gradient and mesh printing compatible
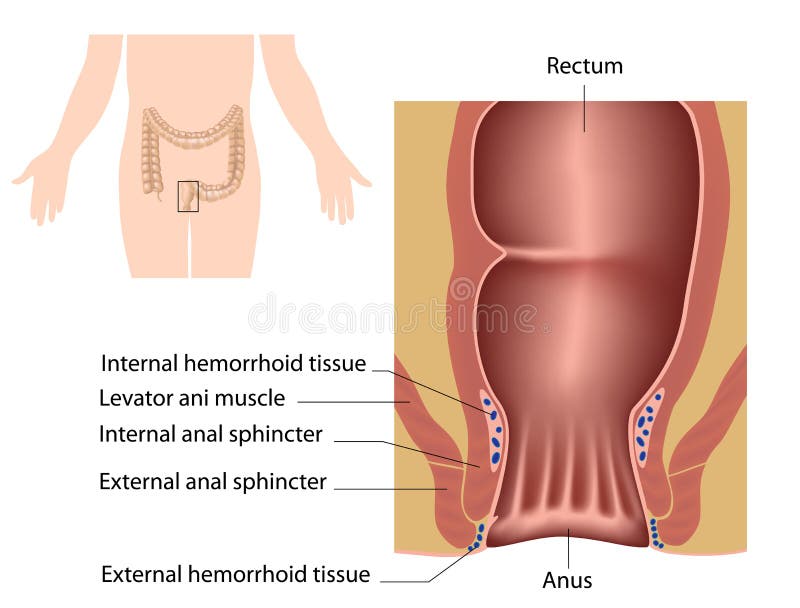
Free with trial Anatomy of human anal canal. Normal cross vectors The anal canal. Anatomy of human anal canal
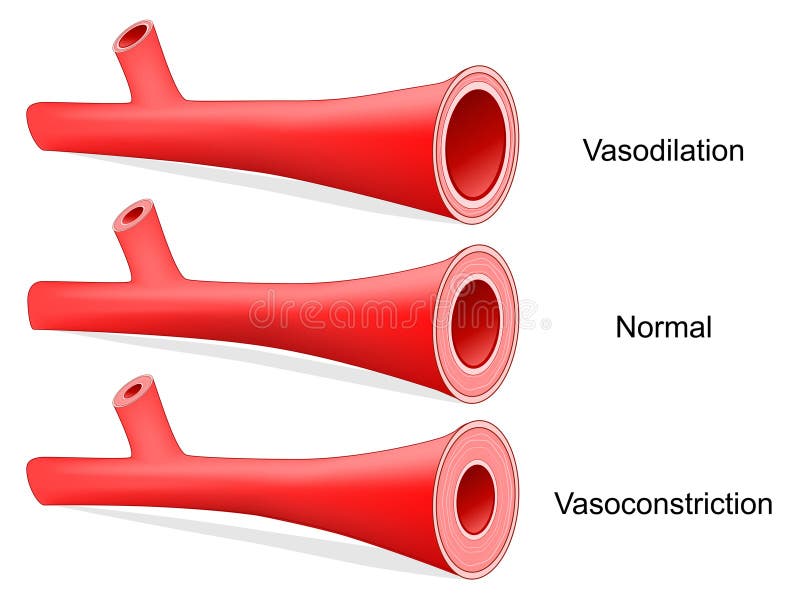
Free with trial Vasoconstriction, Vasodilation, and normal artery. Comparison of normal, constricted, and dilated blood vessels. Vector illustration. Normal cross vectors Vasoconstriction, Vasodilation, and normal artery. Comparison of normal, constricted, and dilated blood vessels
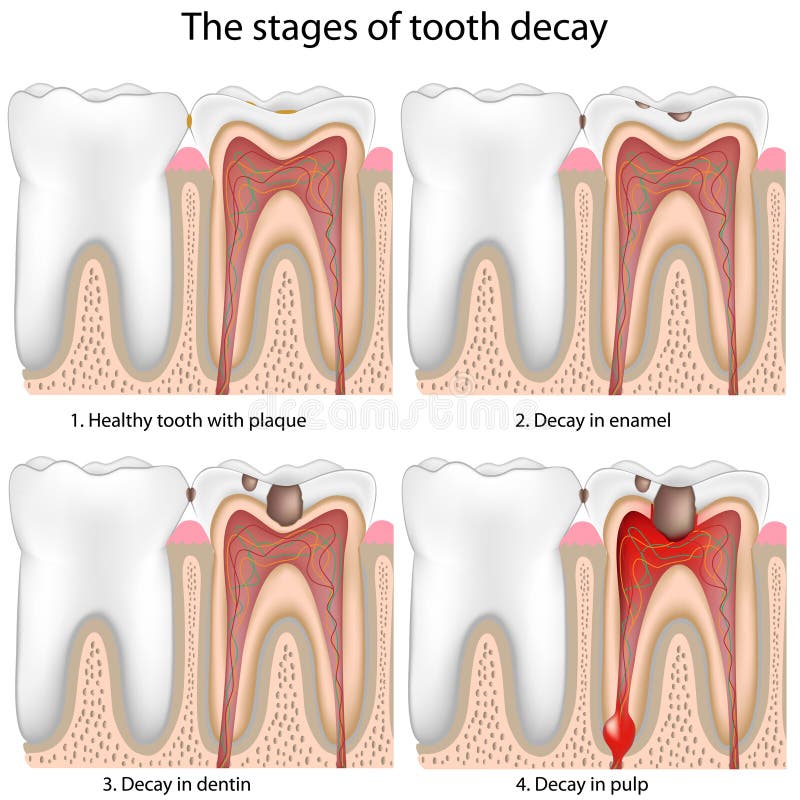
Free with trial Stages of Tooth decay, eps8, gradient and mesh printing compatible. Normal cross vectors Tooth decay, eps8