Free with trial Glossy red heart icon with normal EKG sinus rhythm, great for web, print or presentation. Normal curve icon vectors Heart Icon
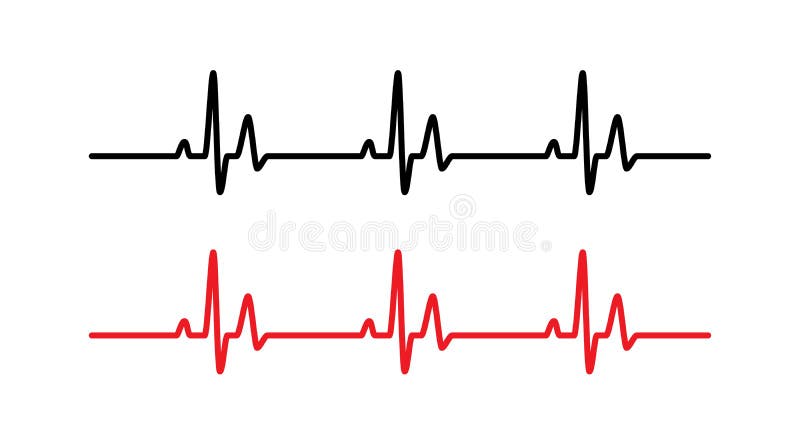
Free with trial Electrocardiogram show normal heart beat line Sinus rhythm. ECG. EKG. Vital sign. Medical healthcare symbol. Normal curve icon vectors Electrocardiogram show normal heart beat line Sinus rhythm.
Free with trial Flat Icons, Illustration Set of 16 Gaussian, Bell or Normal Distribution Curve Icon Labels. Normal curve icon vectors Collection of 16 Normal Distribution Curve Icons. Flat Icons, Illustration Set of 16 Gaussian, Bell or Normal Distribution Curve Icon Labels.
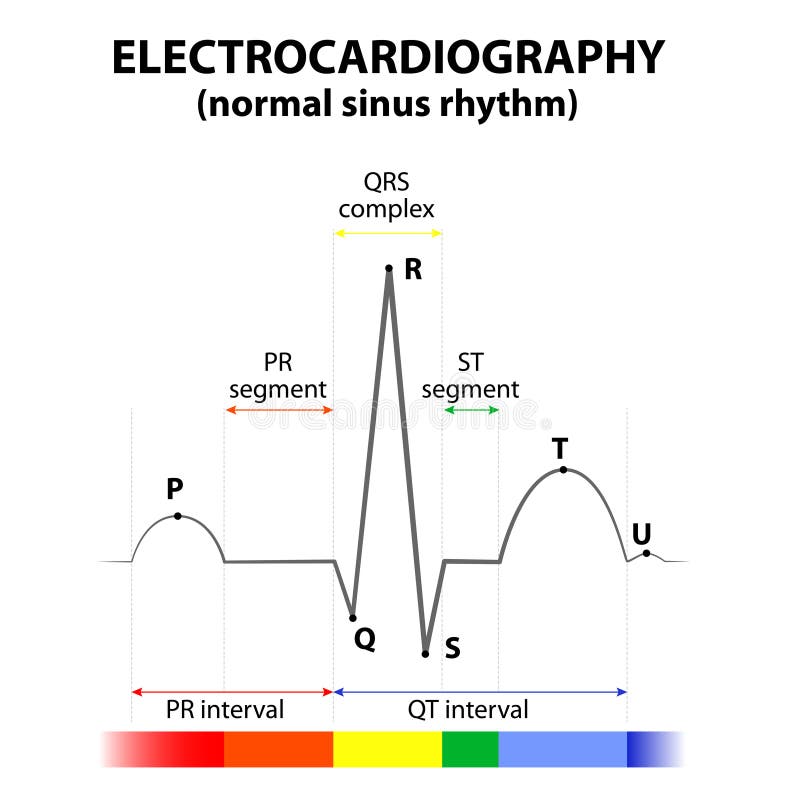
Free with trial ECG of a heart in normal sinus rhythm. Schematic representation. wave and segment names. Normal curve icon vectors ECG of a heart in normal sinus rhythm
Free with trial Probability icon. Element of risk management collection for mobile concept and web apps icon. Outline, thin line probability icon for website design and mobile, app development. Normal curve icon vectors Probability icon vector from risk management collection. Thin line probability outline icon vector illustration. Outline, thin. probability icon. Element of risk management collection for mobile concept and web apps icon. Outline, thin line probability icon for website design and mobile, app development
Free with trial Normal sinus rhythm. Pulse line symbol. Red heart on white background. Vector illustration, flat design, clip art. Normal curve icon vectors Heart rate sign. Electrocardiogram with heart shape. Heartbeat EKG or ECG line icon. Normal sinus rhythm. Pulse line symbol. Red heart on white background. Vector illustration, flat design, clip art.
Free with trial Vector gauss histogram function graph, parabola line icon. Symbol and sign illustration design. Isolated on white background. Normal curve icon vectors Gauss histogram function graph, parabola line icon.
Free with trial Healthcare vector medical background with heart cardiogram. Cardiology concept with pulse rate diagram. Normal curve icon vectors Healthcare vector medical background with heart cardiogram
Free with trial Cartoon Correct or Incorrect Sleeping Body Posture Set Healthcare Concept Flat Design Style. Vector illustration of Health Care. Normal curve icon vectors Cartoon Correct Sleeping Body Posture Set. Vector. Cartoon Correct or Incorrect Sleeping Body Posture Set Healthcare Concept Flat Design Style. Vector illustration of Health Care
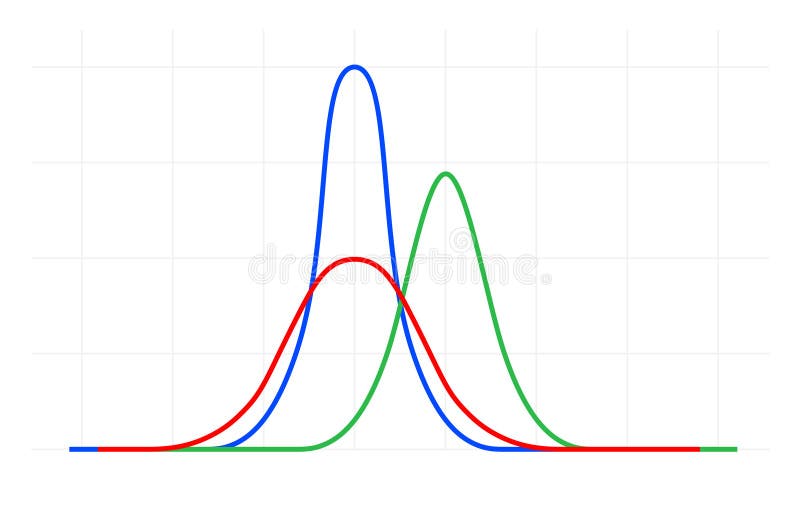
Free with trial Flat Icons, Illustration Set of 4 Gaussian, Bell or Normal Distribution Curve Labels. Normal curve icon vectors Collection of 4 Normal Distribution Curve or Bell Curve. Flat Icons, Illustration Set of 4 Gaussian, Bell or Normal Distribution Curve Labels.
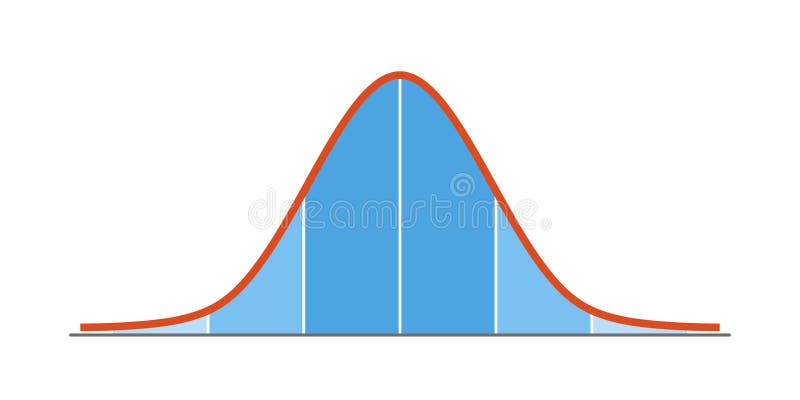
Free with trial Gauss distribution. Standard normal distribution. Gaussian bell graph curve. Business and marketing concept. Math probability theory. Editable stroke. Vector illustration isolated on white background. Normal curve icon vectors Gauss distribution. Standard normal distribution. Gaussian bell graph curve. Business and marketing concept. Math
Free with trial Gauss distribution. Standard normal distribution. Gaussian bell graph curve. Business and marketing concept. Math probability theory. Editable stroke. Vector illustration isolated on white background. Normal curve icon vectors Gauss distribution. Standard normal distribution. Gaussian bell graph curve. Business and marketing concept. Math
Free with trial Gauss distribution. Standard normal distribution. Gaussian bell graph curve. Business and marketing concept. Math probability theory. Editable stroke. Vector illustration isolated on white background. Normal curve icon vectors Gauss distribution. Standard normal distribution. Gaussian bell graph curve. Business and marketing concept. Math
Free with trial Normal Gauss distribution. Standard normal distribution. Gaussian bell graph curve. Vector illustration isolated on white background. Normal curve icon vectors Normal Gauss distribution. Standard normal distribution. Gaussian bell graph curve. Vector illustration
Free with trial Set of curve cartoon icon design template with various models. modern vector illustration isolated on blue background. Normal curve icon vectors Set of curve cartoon icon design template with various models. vector illustration isolated on blue background
Free with trial Heart beat icon. Pulse heartbeat. Red rate line ecg isolated on white background. Medical ekg. Cardiovascular hearth. Healthy life. Monitor electrocardiogram. Cardio rhythm. Vector illustration. Normal curve icon vectors Heart beat icon. Pulse heartbeat. Red rate line ecg isolated on white background. Medical ekg. Cardiovascular hearth. Healthy life
Free with trial Cardiogram doodle icon, vector color illustration. Normal curve icon illustrations Cardiogram doodle icon, vector illustration
Free with trial Heart rate sign. Electrocardiogram with heart shape. Pulse line symbol. Vector illustration, clip art. Normal curve icon vectors Heart with pulse outline on white background. Heartbeat EKG or ECG line icon. Normal sinus rhythm. Heart rate sign. Electrocardiogram with heart shape. Pulse line symbol. Vector illustration, clip art
Free with trial Heart rate graph. Heart beat. Ekg icon wave. Turquoise color. Stock vector illustration. Normal curve icon vectors Heart rate graph. Heart beat. Ekg icon wave. Turquoise color.
Free with trial Gaussian function icon in trendy design style. gaussian function icon isolated on white background. gaussian function vector icon simple and modern flat symbol for web site, mobile, logo, app, UI. Normal curve icon vectors Gaussian function icon in trendy design style. gaussian function icon isolated on white background. gaussian function vector icon
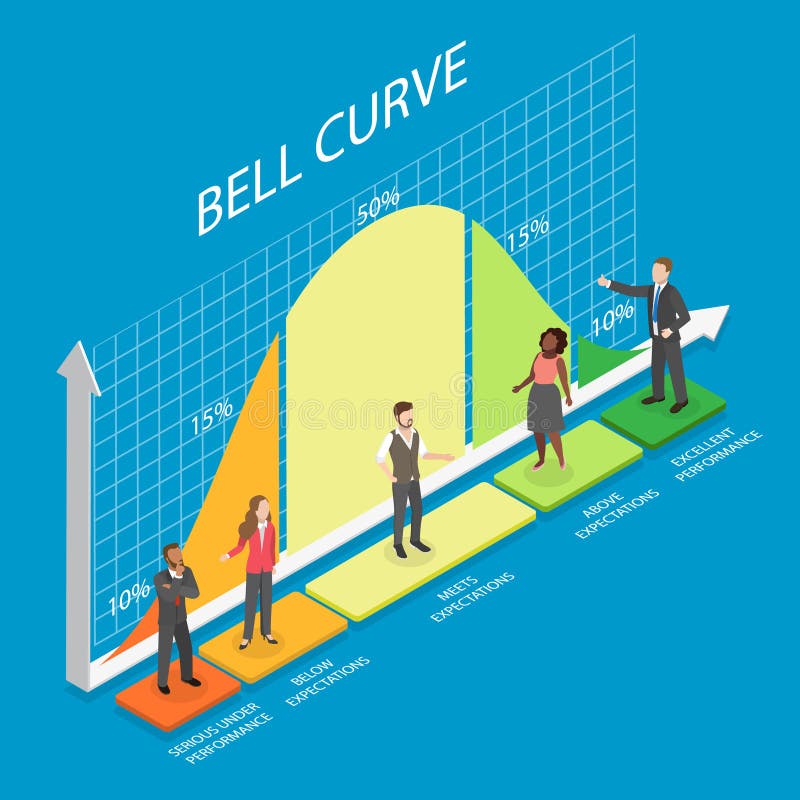
Free with trial 3D Isometric Flat Vector Illustration of Standard Deviation, Diagram Showing Distribution Of Normal Performance In Bell Curve Graph. Normal curve icon vectors 3D Isometric Flat Vector Illustration of Standard Deviation
Free with trial Yield icon. Simple element illustration from marketing concept. yield editable symbol design on white background. Can be use for web and mobile. Normal curve icon vectors Yield icon on white background. Simple element illustration from marketing concept. yield icon. Simple element illustration from marketing concept. yield editable symbol design on white background. Can be use for web and mobile
Free with trial Parabolic icon in different style vector illustration. two colored and black parabolic vector icons designed in filled, outline, line and stroke style can be used for web, mobile, ui. Normal curve icon vectors Parabolic icon in different style vector illustration. two colored and black parabolic vector icons designed in filled, outline
Free with trial WebEcg heart beat line. Vector illustration icon. Normal curve icon vectors WebEcg heart beat line. Vector illustration icon.
Free with trial WebEcg heart beat line. Vector illustration icon. Normal curve icon vectors WebEcg heart beat line. Vector illustration icon.
Free with trial Vector illustration of curved arrow icons. 25 curved arrow icons set. curve icons. Normal curve icon illustrations Vector illustration of curved arrow icons. 25 curved arrow icons set. curve icons
Free with trial Glossy red heart with normal EKG sinus rhythm and shadow on light background. Normal curve icon vectors Heart-red-normal-rhytm. Glossy red heart with normal EKG sinus rhythm and shadow on light background.
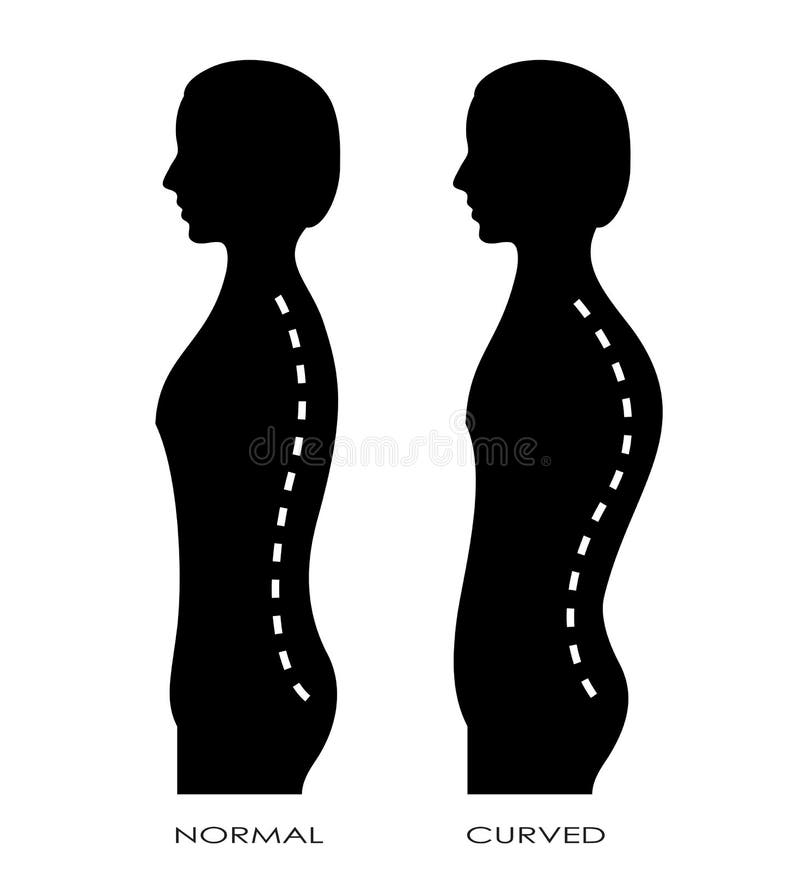
Free with trial Spinal curvature, normal and curved backbone. Normal curve icon vectors Spinal curvature
Free with trial Osteoporosis Bone Types Infographics Concept Card Poster Include of Scoliosis, Kyphosis, Lordosis and Normal. Vector illustration of Backbone. Normal curve icon vectors Osteoporosis Bone Types Infographics Concept Card Poster. Vector. Osteoporosis Bone Types Infographics Concept Card Poster Include of Scoliosis, Kyphosis, Lordosis and Normal. Vector illustration of Backbone
Free with trial Vector black normal heart rhythm set, Electrocardiogram, ECG - EKG signal, HeartBeat pulse line concept design isolated on white background. Tattoo,wall art ,print. Cardiogram line illustration. Normal curve icon vectors Healthy heart beats pharmacy medicine single continuous line art. Heartbeat pulse silhouette healthcare doctor online. Vector black normal heart rhythm set, Electrocardiogram, ECG - EKG signal, HeartBeat pulse line concept design isolated on white background.Tattoo,wall art ,print.Cardiogram line illustration.
Free with trial Glossy red heart with normal EKG sinus rhythm and drop of blood, white croos. Normal curve icon vectors Heart-rhythm-blood-cross-illustration. Glossy red heart with normal EKG sinus rhythm and drop of blood, white croos.
Free with trial ECG heartbeat monitor, cardiogram heart pulse line wave. Electrocardiogram medical background. Normal curve icon vectors ECG heartbeat monitor, cardiogram heart pulse line wave. Electrocardiogram medical background
Free with trial Heartbeat ecg electrocardiogram vector graph wave line. Ekg cardio heart beat cardiology frequency monitor. Normal curve icon vectors Heartbeat ecg electrocardiogram vector graph wave line. Ekg cardio heart beat cardiology frequency monitor
Free with trial ECG heartbeat monitor, cardiogram heart pulse line wave. Electrocardiogram medical background. Normal curve icon vectors ECG heartbeat monitor, cardiogram heart pulse line wave. Electrocardiogram medical background
Free with trial ECG heartbeat monitor, cardiogram heart pulse line wave. Electrocardiogram medical background. Normal curve icon vectors ECG heartbeat monitor, cardiogram heart pulse line wave. Electrocardiogram medical background
Free with trial ECG heartbeat monitor, cardiogram heart pulse line wave. Electrocardiogram medical background. Normal curve icon vectors ECG heartbeat monitor, cardiogram heart pulse line wave. Electrocardiogram medical background
Free with trial ECG heartbeat monitor, cardiogram heart pulse line wave. Electrocardiogram medical background. Normal curve icon vectors ECG heartbeat monitor, cardiogram heart pulse line wave. Electrocardiogram medical background
Free with trial Heart beat one line. Continuous lines heart beats drawing. Wave pulse. Art heartbeat waves. Hand draw cardiogram. Outline human. Black ekg stroke isolated on white background. Vector illustration. Normal curve icon vectors Heart beat one line. Continuous lines heart beats drawing. Wave pulse. Art heartbeat waves. Hand draw cardiogram. Outline human
Free with trial Heartbeat ecg electrocardiogram vector graph wave line. Ekg cardio heart beat cardiology frequency monitor. Normal curve icon vectors Heartbeat ecg electrocardiogram vector graph wave line. Ekg cardio heart beat cardiology frequency monitor
Free with trial Heartbeat ecg electrocardiogram vector graph wave line. Ekg cardio heart beat cardiology frequency monitor. Normal curve icon vectors Heartbeat ecg electrocardiogram vector graph wave line. Ekg cardio heart beat cardiology frequency monitor
Free with trial 3D Isometric Flat Vector Conceptual Illustration of EKG - Electrocardiogram, Cardiological Illnesses Prevention. Normal curve icon vectors 3D Isometric Flat Vector Conceptual Illustration of EKG - Electrocardiogram
Free with trial Set of lines, colored, black and white hand drawn dividers, doodle underlines, different thickness brush stripes. Frame and border element. Vector illustration. Isolated on white background. Normal curve icon vectors Set of lines, colored, black and white hand drawn dividers, doodle underlines, different thickness brush stripes. Frame and border
Free with trial Dotted vector infographic business icons. This bicolor vector icon set uses modern corporate light blue and dark grey color scheme. Normal curve icon vectors Dotted vector infographic business icons
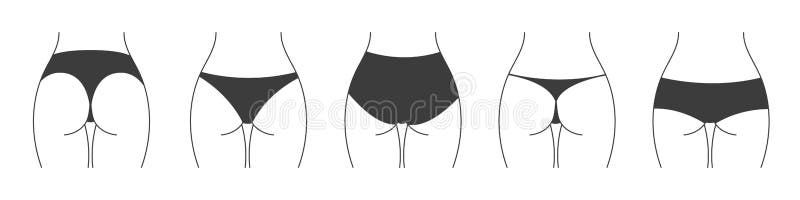
Free with trial Different types of panties. Collection of lingerie back view. Vector silhouettes of female underwear. Normal curve icon vectors Different types of panties. Collection of lingerie back view. Vector silhouettes of female underwear
Free with trial Healthy lifestyle. ECG heart healthy. Normal curve icon illustrations ECG heart healthy. Healthy lifestyle. Healthy lifestyle. ECG heart healthy
Free with trial Normal spine, kyphosis and lordosis comparison. Scoliosis concept. Human spine anatomy and posture conditions. Spinal deformities and curvature types flat vector illustration, vertebra medical diagram. Normal curve icon vectors Scoliosis medical poster. Normal spine, kyphosis and lordosis comparison. Scoliosis concept. Human spine anatomy and posture conditions. Spinal deformities and curvature types flat vector illustration, vertebra medical diagram
Free with trial Electrocardiogram. ECG concept. Heartbeat and pulse. Medicine and health. Eps 10 vector illustration. Normal curve icon illustrations Electrocardiogram. ECG concept. Heartbeat and pulse. Medicine and health. Eps 10 vector illustration
Free with trial Set Arrows and directions signs refresh or update. different thicknesses from thin to thick. Black Vector arrows isolated on white background. Normal curve icon vectors Set Arrows and directions signs refresh or update.
Free with trial Safety at work. Coronavirus protection. Characters on white background. Vector illustration, flat, clip art. Normal curve icon vectors Social distancing at work place. Businessman and businesswoman wear protective masks. Safety at work. Coronavirus protection. Characters on white background. Vector illustration, flat, clip art.
Free with trial Gauss curve, normal probability distribution, graph - vector icon. Vector illustration. Normal curve icon vectors Gauss curve, normal probability distribution
Free with trial Gauss curve, normal probability distribution, graph - vector icon. Vector illustration. Normal curve icon vectors Gauss curve, normal probability distribution
Free with trial Gauss curve, normal probability distribution, graph - vector icon. Vector illustration. Normal curve icon vectors Gauss curve, normal probability distribution
Free with trial Gauss curve, normal probability distribution, graph - vector icon. Vector illustration. Normal curve icon vectors Gauss curve, normal probability distribution
Free with trial Bell Curve Graph Modern Outline Style Icon Design. Normal curve icon vectors Bell Curve Graph Vector Icon. Bell Curve Graph Modern Outline Style Icon Design
Free with trial Chart icon with bell curve distribution and histogram style axes, minimal black silhouette infographic symbol for statistics, analytics, data science and reports. Normal curve icon vectors Chart icon with bell curve distribution and histogram style axes, minimal black silhouette infographic
Free with trial Simple bell curve graph showing a normal distribution, ideal for concepts related to statistics, data analysis, and probability. Normal curve icon vectors Bell curve graph showing normal distribution for statistical analysis. Simple bell curve graph showing a normal distribution, ideal for concepts related to statistics, data analysis, and probability
Free with trial Bell Curve on Graph icon vector image. Suitable for mobile apps, web apps and print media. Normal curve icon vectors Bell Curve on Graph icon vector image.
Free with trial Bell Curve on Graph Modern Outline Style Icon Design. Normal curve icon vectors Bell Curve on Graph Vector Icon. Bell Curve on Graph Modern Outline Style Icon Design
Free with trial A minimalist black and white illustration depicts a bell curve, a fundamental representation of a normal distribution. Thin vertical lines fill the curve, creating a patterned effect. Scattered small squares are placed along the curve, symbolizing data points or observations. This graphic is ideal for illustrating statistical concepts, data analysis, probability, and scientific research. Normal curve icon illustrations Bell Curve with Data Points. A minimalist black and white illustration depicts a bell curve, a fundamental representation of a normal distribution. Thin vertical lines fill the curve, creating a patterned effect. Scattered small squares are placed along the curve, symbolizing data points or observations. This graphic is ideal for illustrating statistical concepts, data analysis, probability, and scientific research.
Free with trial Bell curve symbol graph distribution deviation standard gaussian chart. Bell histogram wave diagram normal gauss wave. Normal curve icon vectors Bell curve symbol graph distribution deviation standard gaussian chart. Bell histogram wave diagram normal gauss wave.
Free with trial Heart beat icon. Pulse heartbeat. Rate line ecg isolated on white background. Medical ekg. Cardiovascular hearth. Healthy life. Monitor electrocardiogram. Cardio rhythm. Medicine. Vector illustration. Normal curve icon vectors Heart beat icon. Pulse heartbeat. Rate line ecg isolated on white background. Medical ekg. Cardiovascular hearth. Healthy life
Free with trial Bell Shaped Graph Modern Outline Style Icon Design. Normal curve icon vectors Bell Shaped Graph Vector Icon. Bell Shaped Graph Modern Outline Style Icon Design
Free with trial Graph with percentages, three human figures under normal distribution curve, alongside sad face. Ideal for statistics, emotion, analysis, social study, mental health, user feedback simple flat. Normal curve icon vectors Emotional response to statistical data analysis in demographic study. Graph with percentages, three human figures under normal distribution curve, alongside sad face. Ideal for statistics, emotion, analysis, social study, mental health, user feedback simple flat
Free with trial Galton box mechanism demonstrating the principles of probability, statistics, and normal distribution with falling balls creating a bell curve, useful for education and data science concepts. Normal curve icon vectors Galton box displaying probability and random distribution. Galton box mechanism demonstrating the principles of probability, statistics, and normal distribution with falling balls creating a bell curve, useful for education and data science concepts
Free with trial Statistical bell curve with symmetrical halves 2D line object. Normal distribution. Data analysis. Probability modeling isolated clipart vector ink outline item. Monochrome spot illustration. Normal curve icon vectors Statistical bell curve with symmetrical halves 2D line object
Free with trial Statistical bell curve with symmetrical halves 2D cartoon object. Normal distribution. Data analysis. Probability modeling isolated element flat vector clip art on white. Spot illustration. Normal curve icon vectors Statistical bell curve with symmetrical halves 2D cartoon object
Free with trial A simple illustration of a water slide, perfect for websites, apps, or presentations. The icon uses a minimal gray line art style. Normal curve icon vectors Simple Gray Line Art, Water Slide Icon. A simple illustration of a water slide, perfect for websites, apps, or presentations. The icon uses a minimal gray line art style.
Free with trial Black silhouette of a bell curve histogram on a white background Clear details and vibrant colors enhance visu. Normal curve icon illustrations Black silhouette of a bell curve histogram on white background distribution statistics. Black silhouette of a bell curve histogram on a white background Clear details and vibrant colors enhance visu
Free with trial Heartbeat, heart beat pulse icon sticker isolated on gray background. Simple vector logo. Normal curve icon vectors Heartbeat, heart beat pulse icon sticker isolated on gray background
Free with trial Heart beat icon. Pulse heartbeat. Rate line ecg isolated on white background. Medical ekg. Line art cardiovascular hearth. Healthy life. Monitor electrocardiogram. Cardio rhythm. Vector illustration. Normal curve icon vectors Heart beat icon. Pulse heartbeat. Rate line ecg isolated on white background. Medical ekg. Line art cardiovascular hearth. Healthy
Free with trial Heart beat icon. Pulse heartbeat. Rate line ecg isolated on white background. Medical ekg. Cardiovascular hearth. Healthy life. Monitor electrocardiogram. Cardio rhythm. Medicine. Vector illustration. Normal curve icon vectors Heart beat icon. Pulse heartbeat. Rate line ecg isolated on white background. Medical ekg. Cardiovascular hearth. Healthy life
Free with trial A minimalist vector illustration featuring a horizontal baseline with two distinct curves. A blue curve represents a waveform, fluctuating both above and below the line, suggesting an oscillating signal or dynamic data. Adjacent to it, a green bell-shaped curve rises purely above the baseline, reminiscent of a Gaussian or normal distribution. This abstract graphic effectively visualizes concepts related to data analysis, signal processing, statistics, and comparative trends, ideal for scientific, technological, or educational content. Normal curve icon vectors Signal Waveforms and Gaussian Curves on Baseline. A minimalist vector illustration featuring a horizontal baseline with two distinct curves. A blue curve represents a waveform, fluctuating both above and below the line, suggesting an oscillating signal or dynamic data. Adjacent to it, a green bell-shaped curve rises purely above the baseline, reminiscent of a Gaussian or normal distribution. This abstract graphic effectively visualizes concepts related to data analysis, signal processing, statistics, and comparative trends, ideal for scientific, technological, or educational content.
Free with trial Heart beat icon. Pulse heartbeat. Rate line ecg isolated on white background. Medical ekg. Cardiovascular hearth. Healthy life. Monitor electrocardiogram. Cardio rhythm. Medicine. Vector illustration. Normal curve icon vectors Heart beat icon. Pulse heartbeat. Rate line ecg isolated on white background. Medical ekg. Cardiovascular hearth. Healthy life
Free with trial Heart beat icon. Pulse heartbeat. Rate line ecg isolated on white background. Medical ekg. Cardiovascular hearth. Healthy life. Monitor electrocardiogram. Cardio rhythm. Medicine. Vector illustration. Normal curve icon vectors Heart beat icon. Pulse heartbeat. Rate line ecg isolated on white background. Medical ekg. Cardiovascular hearth. Healthy life
Free with trial Heart beat icon. Pulse heartbeat. Rate line ecg isolated on white background. Medical ekg. Cardiovascular hearth. Healthy life. Monitor electrocardiogram. Cardio rhythm. Medicine. Vector illustration. Normal curve icon vectors Heart beat icon. Pulse heartbeat. Rate line ecg isolated on white background. Medical ekg. Cardiovascular hearth. Healthy life