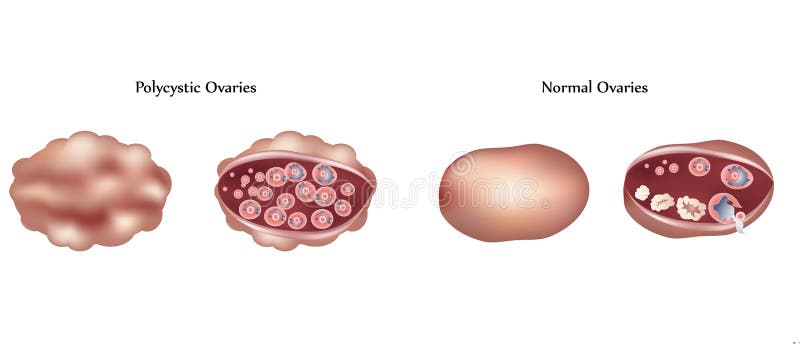
Free with trial Polycystic ovaries and normal ovaries differences. Normal phase vectors Polycystic ovaries
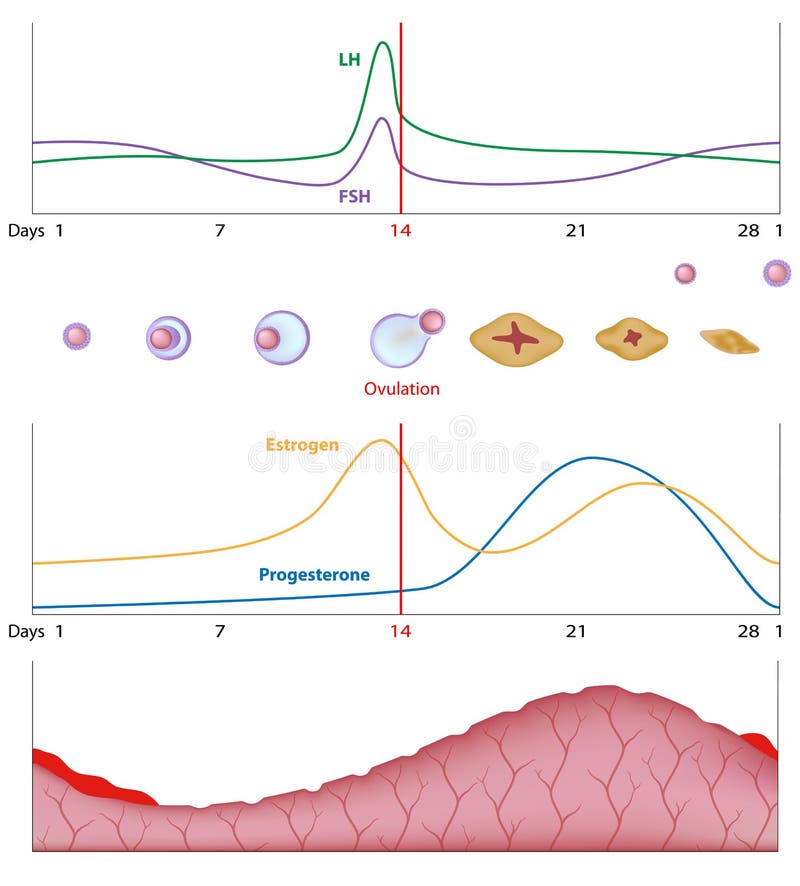
Free with trial Monthly cycle of hormones, ovarian events and endometrium thickness, eps10. Normal phase vectors Female sexual cycle. Monthly cycle of hormones, ovarian events and endometrium thickness, eps10
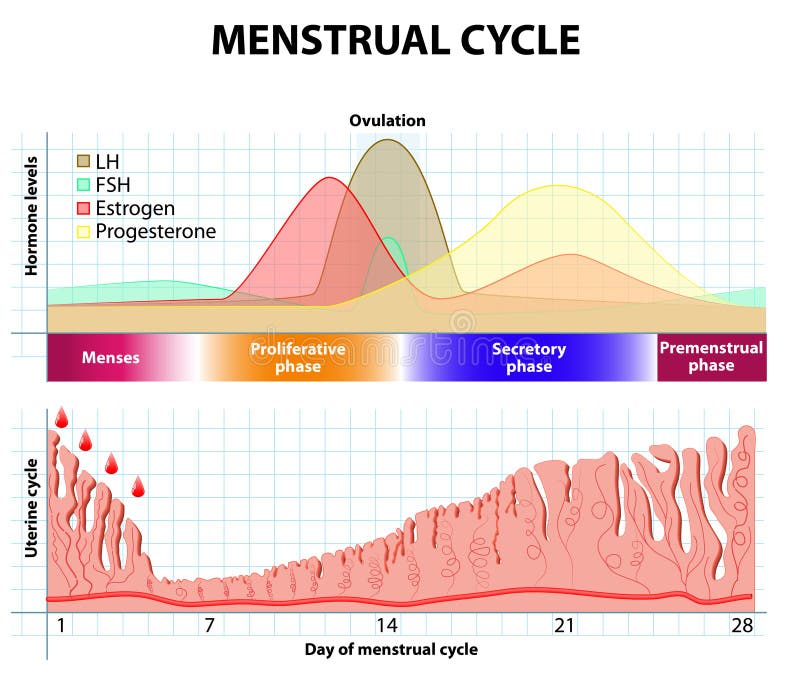
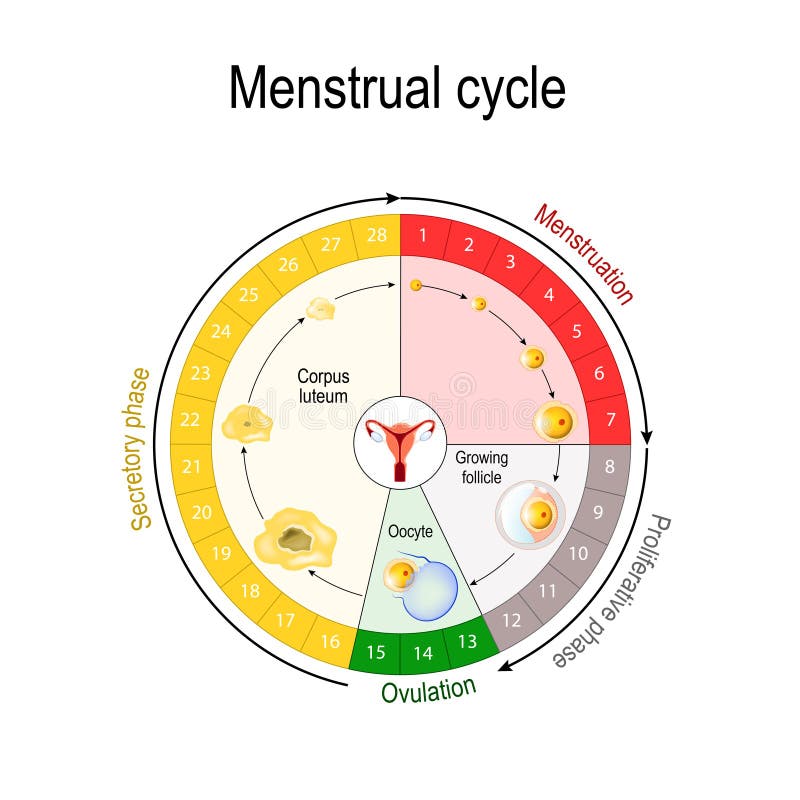
Free with trial Menstrual cycle. Menstruation, Follicle phase, Ovulation and Corpus luteum phase. endometrium and hormone. Normal phase vectors Menstrual cycle. endometrium and hormone. Menstrual cycle. Menstruation, Follicle phase, Ovulation and Corpus luteum phase. endometrium and hormone
Free with trial Normal hair tissue and Alopecia areata hair tissue with lymphocytes attacking cells of hair follicles. Normal phase vectors Normal hair and Alopecia areata. Normal hair tissue and Alopecia areata hair tissue with lymphocytes attacking cells of hair follicles
Free with trial Stages of hair loss on human skin, scheme with anatomy structure including follicles, veins, nerves, vector illustration. Normal phase vectors Hair Loss Scheme. Stages of hair loss on human skin, scheme with anatomy structure including follicles, veins, nerves, vector illustration
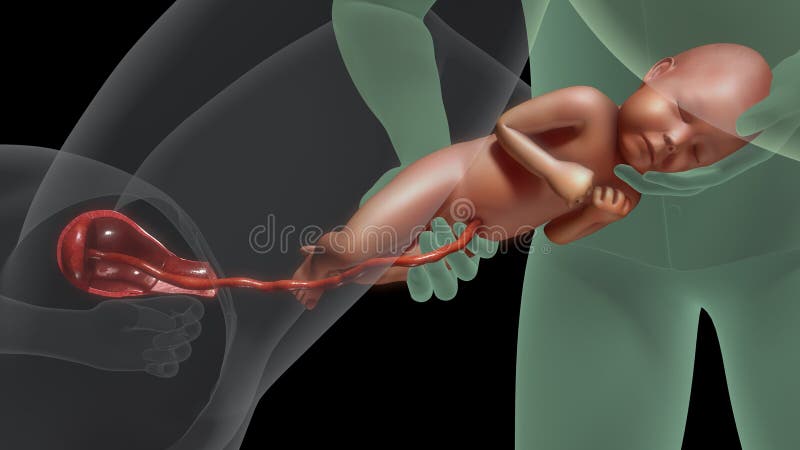
Free with trial Stages of Labor and Birth in a vaginal delivery infographic diagram including engagement descent internal complete rotation extension poster for medical science education and healthcare. Normal phase vectors Stages of Labor and Birth in a vaginal delivery
Free with trial First Stage: Dilation and Effacement of the Cervix a. early phase b. active phase c. transition phase 2. Second Stage: Pushing and Birth 3. Third Stage: Delivery of the Placenta. Normal phase illustrations Normal labor and vaginal birth. First Stage: Dilation and Effacement of the Cervix a. early phase b. active phase c. transition phase 2. Second Stage: Pushing and Birth 3. Third Stage: Delivery of the Placenta
Free with trial First Stage: Dilation and Effacement of the Cervix a. early phase b. active phase c. transition phase 2. Second Stage: Pushing and Birth 3. Third Stage: Delivery of the Placenta. Normal phase illustrations Normal labor and vaginal birth. First Stage: Dilation and Effacement of the Cervix a. early phase b. active phase c. transition phase 2. Second Stage: Pushing and Birth 3. Third Stage: Delivery of the Placenta
Free with trial First Stage: Dilation and Effacement of the Cervix a. early phase b. active phase c. transition phase 2. Second Stage: Pushing and Birth 3. Third Stage: Delivery of the Placenta. Normal phase illustrations Normal labor and vaginal birth. First Stage: Dilation and Effacement of the Cervix a. early phase b. active phase c. transition phase 2. Second Stage: Pushing and Birth 3. Third Stage: Delivery of the Placenta
Free with trial First Stage: Dilation and Effacement of the Cervix a. early phase b. active phase c. transition phase 2. Second Stage: Pushing and Birth 3. Third Stage: Delivery of the Placenta. Normal phase illustrations Normal labor and vaginal birth. First Stage: Dilation and Effacement of the Cervix a. early phase b. active phase c. transition phase 2. Second Stage: Pushing and Birth 3. Third Stage: Delivery of the Placenta
Free with trial First Stage: Dilation and Effacement of the Cervix a. early phase b. active phase c. transition phase 2. Second Stage: Pushing and Birth 3. Third Stage: Delivery of the Placenta. Normal phase illustrations Normal labor and vaginal birth. First Stage: Dilation and Effacement of the Cervix a. early phase b. active phase c. transition phase 2. Second Stage: Pushing and Birth 3. Third Stage: Delivery of the Placenta
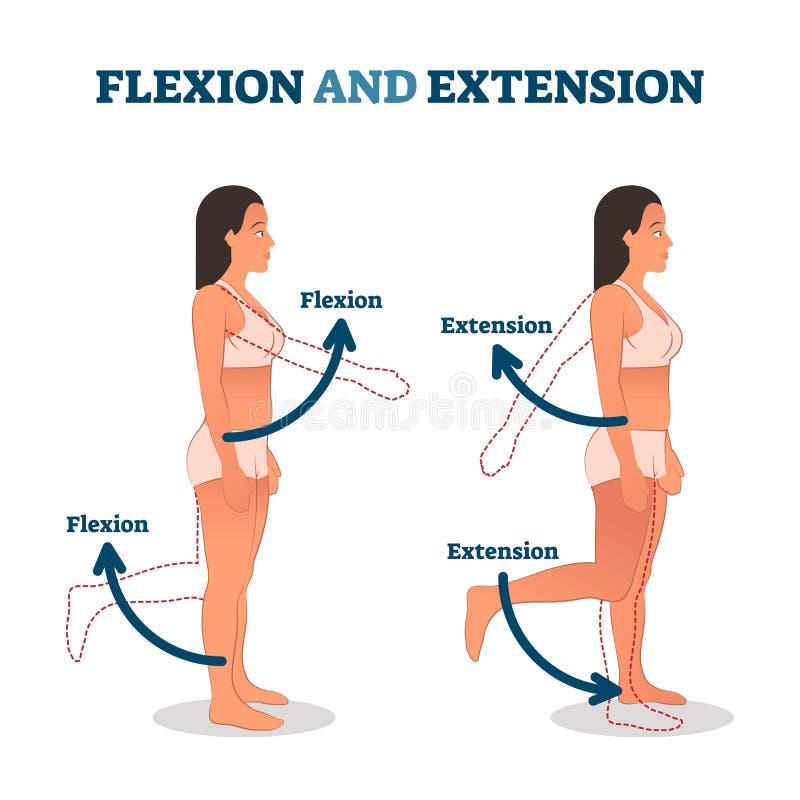
Free with trial Flexion and extension vector illustration. Anatomical movement description. Educational arm or leg exercise to bend or straighten body parts. Normal healthy patient as biological kinesiology example. Normal phase vectors Flexion and extension vector illustration. Anatomical movement description.
Free with trial Hair loss scheme. Loss hair, growth hair problem, health hair. Vector illustration. Normal phase vectors Hair loss scheme
Free with trial Cell cycle vector illustration. Educational microbiological phases scheme. Scientific section division with quiescence, growth, restriction, DNA synthesis, damage or spindle checkpoint diagram parts. Normal phase vectors Cell cycle vector illustration. Educational microbiological phases scheme.
Free with trial Loss hair, growth hair problem, health hair. Hair growth phase. Vector illustration. Normal phase vectors Loss hair, growth hair problem, health hair. Hair growth phase.
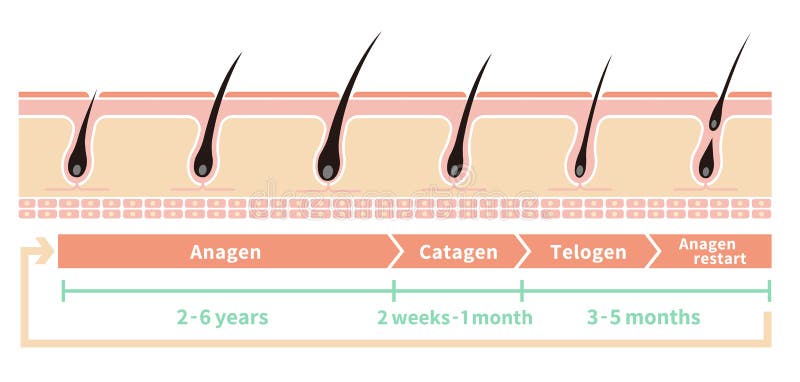
Free with trial Hair growth phases. Normal hair cycle. Vector illustration for your design. Normal phase illustrations Hair growth phases. Normal hair cycle. Vector illustration
Free with trial Medical infographic illustrations of hair growth cycle. Vector pictures of human biology. Hair human banner, anatomy root follicle. Normal phase vectors Medical infographic illustrations of hair growth cycle. Vector pictures of human biology
Free with trial The chemical molecular formula of the hormone progesterone. Female sex hormone. Decrease and increase of progesterone. Infographics Vector illustration. Normal phase vectors The chemical molecular formula of the hormone progesterone. Female sex hormone. Decrease and increase of progesterone.
Free with trial Meiosis and mitosos cell division. Diploid cells. DNA and human reproductive system concept. Medical, biology or anatomical banner or poster for clinic, genetic center. Flat simple vector illustration. Normal phase vectors Mitosis and meiosis. Meiosis and mitosos cell division. Diploid cells. DNA and human reproductive system concept. Medical, biology or anatomical banner or poster for clinic, genetic center. Flat simple vector illustration
Free with trial Illustration of thin layer chromatography TLC comprising normal-phase and reversed-phase TLC plates. The TLC plates are used for investigation or screening detection of sample solution. Normal phase illustrations Normal Phase and Reversed-Phase Thin Layer Chromatography Plates. Illustration of thin layer chromatography TLC comprising normal-phase and reversed-phase TLC plates. The TLC plates are used for investigation or screening detection of sample solution
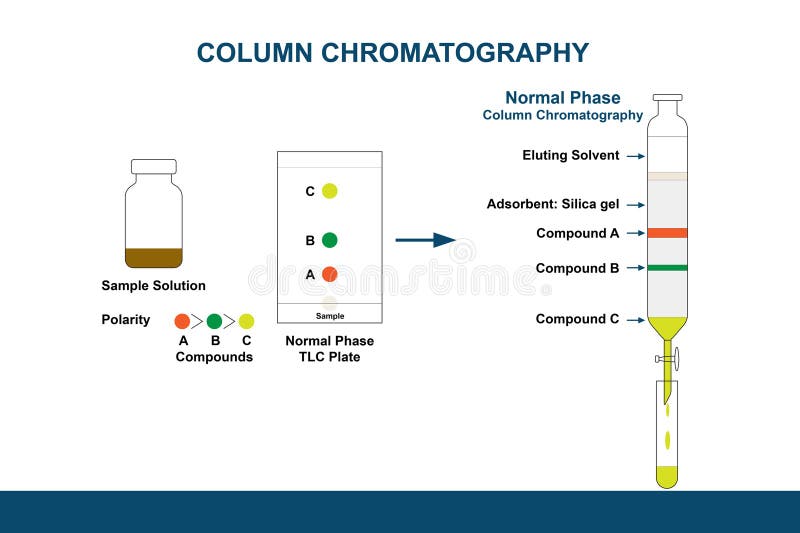
Free with trial Illustration of normal phase thin layer chromatography plate and normal phase Column Chromatography are used to investigate and isolate pure compounds from the mixture sample solution. Normal phase illustrations Normal Phase Thin Layer Chromatography plate and Normal Phase Column Chromatography
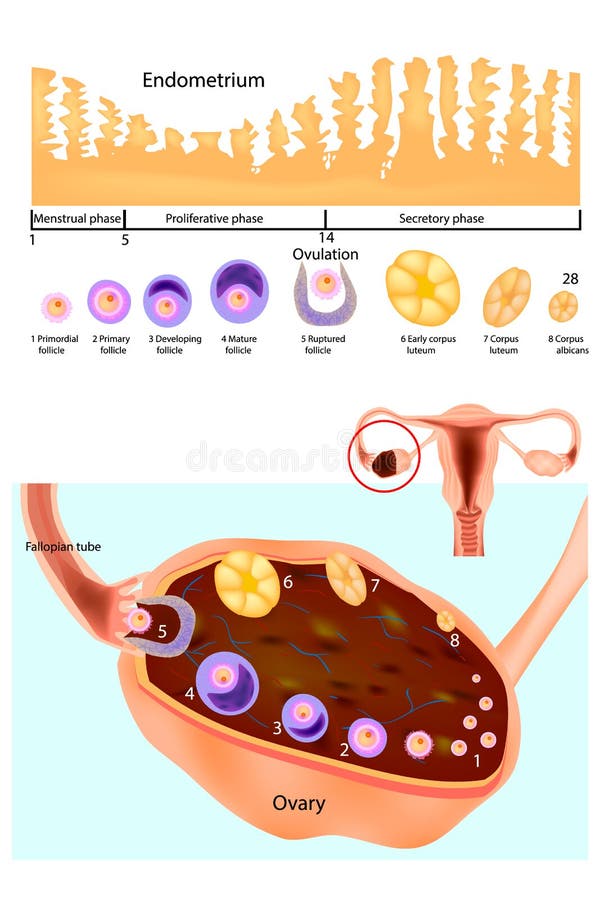
Free with trial Endometrium. Normal ovary, follicular development and ovulation. Scheme of the menstrual cycle. Female reproductive system. Normal phase vectors Endometrium. Normal ovary, follicular development and ovulation.
Free with trial Nondisjunction as abnormal meiosis chromosome number outline diagram. Labeled educational cell division sister chromatids phase failure scheme vector illustration. Comparison to normal gene process. Normal phase vectors Nondisjunction as abnormal meiosis chromosome number failure outline diagram. Nondisjunction as abnormal meiosis chromosome number outline diagram. Labeled educational cell division sister chromatids phase failure scheme vector illustration. Comparison to normal gene process.
Free with trial Normal healthy hair cycle vector illustration / english. Normal phase vectors Normal hair cycle illustration. Normal healthy hair cycle vector illustration / english
Free with trial Normal healthy hair cycle vector illustration / no text. Normal phase vectors Normal hair cycle illustration. Normal healthy hair cycle vector illustration / no text
Free with trial Normal healthy hair cycle vector illustration / Japanese. Normal phase vectors Normal hair cycle illustration. Normal healthy hair cycle vector illustration / Japanese
Free with trial First Stage: Dilation and Effacement of the Cervix a. early phase b. active phase c. transition phase 2. Second Stage: Pushing and Birth 3. Third Stage: Delivery of the Placenta. Normal phase illustrations Normal labor and vaginal birth. First Stage: Dilation and Effacement of the Cervix a. early phase b. active phase c. transition phase 2. Second Stage: Pushing and Birth 3. Third Stage: Delivery of the Placenta
Free with trial Burning match animation, stages of matchstick ignition from whole new to complete combustion and charring vector sprite sheet. Match stick with normal, burning and burnt sulphur cartoon sequence frame. Normal phase vectors Burning match animation, stages of matchstick
Free with trial Menstrual cycle chart. increase and decrease of the hormones. The graph also depicts the growth of the follicle. Fluctuation of hormones that occurs during menstruation cycle. Vector illustration for educational, biological, science and medical use. Normal phase vectors Menstrual cycle chart
Free with trial Vector decorative futuristic font design, alphabet, typeface, shadow, color swatches Vector illustration. Normal phase vectors Vector decorative futuristic font design, alphabet, typeface
Free with trial Concept of COVID-19 cornoavirus second wave infection following first wave and flattening of the curve illustrated by graph and virus symbols drawn on asphalt. Concept of new cases after easing of coronavirus restrictions. Normal phase illustrations COVID-19 Coronavirus Second Wave of Infection After Easing Restrictions. Concept of COVID-19 cornoavirus second wave infection following first wave and flattening of the curve illustrated by graph and virus symbols drawn on asphalt. Concept of new cases after easing of coronavirus restrictions
Free with trial 4-5 day of menstruation - the growth and development of the ovarian follicle. Vector illustration on a gray background. Normal phase vectors 4-5 day of menstruation - the growth and
Free with trial The first day of menstruation - the development of follicles in the ovaries. Vector illustration on isolated background. Normal phase vectors The first day of menstruation - the development of
Free with trial Meiosis cell division. Diploid animal cells. DNA and human reproductive system concept. Medical, biology or anatomical banner or poster for clinic or genetic center. Flat simple vector illustration. Normal phase vectors Meiosis cell division
Free with trial The chemical molecular formula of the hormone progesterone. Female sex hormone. Infographics Vector illustration. Normal phase vectors The chemical molecular formula of the hormone progesterone. Female sex hormone. Infographics Vector illustration
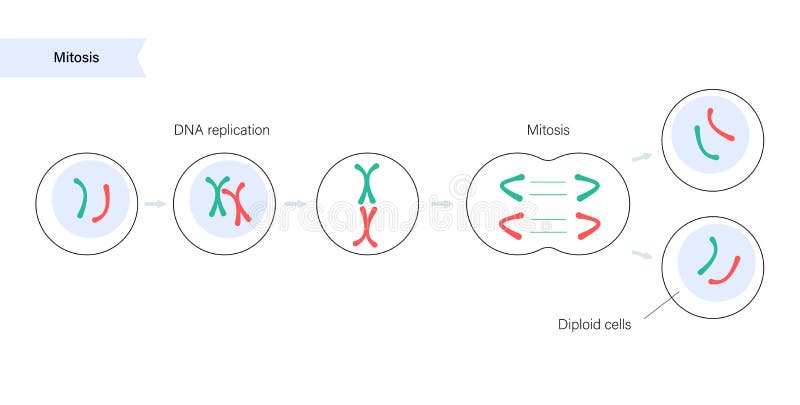
Free with trial Mitosis cell division. Diploid animal cells. DNA and human reproductive system concept. Medical, biology or anatomical banner or poster for clinic or genetic center. Flat simple vector illustration. Normal phase vectors Mitosis cell division.
Free with trial Spermatogenesis and cell division. Diploid cells. DNA replication and human reproductive system concept. Medical, biology, anatomical poster for clinic, genetic center. Flat simple vector illustration. Normal phase vectors Reproductive system concept
Free with trial Mitosis cell division. Diploid animal cells. DNA and human reproductive system concept. Medical, biology or anatomical banner or poster for clinic or genetic center. Flat simple vector illustration. Normal phase vectors Mitosis cell division.
Free with trial Meiosis and mitosos cell division. Diploid cells. DNA and human reproductive system concept. Medical, biology or anatomical banner or poster for clinic, genetic center. Flat simple vector illustration. Normal phase vectors Mitosis and meiosis. Meiosis and mitosos cell division. Diploid cells. DNA and human reproductive system concept. Medical, biology or anatomical banner or poster for clinic, genetic center. Flat simple vector illustration
Free with trial Difference between adsorption and absorption on molecular surface. Surface phenomena. Chemical Adsorption and Physical Adsorption. In absorption particles enter bulk phase. Normal phase vectors Difference between adsorption and absorption vector illustration. difference between adsorption and absorption on molecular surface. Surface phenomena. Chemical Adsorption and Physical Adsorption. In absorption particles enter bulk phase
Free with trial Illustration of gel filtration or size-exclusion column chromatography is used to isolate pure compounds from the mixture sample solution by different molecular weights, such as proteins and polymers. Normal phase illustrations Gel Filtration or Size-Exclusion Column Chromatography
Free with trial Spermatogenesis and cell division. Diploid cells. DNA replication, human reproductive system concept. Doctor in lab. Medical, biology, anatomical poster for clinic, genetic center vector illustration. Normal phase vectors Mitosis process concept. Spermatogenesis and cell division. Diploid cells. DNA replication, human reproductive system concept. Doctor in lab. Medical, biology, anatomical poster for clinic, genetic center vector illustration.
Free with trial Flag of Spain on bar chart concept of COVID-19 coronavirus second wave infection cases following first wave illustrated by graph and virus symbols after easing of restrictions. Normal phase illustrations COVID-19 Coronavirus Second Wave of Infection in Spain. Flag of Spain on bar chart concept of COVID-19 coronavirus second wave infection cases following first wave illustrated by graph and virus symbols after easing of restrictions
Free with trial Flag of India on bar chart concept of COVID-19 coronavirus second wave infection cases following first wave illustrated by graph and virus symbols after easing of restrictions. Normal phase illustrations COVID-19 Coronavirus Second Wave of Infection in India. Flag of India on bar chart concept of COVID-19 coronavirus second wave infection cases following first wave illustrated by graph and virus symbols after easing of restrictions
Free with trial Hair loss scheme stages. Labeled normal, shrink, small follicle with woman or girl character baldness progress thinning hair growth. Skin structure anatomy cross section. Vector illustration. Normal phase vectors Hair loss scheme stages. Labeled normal, shrink, small follicle with woman or girl character baldness progress thinning hair
Free with trial Female Menstrual Cycle Illustration. Uterus. Phase of Menstruation Cycle. Normal phase vectors Female Menstrual Cycle Illustration. Female Reproductive System. Uterus. Phase of Menstruation Cycle. Female Menstrual Cycle Illustration. Uterus. Phase of Menstruation Cycle
Free with trial This radiographic image showcases a healthy, normal lung. The clear expiration, or exhalation phase of the scan, reveals uniform gray coloration characteristic of healthy lung tissue. Air-filled alveoli, the tiny air sacs in the lungs, are clearly visible. Delicate vascular patterns, representing the blood vessels within the lungs, are present but subtle, indicating a normal circulatory system. Normal phase illustrations Normal Lung Tissue: Healthy Appearance on X-Ray or CT Scan. This radiographic image showcases a healthy, normal lung. The clear expiration, or exhalation phase of the scan, reveals uniform gray coloration characteristic of healthy lung tissue. Air-filled alveoli, the tiny air sacs in the lungs, are clearly visible. Delicate vascular patterns, representing the blood vessels within the lungs, are present but subtle, indicating a normal circulatory system
Free with trial This electrocardiogram (ECG) machine displays a healthy heart rhythm, showcasing a typical ECG waveform. The steady, regular pattern on the screen represents a normal heartbeat, crucial for assessing cardiovascular health. Noticeable are the distinct P-QRS-T complexes, each representing a specific phase of the cardiac cycle. The P wave signifies atrial depolarization, the QRS complex represents. Normal phase illustrations Understanding Heart Health A Normal Electrocardiogram ECG Waveform Explained. This electrocardiogram (ECG) machine displays a healthy heart rhythm, showcasing a typical ECG waveform. The steady, regular pattern on the screen represents a normal heartbeat, crucial for assessing cardiovascular health. Noticeable are the distinct P-QRS-T complexes, each representing a specific phase of the cardiac cycle. The P wave signifies atrial depolarization, the QRS complex represents
Free with trial This image shows six different types of stem cells under various microscopy techniques, including phase contrast, fluorescence, and bright field. Each type of stem cell is shown in a pair of images, with one image displaying the cells under normal conditions and the other showing the cells after fluorescence staining. The images provide a detailed view of the structure and organization of the stem. Normal phase illustrations Microscopic images of various types of stem cells and their fluorescence staining. This image shows six different types of stem cells under various microscopy techniques, including phase contrast, fluorescence, and bright field. Each type of stem cell is shown in a pair of images, with one image displaying the cells under normal conditions and the other showing the cells after fluorescence staining. The images provide a detailed view of the structure and organization of the stem
Free with trial Reconstitution soft blue concept icon. Back to normal work. Phase of operation activation continuity. Round shape line illustration. Abstract idea. Graphic design. Easy to use in booklet. Normal phase illustrations Reconstitution soft blue concept icon
Free with trial Reconstitution multi color concept icon. Back to normal work. Phase of operation activation continuity. Round shape line illustration. Abstract idea. Graphic design. Easy to use in booklet. Normal phase vectors Reconstitution multi color concept icon
Free with trial Learning illustration demonstrating water temperature stages with ice normal water and boiling water using three thermometers to show freezing melting and boiling points. Normal phase vectors Educational Illustration of Water Temperature Changes Demonstrating Freezing Melting and Boiling Points. Learning illustration demonstrating water temperature. Learning illustration demonstrating water temperature stages with ice normal water and boiling water using three thermometers to show freezing melting and boiling points
Free with trial Reconstitution blue gradient concept icon. Back to normal work. Phase of operation activation continuity. Round shape line illustration. Abstract idea. Graphic design. Easy to use in booklet. Normal phase vectors Reconstitution blue gradient concept icon
Free with trial Hello i am emotional tag on white background. Normal phase illustrations Hello i am emotional tag on white
Free with trial Angles of incidence and refraction. Normal phase vectors Snell\'s law. angles of incidence and refraction
Free with trial Post covid concept. Hope and the end. Long covid; long-term effects of coronavirus. Chronic fatigue, feeling tired easily. Medical, treatment long covid symstoms, recovery tips. wooden blocks. Normal phase illustrations Post covid concept. Hope and the end. Long covid; long-term effects of coronavirus. Chronic fatigue, feeling tired easily.
Free with trial Stop virus concept. Hope and the end. Stop virus; long-term effects of coronavirus. Chronic fatigue, feeling tired easily. Medical, treatment long covid symstoms, recovery tips. wooden blocks. Normal phase illustrations Stop virus concept. Hope and the end. Stop virus; long-term effects of coronavirus. Chronic fatigue, feeling tired easily.
Free with trial Stop virus concept. Hope and the end. Stop virus; long-term effects of coronavirus. Chronic fatigue, feeling tired easily. Medical, treatment long covid symstoms, recovery tips. wooden blocks. Normal phase illustrations Stop virus concept. Hope and the end. Stop virus; long-term effects of coronavirus. Chronic fatigue, feeling tired easily.
Free with trial Post covid concept. Hope and the end. Long covid; long-term effects of coronavirus. Chronic fatigue, feeling tired easily. Medical, treatment long covid symstoms, recovery tips. wooden blocks. Normal phase illustrations Post covid concept. Hope and the end. Long covid; long-term effects of coronavirus. Chronic fatigue, feeling tired easily.
Free with trial Meiosis is the process in which a single cell divides twice to form four haploid daughter cells. Normal phase illustrations Diagram of meiosis. Meiosis is the process in which a single cell divides twice to form four haploid daughter cells.
Free with trial Meiosis is the process in which a single cell divides twice to form four haploid daughter cells. Normal phase illustrations Diagram of meiosis. Meiosis is the process in which a single cell divides twice to form four haploid daughter cells.
Free with trial Meiosis is the process in which a single cell divides twice to form four haploid daughter cells. Normal phase illustrations Diagram of meiosis. Meiosis is the process in which a single cell divides twice to form four haploid daughter cells.
Free with trial Atherosclerosis stage. Anatomy of heart attack. Arteriosclerotic vascular disease or ASVD. Atherosclerotic plaque in coronary artery. Vector illustration on white background. Normal phase vectors Atherosclerosis stage. Anatomy of heart attack. Arteriosclerotic vascular disease or ASVD. Atherosclerotic plaque in
Free with trial Stop virus concept. Hope and the end. Stop virus; long-term effects of coronavirus. Chronic fatigue, feeling tired easily. Medical, treatment long covid symstoms, recovery tips. wooden blocks. Normal phase vectors Stop virus concept. Hope and the end. Stop virus; long-term effects of coronavirus.
Free with trial Post covid concept. Hope and the end. Long covid; long-term effects of coronavirus. Chronic fatigue, feeling tired easily. Medical, treatment long covid symstoms, recovery tips. wooden blocks. Normal phase vectors Post covid concept. Hope and the end. Long covid; long-term effects of coronavirus.
Free with trial Post covid concept. Hope and the end. Long covid; long-term effects of coronavirus. Chronic fatigue, feeling tired easily. Medical, treatment long covid symstoms, recovery tips. wooden blocks. Normal phase vectors Post covid concept. Hope and the end. Long covid; long-term effects of coronavirus. Chronic fatigue, feeling tired easily.
Free with trial Stop virus concept. Hope and the end. Stop virus; long-term effects of coronavirus. Chronic fatigue, feeling tired easily. Medical, treatment long covid symstoms, recovery tips. Normal phase vectors Stop virus concept. Hope and the end. Stop virus; long-term effects of coronavirus. Chronic fatigue, feeling tired easily
Free with trial Post covid concept. Hope and the end. Long covid; long-term effects of coronavirus. Chronic fatigue, feeling tired easily. Medical, treatment long covid symstoms, recovery tips. Normal phase vectors Post covid concept. Hope and the end. Long covid; long-term effects of coronavirus. Chronic fatigue, feeling tired easily
Free with trial Atherosclerosis is a pattern of the disease arteriosclerosis, characterized by development of abnormalities called lesions in walls of arteries. This is a chronic inflammatory disease involving many different cell types and driven by elevated levels of cholesterol in the blood. Normal phase vectors Atherosclerosis
Free with trial Illustration image of Bearded Dragon on White Made With Generative AI illustration , wildlife concept. Normal phase illustrations Bearded Dragon on White
Free with trial Illustration image of Bearded Dragon on White Made With Generative AI illustration , wildlife concept. Normal phase illustrations Bearded Dragon on White
Free with trial Illustration image of Bearded Dragon on White Made With Generative AI illustration , wildlife concept. Normal phase illustrations Bearded Dragon on White
Free with trial Set of voltage monitoring relays in normal, overvoltage and undervoltage statuses. Vector illustration in flat style. Normal phase vectors Voltage monitoring relays in different states. Set of voltage monitoring relays in normal, overvoltage and undervoltage statuses. Vector illustration in flat style
Free with trial This minimalist still life photograph captures a single, worn face mask, a poignant symbol of the pandemic impact. The image, with its clean, neutral tones and subtle textures, evokes a sense of closure and hope for the future. The single object against a simple background emphasizes the quiet transition from the era of pandemic protection to the recovery phase. The worn texture of the mask. Normal phase illustrations A Single Worn Face Mask Symbolic End of a Pandemic Era Minimalist Still Life Capturing the Hope of. This minimalist still life photograph captures a single, worn face mask, a poignant symbol of the pandemic impact. The image, with its clean, neutral tones and subtle textures, evokes a sense of closure and hope for the future. The single object against a simple background emphasizes the quiet transition from the era of pandemic protection to the recovery phase. The worn texture of the mask
Free with trial Stop virus concept. Hope and the end. Stop virus; long-term effects of coronavirus. Chronic fatigue, feeling tired easily. Medical, treatment long covid symstoms, recovery tips. wooden blocks. Normal phase vectors Stop virus concept. Hope and the end. Stop virus; long-term effects of coronavirus. Chronic fatigue, feeling tired easily. Medical
Free with trial Post covid concept. Hope and the end. Long covid; long-term effects of coronavirus. Chronic fatigue, feeling tired easily. Medical, treatment long covid symstoms, recovery tips. Computer keyboard keys. Normal phase illustrations Post covid concept. Hope and the end. Long covid; long-term effects of coronavirus. Chronic fatigue, feeling tired easily.
Free with trial Stop virus concept. Hope and the end. Stop virus; long-term effects of coronavirus. Chronic fatigue, feeling tired easily. Medical, treatment long covid symstoms, recovery tips. Computer keyboard keys. Normal phase illustrations Stop virus concept. Hope and the end. Stop virus; long-term effects of coronavirus. Chronic fatigue, feeling tired easily.
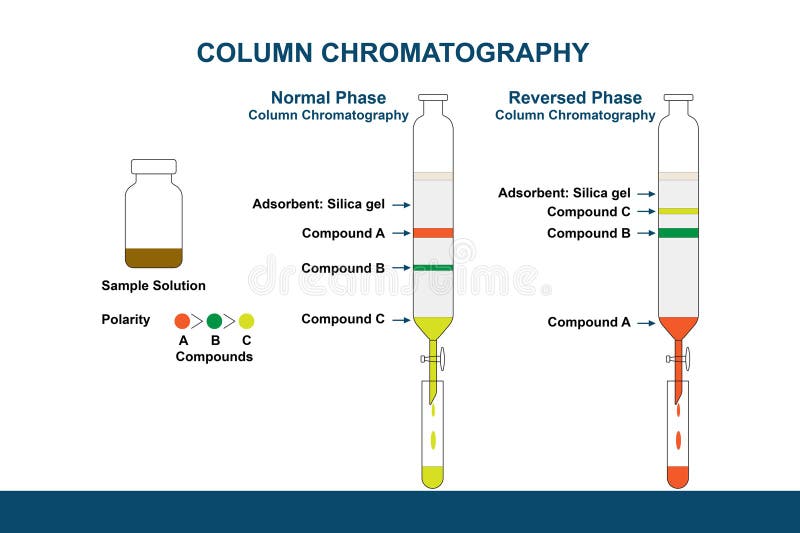
Free with trial Illustration of Normal Phase and Reversed-Phase Column Chromatography. Column chromatography isolates pure compounds from a mixture sample solution used in the chemistry lab or scientific research. Normal phase illustrations Normal Phase and Reversed-Phase Column Chromatography
Free with trial Illustration of a man working with his laptop in his room. work from home during pandemic. new normal is coming. Normal phase vectors A man work from home during new normal phase. Illustration of a man working with his laptop in his room. work from home during pandemic. new normal is coming
Free with trial Illustration of reversed-phase thin layer chromatography plate and reversed-phase Column Chromatography are used to investigate and isolate pure compounds from the mixture sample solution. Normal phase illustrations Reversed-Phase Thin Layer Chromatography plate and Reversed Phase Column Chromatography. Illustration of reversed-phase thin layer chromatography plate and reversed-phase Column Chromatography are used to investigate and isolate pure compounds from the mixture sample solution