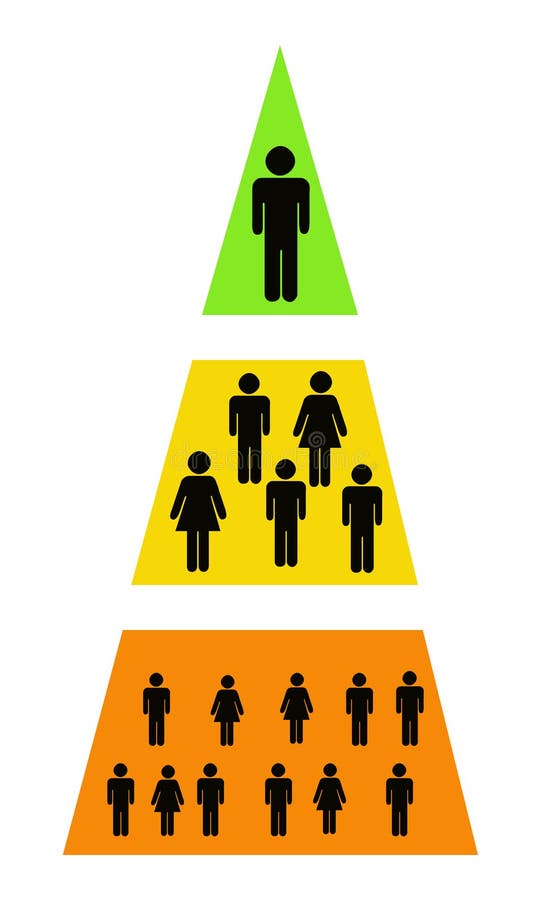
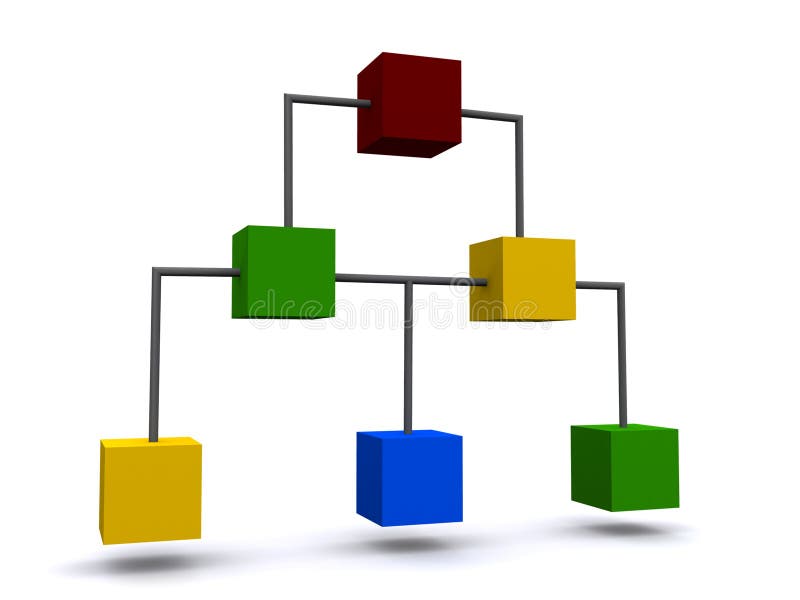
Free with trial Three levels of organizational structure. This is 3d render. Organizational levels illustrations Simple organizational structure. Three levels of organizational structure. This is 3d render.
Free with trial A diagram of an organization chart drawn on sticky notes. Organizational levels illustrations Org Chart Pyramid Chart Drawn on Sticky Notes. A diagram of an organization chart drawn on sticky notes
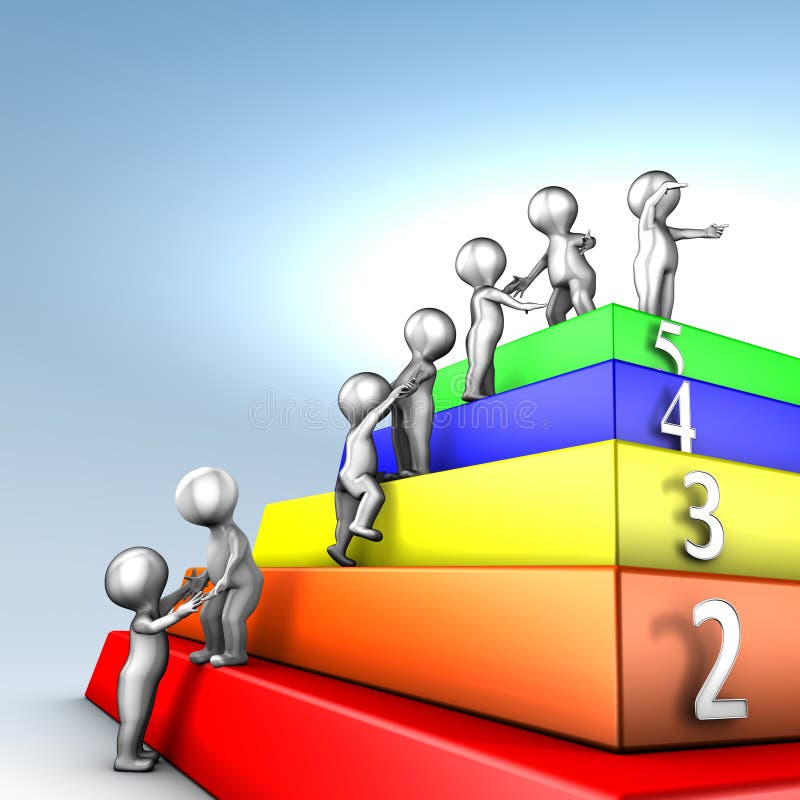
Free with trial Capability Maturity Model Integration is a process improvement approach that helps organizations to improve their performance. There are five maturity levels: 1-Initial, 2-Managed, 3-Defined, 4-Quantitatively Managed, 5-Optimizing. Organizational levels illustrations Capability Maturity Model Integration maturity. Capability Maturity Model Integration is a process improvement approach that helps organizations to improve their performance. There are five maturity levels: 1-Initial, 2-Managed, 3-Defined, 4-Quantitatively Managed, 5-Optimizing
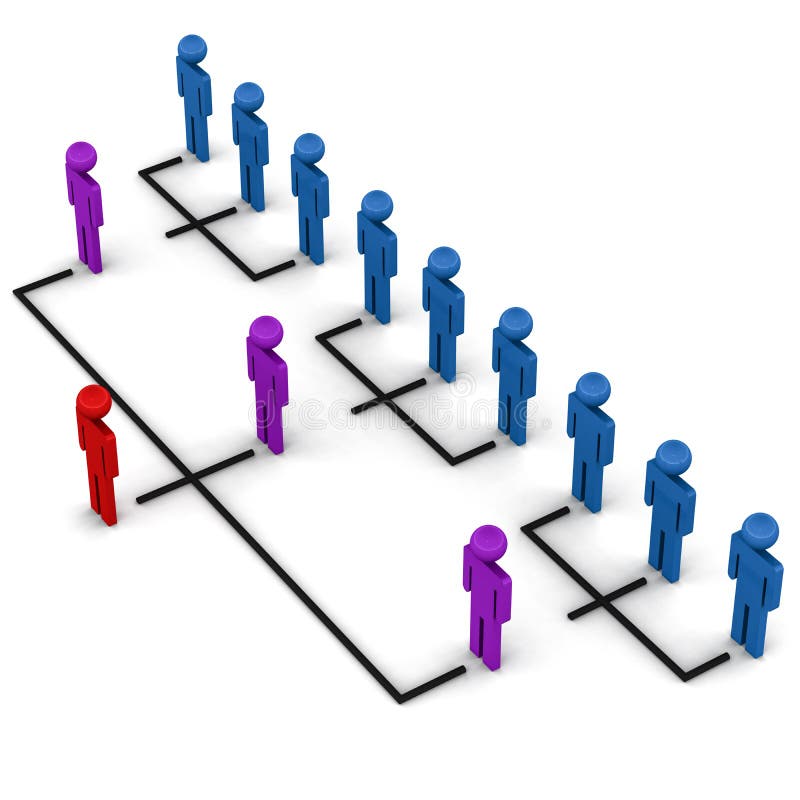
Free with trial A simple hierarchy or organizational structure, in 3d figures, representing various management levels. Organizational levels illustrations Organizational structure
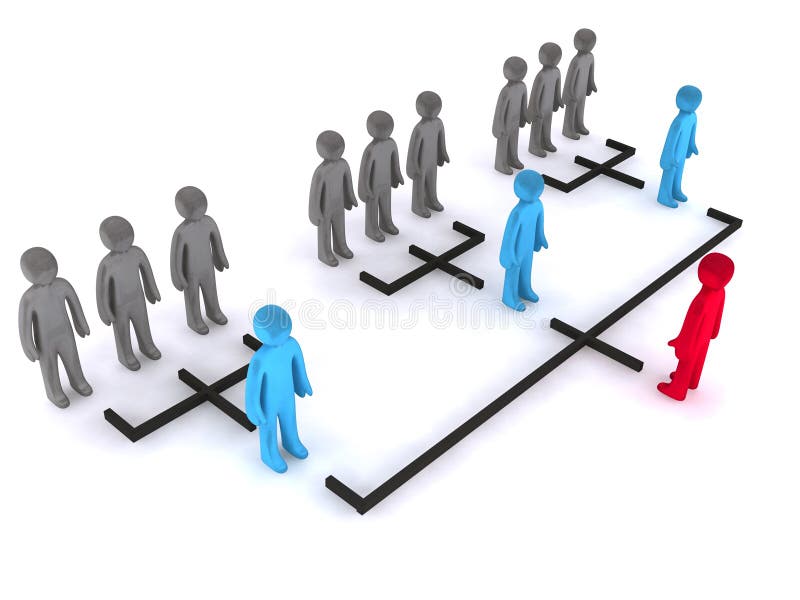
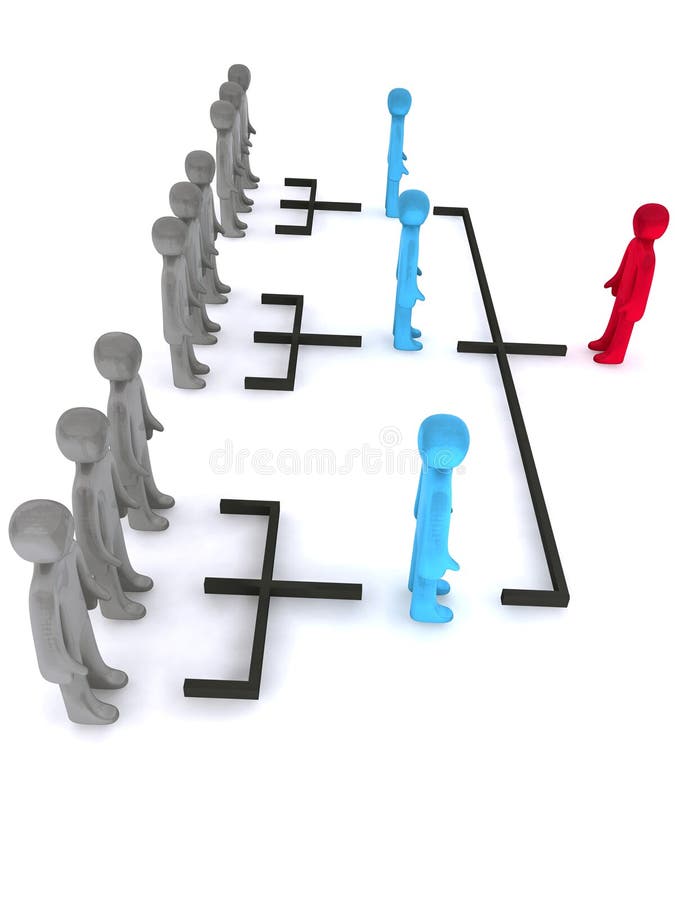
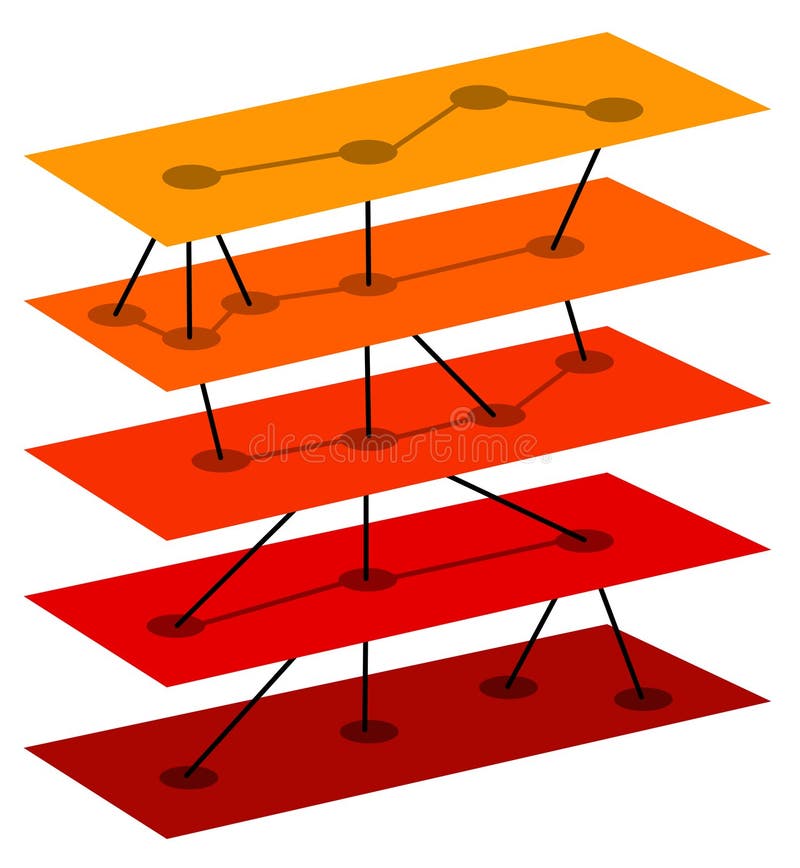
Free with trial An advanced hierarchy or organizational structure, in 3d figures, representing various management levels, dotted lines as staff relationship and solid line as line relationship. Organizational levels illustrations Organizational structure staff and line. An advanced hierarchy or organizational structure, in 3d figures, representing various management levels, dotted lines as staff relationship and solid line as line relationship
Free with trial An empty square in an organizational chart with a sign reading Open Position. Organizational levels illustrations Open Position in Organizational Chart. An empty square in an organizational chart with a sign reading Open Position
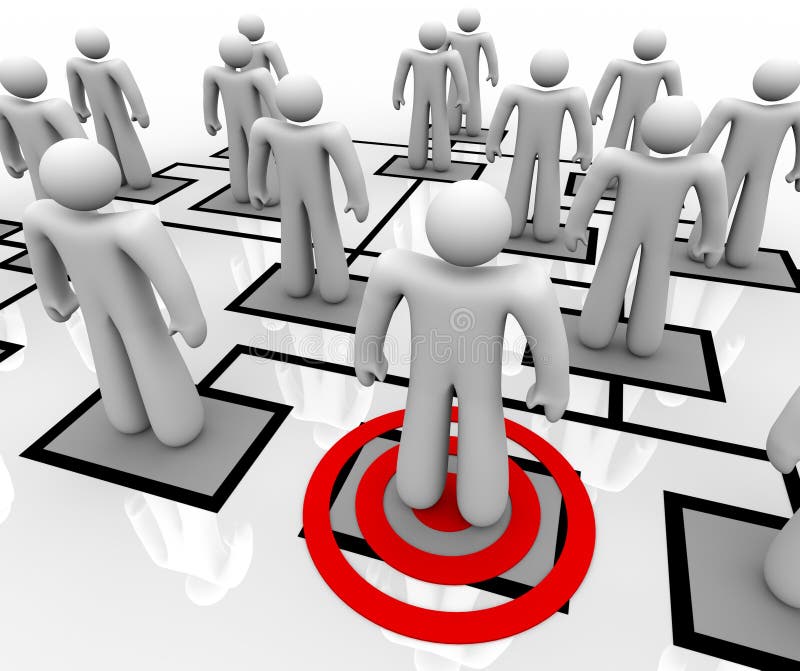
Free with trial A red target centers on one employee in an organizational chart. Organizational levels illustrations Targeted Employee in Organizational Chart. A red target centers on one employee in an organizational chart
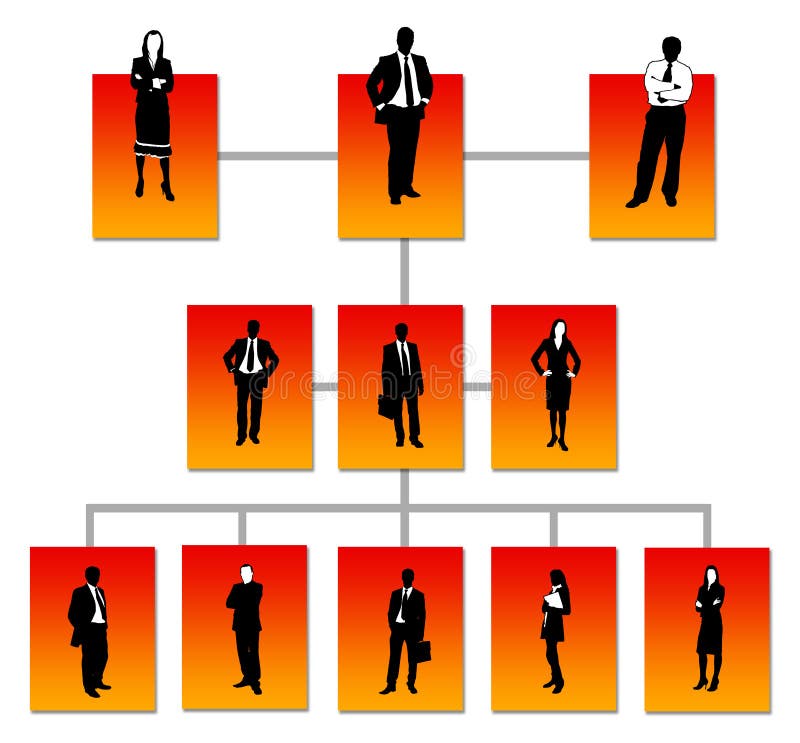
Free with trial People stand in colored boxes in an organizational chart. Organizational levels illustrations Organizational Chart - People in Colored Boxes. People stand in colored boxes in an organizational chart
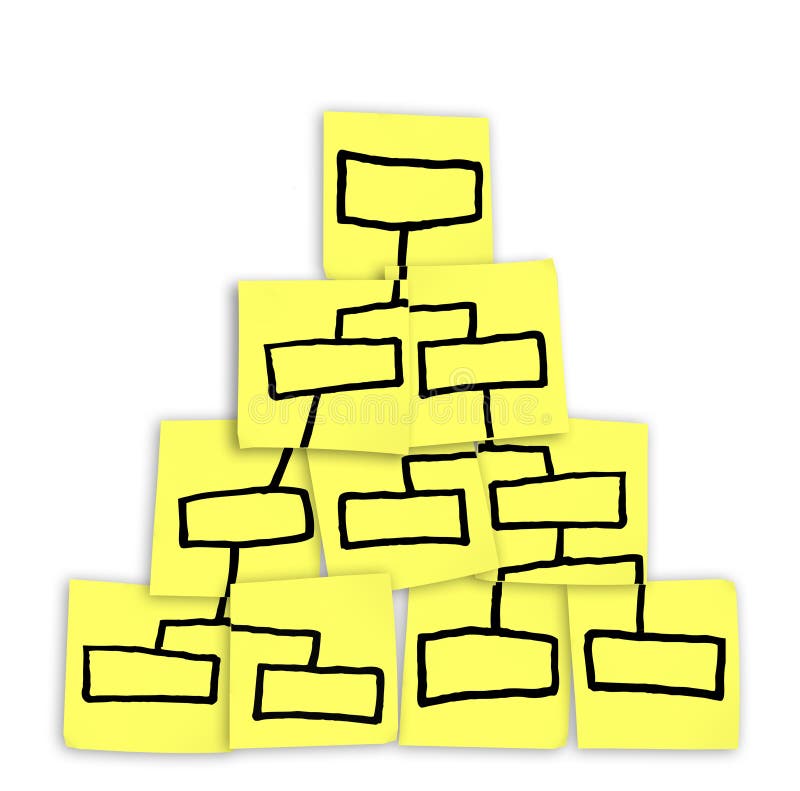
Free with trial A diagram of of an organizational chart drawn on yellow notes. Organizational levels illustrations Organizational Chart Pyramid Drawn on Sticky Notes. A diagram of of an organizational chart drawn on yellow notes
Free with trial Levels of ecological organization with living organism division outline concept. Labeled educational individual, population, ecosystem, biome and biosphere classification system vector illustration. Organizational levels vectors Levels of ecological organization with organism division outline concept. Levels of ecological organization with living organism division outline concept. Labeled educational individual, population, ecosystem, biome and biosphere classification system vector illustration.
Free with trial Several colorful boxes in an organization chart. Organizational levels illustrations Organizational Chart - Colorful Boxes. Several colorful boxes in an organization chart
Free with trial A leader motivates his workers in an organizational chart. Organizational levels illustrations Rallying the Troops - Organization Chart. A leader motivates his workers in an organizational chart
Free with trial Enterprise resource planning process with four stages like plan analyze execute monitor on 4 arrows and cogs on white background. Organizational levels illustrations ERP process. Enterprise resource planning process with four stages like plan analyze execute monitor on 4 arrows and cogs on white background
Free with trial Hierarchy or chain of command in a company or institution. Organizational levels illustrations Hierarchy
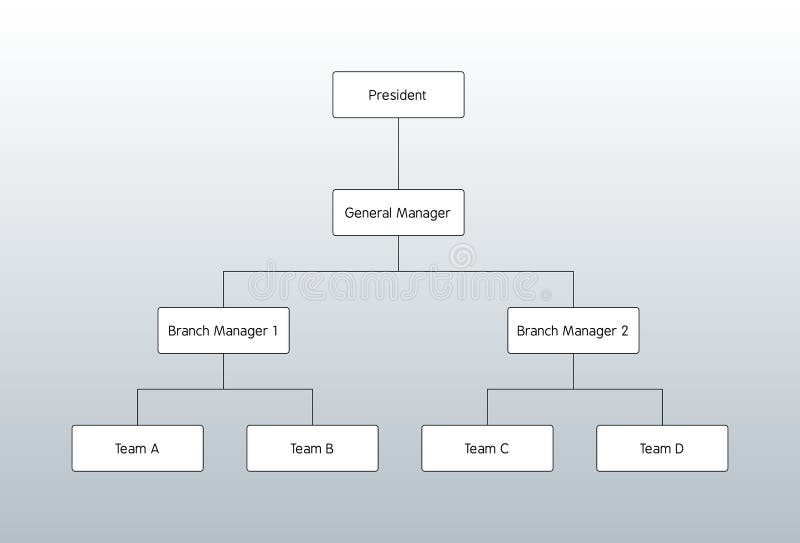
Free with trial Vector illustration of company organization chart on white background. You can swap people and add or change levels following your company structure. Organizational levels illustrations Organization chart
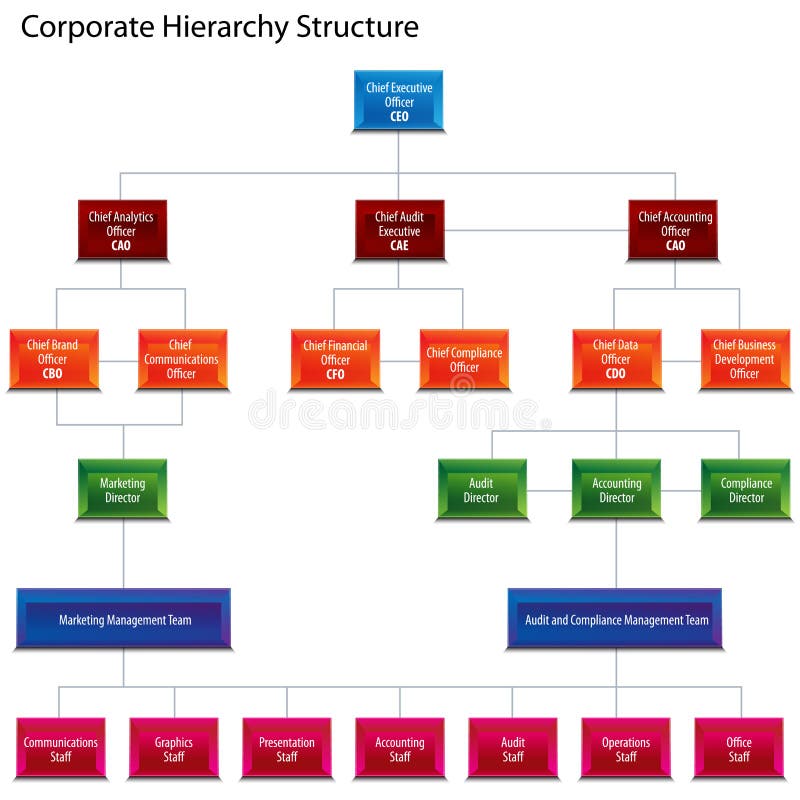
Free with trial An image of a corporate hierarchy structure chart. Organizational levels vectors Corporate Hierarchy Structure Chart
Free with trial Open Position words organization chart new opening in company or business for hiring a worker or skilled job candidate. Organizational levels illustrations Open Position Job Opportunity Hiring Worker New Opening. Open Position words organization chart new opening in company or business for hiring a worker or skilled job candidate
Free with trial Three levels of organizational structure. This is 3d render. Organizational levels illustrations Simple organizational structure. Three levels of organizational structure. This is 3d render.
Free with trial An organizational chart of colored boxes on white background. Organizational levels illustrations Organizational Chart - Colored Boxes. An organizational chart of colored boxes on white background
Free with trial 3d render of open position in organizational chart. Organizational levels illustrations 3d open position. 3d render of open position in organizational chart
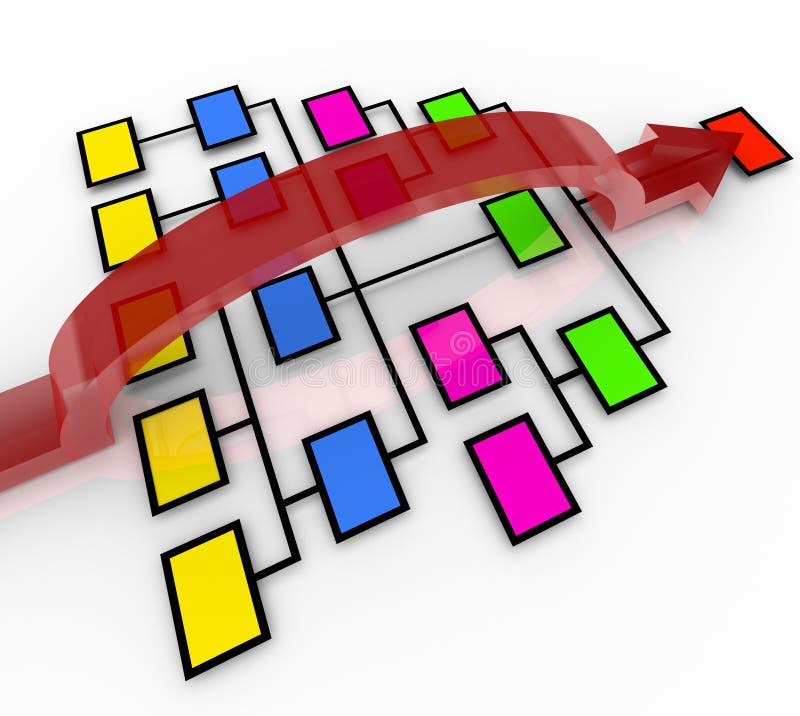
Free with trial An arrow jumps over the positions and middle management levels of an organizational org chart to reach the top boss or leader, skipping past other employees. Organizational levels illustrations Going Straight to the Top Promoted Boss Leader. An arrow jumps over the positions and middle management levels of an organizational org chart to reach the top boss or leader, skipping past other employees
Free with trial Organizational chart of women s enterprise. You can swap people and add or change levels following your company structure. Organizational levels vectors Organizationl chart of women's entreprise. Organizational chart of women s enterprise. You can swap people and add or change levels following your company structure
Free with trial Three-dimensional organizational or management chart with colored boxes in a pyramid or hierarchy shape. Organizational levels illustrations 3D organization chart. Three-dimensional organizational or management chart with colored boxes in a pyramid or hierarchy shape.
Free with trial Road leading to recovery, a 3d road leading to the test that says road to recovery, economy and organizational profit making and recovery concept. Organizational levels illustrations Road to recovery
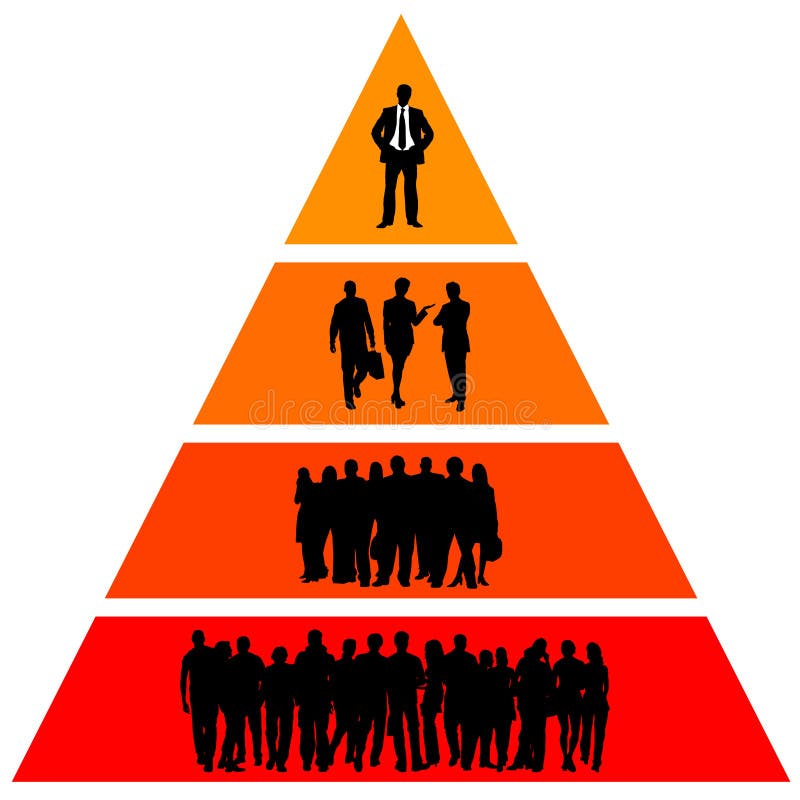
Free with trial Human pyramid of organizational hierarchy, HR concept of team work at different levels, blue 3d men, white background. Organizational levels illustrations Human pyramid hierarchy. Human pyramid of organizational hierarchy, HR concept of team work at different levels, blue 3d men, white background
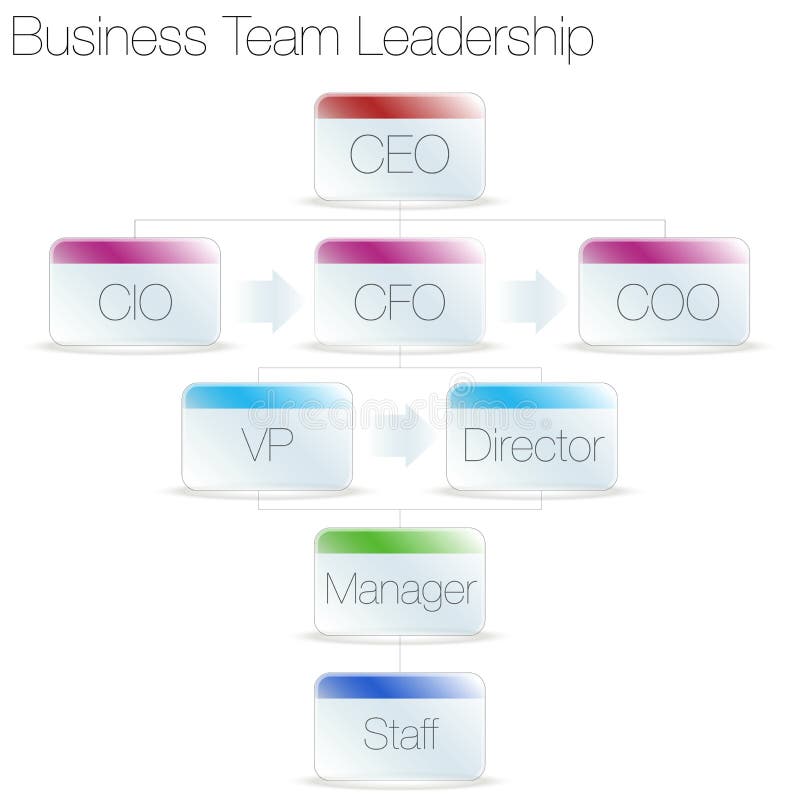
Free with trial An image of a business team leadership chart. Organizational levels vectors Business Team Leadership Chart
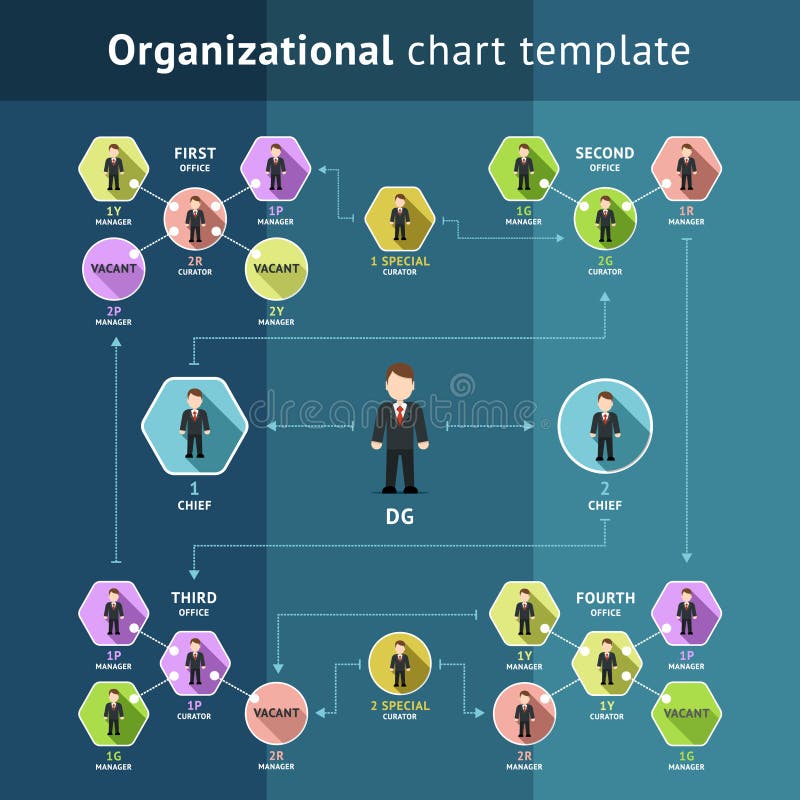
Free with trial Business organization structure, organizational chart template. Hierarchy and scheme. Vector illustration. Organizational levels vectors Business organization structure
Free with trial Horizontal business hierarchy chart infographics. Corporate organizational structure graphic elements with 2 levels. The top-level connects to 5 subordinate nodes. Organizational levels vectors Horizontal business hierarchy chart infographics. Corporate organizational structure graphic elements with 2 levels. The
Free with trial Structure or organization with different levels. Organizational levels illustrations Levels
Free with trial Three levels of organizational structure. This is 3d render. Organizational levels illustrations Simple organizational structure. Three levels of organizational structure. This is 3d render.
Free with trial Organizational structure with company staff hierarchy tiny person concept. People management and business group or personnel levels organization vector illustration. Employee pyramid chart or graphic. Organizational levels vectors Organizational structure with company staff hierarchy tiny person concept
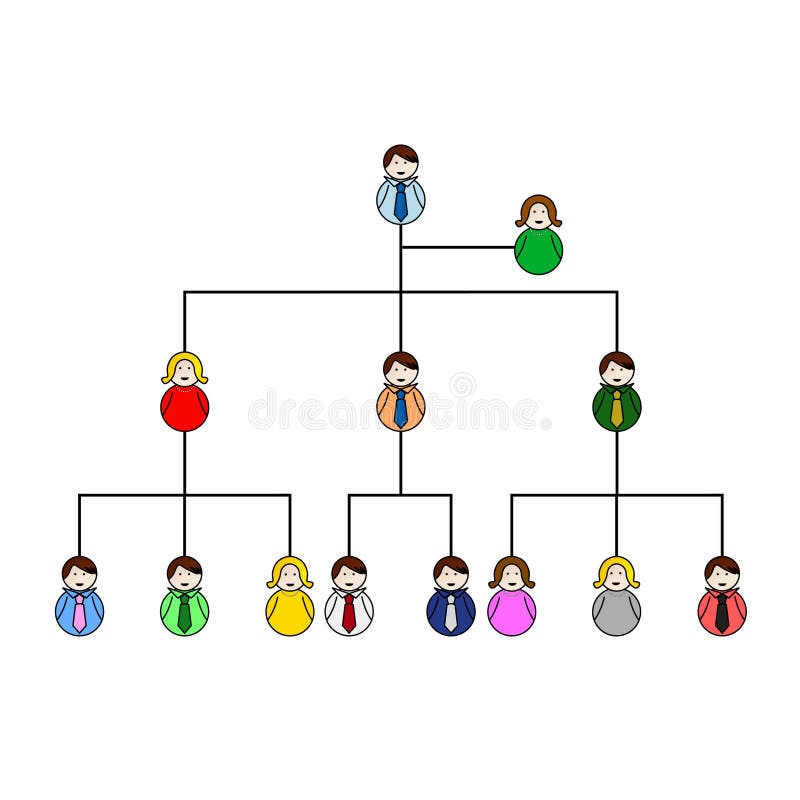
Free with trial Vector illustration of cartoon business people characters on company organizational hierarchical chart isolated on grey background. Organizational levels vectors Business Organizational Hierarchy Vector Cartoon Illustration. Vector illustration of cartoon business people characters on company organizational hierarchical chart isolated on grey background
Free with trial An image of a circular process chart with levels. Organizational levels vectors Leveled Process Chart. An image of a circular process chart with levels.
Free with trial Different levels in a company hierarchy. Organizational levels illustrations Management. Different levels in a company hierarchy
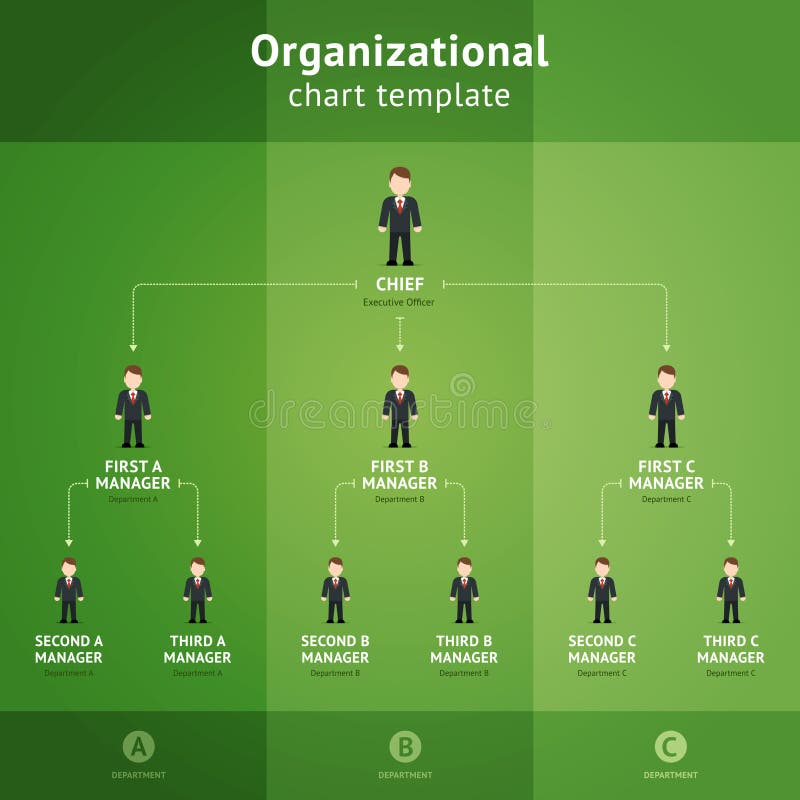
Free with trial Hierarchy diagram from chef to subordinates on a green background. Organizational chart template. Vector illustration. Organizational levels vectors Organizational chart template
Free with trial 3d magnifying glass looking for vacant position in organizational chart. Organizational levels illustrations 3d magnifier and vacant position. 3d magnifying glass looking for vacant position in organizational chart
Free with trial Hierarchy with different levels in a company. Organizational levels illustrations Company structure. Hierarchy with different levels in a company
Free with trial Hierarchical diagram of official headed. Organizational chart template. Vector illustration. Organizational levels vectors Vector organization chart. Hierarchical diagram of official headed. Organizational chart template. Vector illustration
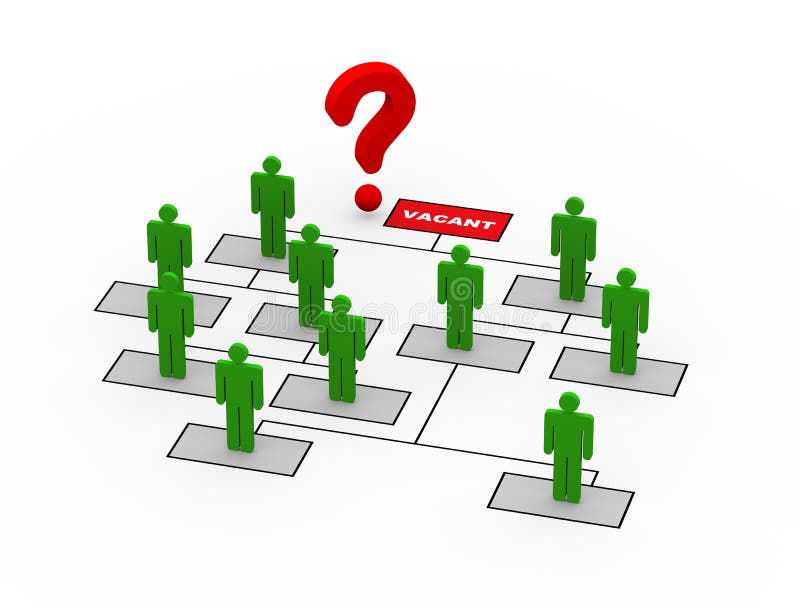
Free with trial 3d rendering of question mark near ce o open vacant position in organizational chart. Organizational levels illustrations 3d question mark ceo vacant position. 3d rendering of question mark near ce o open vacant position in organizational chart
Free with trial 33 International corporate executive Job Titles, CEO CAE CBO CFO CSA CAO CCO CDO CFS CIO HR vector banners for web design, corporate organizational structure elements. Organizational levels vectors 33 International corporate executive Job Titles, CEO CAE CBO CFO CSA CAO CCO CDO CFS CIO HR vector banners for web
Free with trial Businessmen work with laptops on graph columns. Business hierarchy, hierarchical organization, levels of hierarchy concept on ultraviolet background. Bright vibrant violet vector isolated illustration. Organizational levels vectors Business hierarchy concept vector illustration. Businessmen work with laptops on graph columns. Business hierarchy, hierarchical organization, levels of hierarchy concept on ultraviolet background. Bright vibrant violet vector isolated illustration
Free with trial Businessmen work with laptops on graph columns. Business hierarchy, hierarchical organization, levels of hierarchy concept on white background. Header or footer banner template with copy space. Organizational levels vectors Business hierarchy concept banner header. Businessmen work with laptops on graph columns. Business hierarchy, hierarchical organization, levels of hierarchy concept on white background. Header or footer banner template with copy space.
Free with trial Organizational chart down outline flat color icons with quadrant frames on white background. Organizational levels vectors Organizational chart down outline flat color icons with quadrant frames
Free with trial Having a strict hierarchy in a company or organization. Organizational levels illustrations Hierarchy
Free with trial Colorful spheres and boxes in an hierarchy organization chart. Organizational levels illustrations Colorful spheres and boxes in an hierarchy chart. Colorful spheres and boxes in an hierarchy organization chart
Free with trial Vector Illustration of Organizational Corporate Chart. Organizational levels vectors Organization Chart. Vector Illustration of Organizational Corporate Chart
Free with trial A bulls-eye target on a box in an organization org chart diagram, representing one position or employee being targeted or watched for promotion or elimination. Organizational levels illustrations Targeted Position Organization Org Chart Bulls-Eye. A bulls-eye target on a box in an organization org chart diagram, representing one position or employee being targeted or watched for promotion or elimination
Free with trial Chain of command in an organization. Organizational levels illustrations Chain of command
Free with trial 3d render of vacant position in the business organization. Organizational levels illustrations 3d vacant position. 3d render of vacant position in the business organization.
Free with trial Vector Illustration of Organizational Corporate Chart. Organizational levels vectors Organization Chart. Vector Illustration of Organizational Corporate Chart
Free with trial Organization chart template. White paper ribbon on dark background. Organizational levels vectors Organization chart template
Free with trial Headcount word block on white background. Organizational levels illustrations Headcount word block on white
Free with trial Creative design of boss organization. Organizational levels vectors Organization design. Creative design of boss organization
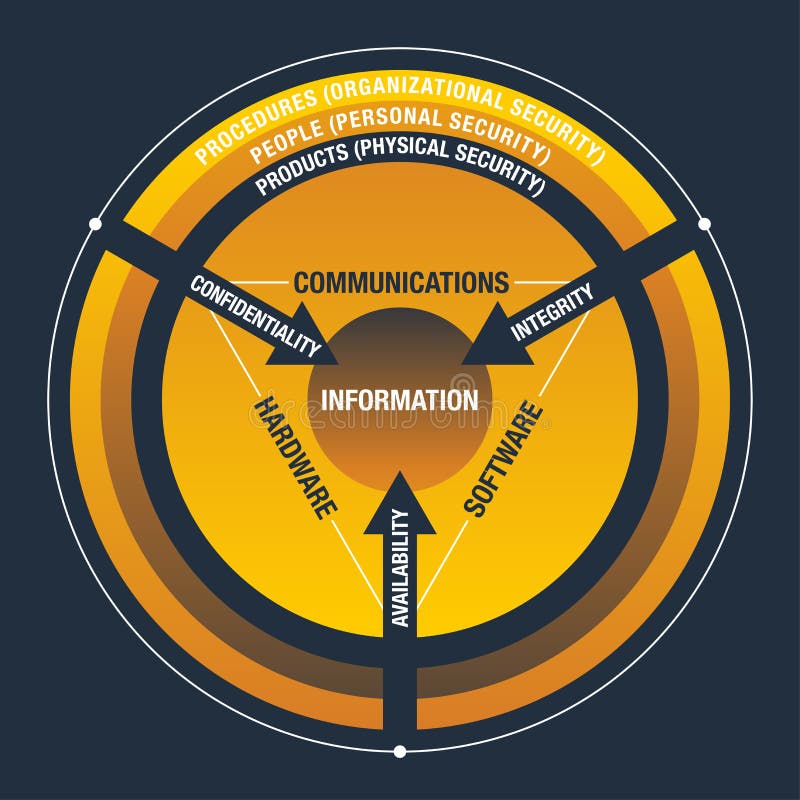
Free with trial CIA Information Security circle of Attributes - Qualitiy, Confidentiality, Integrity and Availability - security of Information Systems. Organizational levels vectors CIA circle- security of Information Systems. CIA Information Security circle of Attributes - Qualitiy, Confidentiality, Integrity and Availability - security of Information Systems
Free with trial Writing note showing Planning Your Pivot. Business photo showcasing path that most startups go through find right customer Blank Color Oval Shape with Leaves and Buds as Border for Invitation. Organizational levels illustrations Writing note showing Planning Your Pivot. Business photo showcasing path that most startups go through find right
Free with trial Business hierarchy chart infographics. Corporate organizational structure graphic elements with 5 levels. Organizational levels illustrations Business hierarchy chart infographics. Corporate organizational structure graphic elements with 5 levels
Free with trial This icon illustrates an organizational hierarchy showing company structure leadership levels management roles and team relationships. Suitable for HR systems corporate planning and organizational management tools. Organizational levels vectors Organizational Hierarchy Icon Showing Company Structure Management and Team Levels. This icon illustrates an organizational hierarchy showing company structure leadership levels management roles and team relationships. Suitable for HR systems corporate planning and organizational management tools.
Free with trial A clear vector hierarchical organizational chart displaying multiple levels of a structure, from top leadership to underlying teams. This infographic is perfect for corporate governance, team management, or educational diagrams, providing a straightforward and scalable representation of reporting structures and departmental relationships, vector design Generative AI. Organizational levels vectors Hierarchical Organizational Chart with Multiple Levels, vector design Generative AI. A clear vector hierarchical organizational chart displaying multiple levels of a structure, from top leadership to underlying teams. This infographic is perfect for corporate governance, team management, or educational diagrams, providing a straightforward and scalable representation of reporting structures and departmental relationships, vector design Generative AI
Free with trial Explore a detailed organizational chart illustrating the hierarchical structure of a company. This visual represents management levels, from top executives to general employees, depicting a clear chain of command. Organizational levels illustrations Organizational hierarchy chart visualizing corporate structure management levels and team roles. Explore a detailed organizational chart illustrating the hierarchical structure of a company. This visual represents management levels, from top executives to general employees, depicting a clear chain of command
Free with trial A black and white line drawing of an organizational chart with multiple levels of employees, each represented by a simple stick figure sitting at a desk. The chart shows a hierarchical structure with leaders and team members. Organizational levels vectors Organizational chart with multiple levels of employees. A black and white line drawing of an organizational chart with multiple levels of employees, each. A black and white line drawing of an organizational chart with multiple levels of employees, each represented by a simple stick figure sitting at a desk. The chart shows a hierarchical structure with leaders and team members
Free with trial Title: Organizational Chart Depicting Hierarchy and Reporting Structure with Seven Levels. Organizational levels vectors Title: Organizational Chart Depicting Hierarchy and Reporting Structure with Seven Levels.
Free with trial A simple vector illustration of a hierarchical organizational chart, featuring interconnected boxes representing different levels and departments. This clear graphic is ideal for presenting company structures, team hierarchies, or conceptual frameworks in business or educational contexts, offering an easy-to-understand visual representation, vector design Generative AI. Organizational levels vectors Hierarchical Organizational Chart with Multiple Levels, vector design Generative AI. A simple vector illustration of a hierarchical organizational chart, featuring interconnected boxes representing different levels and departments. This clear graphic is ideal for presenting company structures, team hierarchies, or conceptual frameworks in business or educational contexts, offering an easy-to-understand visual representation, vector design Generative AI
Free with trial Vertical business organizational chart infographic with three hierarchical levels. The top-level connects to 8 subordinate nodes. Organizational levels vectors Vertical business organizational chart infographic with three hierarchical levels. The top-level connects to 8
Free with trial Vertical business organizational chart infographic with three hierarchical levels. The top-level connects to 6 subordinate nodes. Organizational levels vectors Vertical business organizational chart infographic with three hierarchical levels. The top-level connects to 6
Free with trial Vertical business organizational chart infographic with 4 hierarchical levels. The top-level connects to 15 subordinate nodes. Organizational levels vectors Vertical business organizational chart infographic with 4 hierarchical levels. The top-level connects to 15 subordinate
Free with trial Vertical business organizational chart infographic with 4 hierarchical levels. The top-level connects to 12 subordinate nodes. Organizational levels vectors Vertical business organizational chart infographic with 4 hierarchical levels. The top-level connects to 12 subordinate
Free with trial Vertical business organizational chart infographic with three hierarchical levels. The top-level connects to 10 subordinate nodes. Organizational levels vectors Vertical business organizational chart infographic with three hierarchical levels. The top-level connects to 10
Free with trial Vertical business hierarchy chart infographics. Corporate organizational structure graphic elements with 3 levels. The top-level connects to five subordinate nodes. Organizational levels vectors Vertical business hierarchy chart infographics. Corporate organizational structure graphic elements with 3 levels. The
Free with trial Horizontal business hierarchy chart infographics. Corporate organizational structure graphic elements with 4 levels. The top-level connects to 11 subordinate nodes. Organizational levels vectors Horizontal business hierarchy chart infographics. Corporate organizational structure graphic elements with 4 levels. The
Free with trial Horizontal business hierarchy chart infographics. Corporate organizational structure graphic elements with 2 levels. The top-level connects to 4 subordinate nodes. Organizational levels vectors Horizontal business hierarchy chart infographics. Corporate organizational structure graphic elements with 2 levels. The
Free with trial Horizontal business hierarchy chart infographics. Corporate organizational structure graphic elements with 2 levels. The top-level connects to 3 subordinate nodes. Organizational levels vectors Horizontal business hierarchy chart infographics. Corporate organizational structure graphic elements with 2 levels. The
Free with trial Geometric Blocks Forming a Stacked Hierarchy, Illustrating Organizational Levels A minimalist, abstract composition of precisely stacked geometric blocks (cubes, rectangular prisms) in various muted. Organizational levels illustrations Geometric Blocks Forming a Stacked Hierarchy, Illustrating Organizational Levels A minimalist, abstract
Free with trial Ascending levels of a corporate team, signifying progress, promotion, and organizational advancement. Abstract, minimalist representation of ascending geometric platforms or pathways in a clean,. Organizational levels illustrations Ascending levels of a corporate team, signifying progress, promotion, and organizational advancement. Abstract, minimalist
Free with trial This captivating image showcases a dynamic organizational chart built from colorful wooden blocks. It effectively represents the intricate structure of a business, clearly depicting management levels and the relationships between different teams. The use of interconnected gears within the blocks visually emphasizes the interdependence of various roles and departments. This visual representation. Organizational levels illustrations Visualizing Business Structure A Wooden Block Organizational Chart Illustrates Team Roles Management Levels and Gear. This captivating image showcases a dynamic organizational chart built from colorful wooden blocks. It effectively represents the intricate structure of a business, clearly depicting management levels and the relationships between different teams. The use of interconnected gears within the blocks visually emphasizes the interdependence of various roles and departments. This visual representation