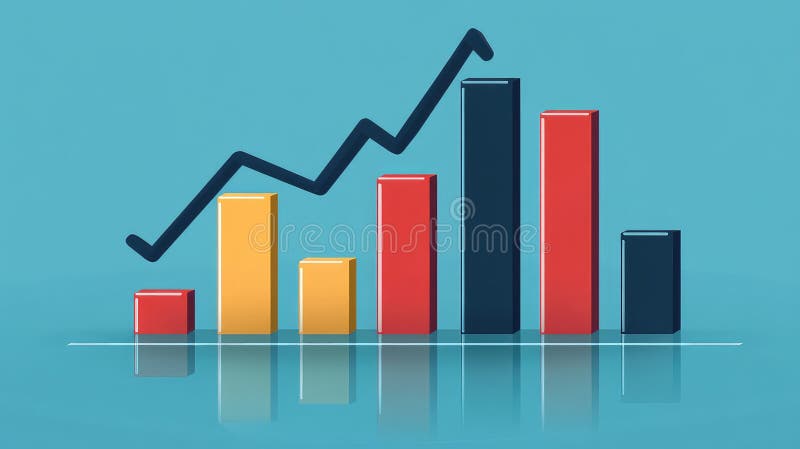
Free with trial Data charts and tables illustration sales bar, colorful categories, figures trends data charts and tables. Overview decrease illustrations Data charts and tables
Free with trial Visualization collapsing data analytics chart illustration trend analysis, dashboard metrics, anomaly decline visualization collapsing data analytics chart. Overview decrease illustrations Visualization collapsing data analytics chart
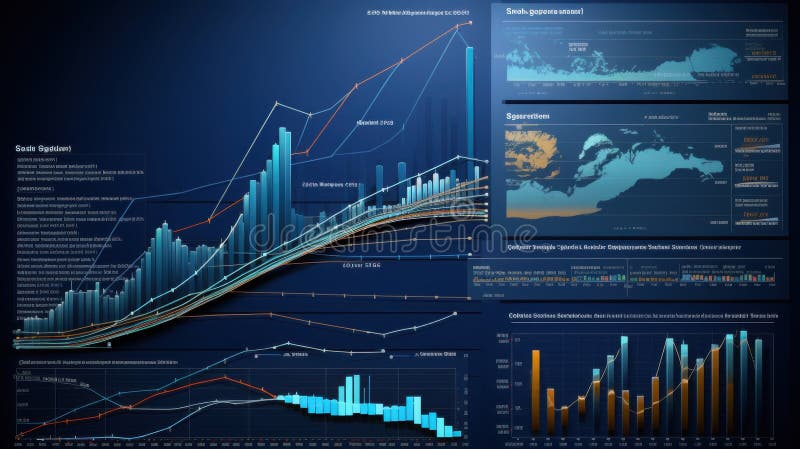
Free with trial A dark-themed dashboard displaying various charts and graphs visualizing business data analytics. Overview decrease illustrations Dark Theme Data Analytics Dashboard Displays Various Charts. A dark-themed dashboard displaying various charts and graphs visualizing business data analytics
Free with trial A set of twelve colorful icons representing various data visualization methods, including bar charts, pie charts, line graphs, and other visual representations of data analysis. Perfect for presentations, reports, and websites needing clear data insights. Overview decrease illustrations Data Visualization Icons. A set of twelve colorful icons representing various data visualization methods, including bar charts, pie charts, line graphs, and other visual representations of data analysis. Perfect for presentations, reports, and websites needing clear data insights.
Free with trial A stylized, flat design illustration of a magnifying glass. The lens is a vibrant teal color, framed by a bold orange border. Inside the lens, a prominent white horizontal bar with an orange line in the center represents a minus symbol, indicating a zoom-out or reduce function. The handle is a light beige color, completing the clean, modern aesthetic. This graphic is perfect for representing concepts related to search, analysis, reduction, or digital interface controls. Overview decrease vectors Magnifying Glass with Minus Symbol - Zoom Out Icon. A stylized, flat design illustration of a magnifying glass. The lens is a vibrant teal color, framed by a bold orange border. Inside the lens, a prominent white horizontal bar with an orange line in the center represents a minus symbol, indicating a zoom-out or reduce function. The handle is a light beige color, completing the clean, modern aesthetic. This graphic is perfect for representing concepts related to search, analysis, reduction, or digital interface controls.
Free with trial Broken 3D bar chart highlighting severe financial losses and business downturn. Overview decrease illustrations Broken 3D Bar Chart Indicating Significant Business Financial Losses and Performance Decline. Broken 3D bar chart highlighting severe financial losses and business downturn
Free with trial Bar chart and line graph showing financial data and trends. Generative AI. Overview decrease illustrations Bar chart and line graph showing financial data and trends
Free with trial Chsales data charts illustration company year, color coded, categories month chsales data charts. Overview decrease illustrations Chsales data charts
Free with trial A 3D icon depicting a hand performing a pinch-to-zoom gesture, with two fingers moving closer together. This symbolizes the action of zooming in on an image or content. The playful design uses vibrant colors and simple shapes to evoke a sense of magnification and detail. Perfect for applications related to image viewing, navigation, or zooming in on content. Overview decrease vectors Zoom In Gesture 3D Icon Illustration. A 3D icon depicting a hand performing a pinch-to-zoom gesture, with two fingers moving closer together. This symbolizes the action of zooming in on an image or content. The playful design uses vibrant colors and simple shapes to evoke a sense of magnification and detail. Perfect for applications related to image viewing, navigation, or zooming in on content.
Free with trial Simple graphic of a magnifying glass with a minus sign inside, representing zooming out or reducing search scope. Clean and modern design. Overview decrease vectors Magnifying glass zoom out icon with minus symbol for search. Simple graphic of a magnifying glass with a minus sign inside, representing zooming out or reducing search scope. Clean and modern design
Free with trial Line chart showing a downward trend with an arrow, inside a circle. Overview decrease vectors Line chart showing a downward trend with an arrow, inside a circle
Free with trial The image presents a colorful bar graph with a downward trending line, symbolizing a decline in performance or an economic downturn on a white background. Overview decrease vectors Vector art of colorful bar graph with a downward trending line, indicating a decline in performance or economic downturn. The image presents a colorful bar graph with a downward trending line, symbolizing a decline in performance or an economic downturn on a white background
Free with trial This image represents a declining global economy with a dramatic drop in financial performance illustrated by a bright blue arrow pointing downwards. Overview decrease illustrations Global economic downturn with financial chart on world map background. This image represents a declining global economy with a dramatic drop in financial performance illustrated by a bright blue arrow pointing downwards
Free with trial Colorful infographic d "BundenigS" illustrating financial concepts like savings, budgeting, investments, and financial statements, using simple icons. Overview decrease illustrations Colorful infographic d \'BundenigS\' illustrating financial concep. Colorful infographic d "BundenigS" illustrating financial concepts like savings, budgeting, investments, and financial statements, using simple icons .
Free with trial Pencil draws diagram with line going down on checkered paper. Falling graph, business decline concept. Investment risk. Market crash, financial loss. Crisis analysis, business strategy. Overview decrease illustrations Pencil draws diagram with line going down on checkered paper. Falling graph, business decline concept. Investment risk. Market
Free with trial Black and white vector illustration of a magnifying glass with a minus sign, signifying a zoom out or remove search function. Overview decrease vectors Search minus icon vector, magnifying glass with minus sign representing zoom out. Black and white vector illustration of a magnifying glass with a minus sign, signifying a zoom out or remove search function
Free with trial This 3D illustration depicts a financial report represented by a document with a bar chart and a line graph. The bar chart shows alternating red and blue bars, while a blue line graph with an upward arrow indicates a positive trend. A yellow and purple magnifying glass is positioned over the chart, suggesting analysis and scrutiny. The artwork is set against a subtle light purple background. Overview decrease illustrations 3D illustration of a financial report with a magnifying glass and bar chart on a light purple background. This 3D illustration depicts a financial report represented by a document with a bar chart and a line graph. The bar chart shows alternating red and blue bars, while a blue line graph with an upward arrow indicates a positive trend. A yellow and purple magnifying glass is positioned over the chart, suggesting analysis and scrutiny. The artwork is set against a subtle light purple background
Free with trial Nine flat design icons depict various data charts and graphs in muted blue and teal tones. Overview decrease vectors Collection of nine flat design data charts and graphs analysis statistics. Nine flat design icons depict various data charts and graphs in muted blue and teal tones.
Free with trial Vibrant Business Data Visualization Highlighting Market Trends and Financial Metrics. Generative AI. Overview decrease illustrations Vibrant Business Data Visualization Highlighting Market Trends and Financial Metrics
Free with trial This is a simple line drawing illustration of a graph that features an arrow pointing downward prominently. It conveys a particular trend or direction. Overview decrease vectors A simple line drawing shows a graph with a downward arrow. This is a simple line drawing illustration of a graph that features an arrow pointing downward prominently. It conveys a particular trend or direction
Free with trial Declining Graph With Arrow Cursor Line Icon. Economic Downturn, Market Analysis, And Financial Decline Outline Symbol. Business Performance Tracking. Editable Stroke. Isolated Vector Illustration. Overview decrease vectors Declining Graph With Arrow Cursor Line Icon. Economic Downturn, Market Analysis, And Financial Decline Outline Symbol
Free with trial Colorful bar chart analysis: growth, trends, and data visualization on a wooden table ,Generative ai. Overview decrease illustrations Colorful bar chart data analysis, visualizing growth trends and performance on a wooden table. Colorful bar chart analysis: growth, trends, and data visualization on a wooden table ,Generative ai
Free with trial A simple line drawing illustration depicting a graph that features a prominent arrow pointing directly downward, indicating a downward trend or movement. Overview decrease vectors A line drawing illustrating a graph with an arrow downward. A simple line drawing illustration depicting a graph that features a prominent arrow pointing directly downward, indicating a downward trend or movement
Free with trial This compelling financial chart vividly illustrates a concerning downward trend in the stock market. The blue grid provides a backdrop for the crucial data visualization, highlighting the negative movement indicated by a prominent red downward arrow. This visual representation underscores the potential for a market crash, prompting investors to carefully analyze market indicators and adjust. Overview decrease illustrations Analyzing a Declining Stock Market Trend Blue Grid Financial Chart Signals a Potential Market Crash. This compelling financial chart vividly illustrates a concerning downward trend in the stock market. The blue grid provides a backdrop for the crucial data visualization, highlighting the negative movement indicated by a prominent red downward arrow. This visual representation underscores the potential for a market crash, prompting investors to carefully analyze market indicators and adjust
Free with trial Pink bar chart report on wooden table displaying progress data analysis ,Generative ai. Overview decrease illustrations Pink bar chart report displaying progress data analysis on wooden table for business insights. Pink bar chart report on wooden table displaying progress data analysis ,Generative ai
Free with trial The image presents a comprehensive display of weekly trends through multiple graphs and charts. It features line graphs, bar charts, and other visual representations of data, each highlighting different aspects of trends and statistics. The use of various colors, including green, red, and blue, against a dark background with white text enhances the visual appeal and facilitates easy comprehension. This image was generated using artificial intelligence. Overview decrease illustrations A collection of graphs and charts showcasing various weekly trends and statistics in a visually engaging format with multiple. The image presents a comprehensive display of weekly trends through multiple graphs and charts. It features line graphs, bar charts, and other visual representations of data, each highlighting different aspects of trends and statistics. The use of various colors, including green, red, and blue, against a dark background with white text enhances the visual appeal and facilitates easy comprehension. This image was generated using artificial intelligence.
Free with trial This striking visual depicts a steep downturn in data, signifying negative trends and potential instability within the economic landscape. Overview decrease illustrations Dramatic red arrow pointing downward on financial chart representing market decline and economic loss. This striking visual depicts a steep downturn in data, signifying negative trends and potential instability within the economic landscape
Free with trial A magnifying glass hovers over a grid paper background displaying two line graphs, one red and one blue. The red graph a general upward trend with several peaks and valleys, while the blue graph a downward trend. The magnifying glass focuses on a prominent red upward arrow within the red graph, highlighting an increase. Overview decrease illustrations Magnifying glass over red and blue upward and downward trending graphs on grid paper chart data analysis. A magnifying glass hovers over a grid paper background. A magnifying glass hovers over a grid paper background displaying two line graphs, one red and one blue. The red graph a general upward trend with several peaks and valleys, while the blue graph a downward trend. The magnifying glass focuses on a prominent red upward arrow within the red graph, highlighting an increase
Free with trial Neobrutalism infographic design for presenting marketing and business data percentages. Minimalistic graphics with decorative elements creates an engaging and informative layout. Overview decrease vectors Neobrutalism infographic design for presenting marketing and business data percentages. Minimalistic graphics with
Free with trial Business analytics, data visualization, market research, financial reports, and growth strategies are symbolized in this image. Elegant empty space crafted for branding, ads, and product presentations. Suitable for marketing campaigns and creative displays. . Generative AI. Overview decrease illustrations Colorful Data Charts and Graphs on White Background Business analytics data visualization market research financial reports. Business analytics, data visualization, market research, financial reports, and growth strategies are symbolized in this image. Elegant empty space crafted for branding, ads, and product presentations. Suitable for marketing campaigns and creative displays. . Generative AI
Free with trial This image displays financial performance indicators, highlighting data trends and market volatility. It represents economic analysis and strategic decision-making processes. Overview decrease vectors Vector art of financial performance indicators, showcasing data trends, market volatility, and economic analysis for strategic. This image displays financial performance indicators, highlighting data trends and market volatility. It represents economic analysis and strategic decision-making processes
Free with trial Flat Design Illustration of NPL Risk Analysis with Declining Bar Chart, Highlighting Financial Trends and Risks. Ideal. Overview decrease illustrations Flat Design Illustration of NPL Risk Analysis with Declining Bar Chart, Highlighting Financial Trends and Risks. Ideal
Free with trial Dynamic chart displaying a downward trend with red lines, illustrating financial decline or market volatility, Generative AI. Overview decrease illustrations Dynamic chart displaying a downward trend with red lines, illustrating financial decline or market volatility
Free with trial A simple line chart illustrates a decreasing trend with distinct dot markers representing data points. The design emphasizes the shift in values over time and aids in visualizing performance. Overview decrease vectors Chart Displaying a Downward Trend in Data Analysis. A simple line chart illustrates a decreasing trend with distinct dot markers representing data points. The design emphasizes the shift in values over time and aids in visualizing performance.
Free with trial Graph table graphs illustration data variables, time precision, connection interpret graph table graphs. Overview decrease illustrations Graph table graphs
Free with trial Fluctuations red graph illustration business meeting, computer analysis, trends presentation fluctuations red graph. Overview decrease illustrations Fluctuations red graph
Free with trial Decline food sales data illustration fruits vegetables, items year, trend analysis decline food sales data. Overview decrease illustrations Decline food sales data
Free with trial Trends blinking sales graph illustration data visualization, performance revenue, metrics dashboard trends blinking sales graph. Overview decrease illustrations Trends blinking sales graph
Free with trial Growth layering revenue chart illustration profit income, forecast trends, metrics visualization growth layering revenue chart. Overview decrease illustrations Growth layering revenue chart
Free with trial Chdata replicating revenue chart illustration analysis growth, sales profit, trends visualization chdata replicating revenue chart. Overview decrease illustrations Chdata replicating revenue chart
Free with trial Analysis dissolving revenue chart illustration data trends, visualization metrics, performance financials analysis dissolving revenue chart. Overview decrease illustrations Analysis dissolving revenue chart
Free with trial This image shows a rolled-up graph with a red line depicting a downturn, generated by AI. It visually represents a negative trend or decline in data, potentially illustrating economic recession, market loss, or other negative statistical trends. The clean design allows for easy visualization of the. Overview decrease illustrations Declining Graph Report. This image shows a rolled-up graph with a red line depicting a downturn, generated by AI. It visually represents a negative trend or decline in data, potentially illustrating economic recession, market loss, or other negative statistical trends. The clean design allows for easy visualization of the
Free with trial Data merging sales graph illustration analysis trends, revenue performance, forecast comparison data merging sales graph. Overview decrease illustrations Data merging sales graph
Free with trial Chdissolve dissolving revenue chart illustration analysis data, trends visualization, metrics performance chdissolve dissolving revenue chart. Overview decrease illustrations Chdissolve dissolving revenue chart
Free with trial Data loading sales graph illustration analytics visualization, performance trends, metrics dashboard data loading sales graph. Overview decrease illustrations Data loading sales graph
Free with trial Bar graphs data illustration company year, color performance, categories trend bar graphs data. Overview decrease illustrations Bar graphs data
Free with trial Growth scanning revenue chart illustration decline forecast, data performance, metrics visualization growth scanning revenue chart. Overview decrease illustrations Growth scanning revenue chart
Free with trial A 3D rendering showing stacks of coins under a magnifying glass focusing on a bar graph, generated by AI. This image symbolizes financial analysis, investment, and wealth management. It's perfect for illustrating articles or presentations related to economic trends and monetary growth. Overview decrease illustrations Financial Analysis Magnifier. A 3D rendering showing stacks of coins under a magnifying glass focusing on a bar graph, generated by AI. This image symbolizes financial analysis, investment, and wealth management. It's perfect for illustrating articles or presentations related to economic trends and monetary growth.
Free with trial A tablet displays a colorful bar graph, showcasing data trends. The image emphasizes visual data analysis and modern business tools. The warm wood background adds a professional yet inviting feel. Overview decrease illustrations Tablet Showing Business Graph. A tablet displays a colorful bar graph, showcasing data trends. The image emphasizes visual data analysis and modern business tools. The warm wood background adds a professional yet inviting feel.
Free with trial A financial chart showing declining index lines in blue shades on a grid-style white background. Concept of market analysis and trends. 3D Rendering. Overview decrease illustrations Financial chart with declining index lines on grid background. 3D Rendering. A financial chart showing declining index lines in blue shades on a grid-style white background. Concept of market analysis and trends. 3D Rendering
Free with trial Visualization blinking sales graph illustration performance revenue, metrics dashboard, insights forecast visualization blinking sales graph. Overview decrease illustrations Visualization blinking sales graph
Free with trial Financial chart with golden downward arrow, statistical data, numbers in focus, white background. Concept of economic decline. 3D Rendering. Overview decrease illustrations Financial chart with downward trend and arrow on light background. 3D Rendering. Financial chart with golden downward arrow, statistical data, numbers in focus, white background. Concept of economic decline. 3D Rendering
Free with trial A green downward trending stock chart is displayed on an orange grid, suggesting a negative financial trend for analysis. Overview decrease illustrations Green Stock Chart with Orange Grid. A green downward trending stock chart is displayed on an orange grid, suggesting a negative financial trend for analysis
Free with trial A clean, minimalist bar chart illustration set against a solid green background. The chart features three white vertical bars of different heights, representing data points or progress over time. A simple white grid and axes are visible, indicating a clear visual representation of statistics. This versatile graphic is ideal for conveying concepts of business growth, financial analysis, market trends, statistical reporting, or educational content in a modern, easy-to-understand format. Perfect for presentations, infographics, websites, and applications. Overview decrease vectors Minimalist Bar Chart Icon on Green Background. A clean, minimalist bar chart illustration set against a solid green background. The chart features three white vertical bars of different heights, representing data points or progress over time. A simple white grid and axes are visible, indicating a clear visual representation of statistics. This versatile graphic is ideal for conveying concepts of business growth, financial analysis, market trends, statistical reporting, or educational content in a modern, easy-to-understand format. Perfect for presentations, infographics, websites, and applications.
Free with trial A vibrant collection of hand-drawn business charts and graphs, rendered in shades of blue with a sketch-like aesthetic. The set includes various types of visualizations like bar charts, line graphs, pie charts, and donut charts, representing data, growth, and analysis. This versatile illustration is perfect for presentations, reports, infographics, and any project requiring a visual representation of financial or statistical information with a creative, hand-crafted feel. Overview decrease illustrations Hand-Drawn Business Charts and Graphs Collection. A vibrant collection of hand-drawn business charts and graphs, rendered in shades of blue with a sketch-like aesthetic. The set includes various types of visualizations like bar charts, line graphs, pie charts, and donut charts, representing data, growth, and analysis. This versatile illustration is perfect for presentations, reports, infographics, and any project requiring a visual representation of financial or statistical information with a creative, hand-crafted feel.
Free with trial Red graph overlayed on cityscape background showing market downturn. Overview decrease illustrations Red graph overlayed on cityscape background showing market downturn.
Free with trial Chart showing downward trend with red nodes, sad face, recovery checkmark, warning alerts, and webpage visuals. Ideal for finance, business, analysis, recovery strategy monitoring evaluation. Overview decrease illustrations Negative Market Trends and Analytics with Recovery Progress Indicators. Chart showing downward trend with red nodes, sad face, recovery checkmark, warning alerts, and webpage visuals. Ideal for finance, business, analysis, recovery strategy monitoring evaluation
Free with trial Concept Abstract Art, Blue Watercolor, Financial Growth, Chart, Abstract Design Abstract Blue Watercolor Financial Growth Chart. Overview decrease illustrations Abstract Blue Watercolor Financial Growth Chart. Concept Abstract Art, Blue Watercolor, Financial. Concept Abstract Art, Blue Watercolor, Financial Growth, Chart, Abstract Design Abstract Blue Watercolor Financial Growth Chart
Free with trial A large red arrow points downwards on a green field with a city skyline in the background, often used to depict economic downturn or negative trends. Overview decrease illustrations Red Arrow Pointing Down on Grass Field with City Skyline. A large red arrow points downwards on a green field with a city skyline in the background, often used to depict economic downturn or negative trends
Free with trial Open laptop showing line chart, bar chart, and trend analysis with arrow indicating sales decline. Ideal for analytics, e-commerce, business strategy, financial forecasting, market analysis, sales. Overview decrease vectors Laptop screen displaying charts, analytics, and sale trend with downward arrow. Open laptop showing line chart, bar chart, and trend analysis with arrow indicating sales decline. Ideal for analytics, e-commerce, business strategy, financial forecasting, market analysis, sales
Free with trial Downward trend graph with data points, sad face icon, and user profile silhouette. Ideal for business, economy, performance, analytics, customer satisfaction, decision-making simple flat metaphor. Overview decrease vectors Declining Business Performance Represented by Graph, Sad Face, and User Profile. Downward trend graph with data points, sad face icon, and user profile silhouette. Ideal for business, economy, performance, analytics, customer satisfaction, decision-making simple flat metaphor
Free with trial Magnifying glass focuses on a graphic pie chart over document, highlighting trends and potential insights Use for data analysis and business concept. Overview decrease illustrations Analyzing Graphic Pie Chart with Magnifying Glass for Insights. Magnifying glass focuses on a graphic pie chart over document, highlighting trends and potential insights Use for data analysis and business concept
Free with trial The image showcases a sophisticated data visualization dashboard presenting global information via interactive maps, charts, and graphs. Overview decrease illustrations Global Data Visualization Dashboard Displays Complex Information. The image showcases a sophisticated data visualization dashboard presenting global information via interactive maps, charts, and graphs
Free with trial A clean and modern set of financial icons, perfect for illustrating business concepts. The image features icons representing profit growth, expense management, tax documents, and investment summaries. The illustrations use a simple, flat design with a limited color palette, making them versatile for various applications. Ideal for presentations, websites, infographics, and financial reports. The set highlights key financial aspects in an easily understandable visual format. Overview decrease illustrations Financial Icons Set: Profit, Expenses, Tax, and Investment Analysis. A clean and modern set of financial icons, perfect for illustrating business concepts. The image features icons representing profit growth, expense management, tax documents, and investment summaries. The illustrations use a simple, flat design with a limited color palette, making them versatile for various applications. Ideal for presentations, websites, infographics, and financial reports. The set highlights key financial aspects in an easily understandable visual format.
Free with trial Downward blue arrow paired with stacked coins and musical notes representing revenue decline in music. Ideal for economics, music pricing, financial loss, digital sales, charts, trends, simple flat. Overview decrease vectors Declining Trend in Music Revenue Represented by Arrow, Money Coins, and Musical Notes. Downward blue arrow paired with stacked coins and musical notes representing revenue decline in music. Ideal for economics, music pricing, financial loss, digital sales, charts, trends, simple flat
Free with trial Glowing Candlestick Chart Depicting Downward Trend in Market Generative AI Illustration. Overview decrease illustrations Glowing Candlestick Chart Depicting Downward Trend in Market
Free with trial Glowing Candlestick Chart Depicting Downward Trend in Market Generative AI Illustration. Overview decrease illustrations Glowing Candlestick Chart Depicting Downward Trend in Market
Free with trial A modern, clean isometric illustration showcasing various data visualizations. Multiple charts and graphs, including bar charts, line graphs, and pie charts, are displayed on floating screens, representing data analysis, business intelligence, or financial reporting. Ideal for presentations, reports, or website banners related to data-driven concepts. Overview decrease illustrations Isometric 3D Data Visualization: Charts and Graphs on Floating Screens. A modern, clean isometric illustration showcasing various data visualizations. Multiple charts and graphs, including bar charts, line graphs, and pie charts, are displayed on floating screens, representing data analysis, business intelligence, or financial reporting. Ideal for presentations, reports, or website banners related to data-driven concepts.
Free with trial A close-up view of a financial bar and line graph with a pen resting on it, indicating analysis and financial data. Overview decrease illustrations Close-up of a financial graph with bars and line chart and a pen business data. A close-up view of a financial bar and line graph with a pen resting on it, indicating analysis and financial data
Free with trial Up and down arrows with digital dashboard and analytics graph. Ideal for workflow, analysis, progress monitoring, performance, business strategy, reporting, simple flat metaphor. Overview decrease vectors Data Analysis with Interactive Dashboard, Graphs, and Performance Trends in Business Workflow. Up and down arrows with digital dashboard and analytics graph. Ideal for workflow, analysis, progress monitoring, performance, business strategy, reporting, simple flat metaphor
Free with trial Comprehensive data visualization with global charts and interactive graphs. Overview decrease illustrations Comprehensive data visualization with global charts and interactive graphs
Free with trial Vector icons showing business growth and decline trends with arrows and magnifying glass for detailed analysis, representing financial and market data in a clear style. Professional and informative. Generative AI. Overview decrease vectors Business growth and decline infographic icons with arrows and magnifying glass for analysis. Vector icons showing business growth and decline trends with arrows and magnifying glass for detailed analysis, representing financial and market data in a clear style. Professional and informative. Generative AI
Free with trial Tablet displays a declining graph, reflecting downturns. A dark world map serves as the backdrop, emphasizing global impact. This visualization symbolizes economic changes. The image is. Overview decrease illustrations Global Decline Displayed on Tablet with World Map Background in Dim Lighting. Tablet displays a declining graph, reflecting downturns. A dark world map serves as the backdrop, emphasizing global impact. This visualization symbolizes economic changes. The image is
Free with trial Hand drawn bar chart sketch with ascending and descending data patterns. Overview decrease vectors Hand drawn bar chart sketch with ascending and descending data patterns, AI Generative. Hand drawn bar chart sketch with ascending and descending data patterns.
Free with trial Calculator with purple screen, upward-trending performance graph, and downward arrow. Ideal for finance, accounting, budgeting, data analysis, cost reduction, investment strategy simple flat. Overview decrease vectors Financial calculation with a calculator, performance graph, and downward arrow for data analysis. Calculator with purple screen, upward-trending performance graph, and downward arrow. Ideal for finance, accounting, budgeting, data analysis, cost reduction, investment strategy simple flat
Free with trial Colorful bar chart on a blue background illustrating data trends ,Generative ai. Overview decrease illustrations Vibrant bar chart on blue background, visualizing data trends and insights colorful. Colorful bar chart on a blue background illustrating data trends ,Generative ai
Free with trial Green magnifying glass with minus symbol for zoom out function in flat design style. Overview decrease vectors Green magnifying glass with minus symbol for zoom out function in flat design style
Free with trial A downward trending bar graph in shades of blue, illustrating a financial decline with sleek, minimalistic lines and a clear visual impact. Generative AI. Overview decrease vectors Downward trending bar graph in flat design style showcasing financial decline vector illustration. A downward trending bar graph in shades of blue, illustrating a financial decline with sleek, minimalistic lines and a clear visual impact. Generative AI
Free with trial Red bar chart displays performance metrics on a table ,Generative ai. Overview decrease illustrations Red bar chart illustrating performance metrics on a table, data analysis and visualization. Red bar chart displays performance metrics on a table ,Generative ai
Free with trial Declining chart icon. Downward trend symbol. Falling graph illustration. Simple vector design. EPS 10. Overview decrease vectors Declining chart icon. Downward trend symbol. Falling graph illustration. Simple vector design.