Free with trial Geometric Data patterns - Technology background. 3D Illustration. Patterns visualization illustrations Data Stream Visualization. Geometric Data patterns - Technology background. 3D Illustration
Free with trial Blue-gold agate imitation in epoxy resin with fluid wavy patterns. Visualization of natural mineral structures with rich color palette. Patterns visualization illustrations Blue-gold agate imitation in epoxy resin with fluid wavy patterns. Visualization of natural mineral structures with rich color
Free with trial Set of cornices and friezes isolated on white background. 3D visualization of gypsum stucco. Seamless texture of classic white plinth. Patterns visualization vectors Set of cornices and friezes isolated on white background. 3D visualization of gypsum stucco. Seamless texture of classic white pli
Free with trial Abstract macro photography glass crystals. Patterns visualization illustrations Abstract patterns. Abstract macro photography glass crystals
Free with trial Set of 2 Seamless Vintage Patterns (Vector). Colored Design. Hand Drawn Tile Texture, Ethnic Ornament. Patterns visualization vectors Set of 2 Seamless Vintage Patterns (Vector)
Free with trial This image depicts the Earth with a focus on its ocean currents and surface patterns. The visualization highlights the movement of water across the planet, particularly emphasizing the major ocean gyres and currents that circulate around the globe. The blue and green hues represent different intensities and directions of oceanic flow, illustrating the interconnectedness of the world's oceans and. Patterns visualization illustrations Visualization of global ocean currents and surface patterns on earth. This image depicts the Earth with a focus on its ocean currents and surface patterns. The visualization highlights the movement of water across the planet, particularly emphasizing the major ocean gyres and currents that circulate around the globe. The blue and green hues represent different intensities and directions of oceanic flow, illustrating the interconnectedness of the world's oceans and
Free with trial Set of 2 Seamless Vintage Patterns (Vector). Black and White Design. Hand Drawn Tile Texture, Ethnic Ornament. Patterns visualization vectors Set of 2 Seamless Vintage Patterns (Vector)
Free with trial Set of 2 Seamless Vintage Patterns (Vector). Colored Design. Hand Drawn Tile Texture, Ethnic Ornament. Patterns visualization vectors Set of 2 Seamless Vintage Patterns (Vector)
Free with trial Set of 3 Seamless Vintage Patterns (Vector). Black and White Design. Hand Drawn Tile Texture, Ethnic Ornament. Patterns visualization vectors Set of 3 Seamless Vintage Patterns (Vector)
Free with trial The image displays a heatmap representing data density and clustering patterns. The visualization uses a gradient color scale, transitioning from cool grays to warm yellows and reds, indicating varying intensities or frequencies within the dataset. The densest regions appear in bright yellow and red, suggesting areas of high concentration, while lighter shades and grays show lower density or. Patterns visualization illustrations Heatmap visualization of clustered data patterns and density. The image displays a heatmap representing data density and clustering patterns. The visualization uses a gradient color scale, transitioning from cool grays to warm yellows and reds, indicating varying intensities or frequencies within the dataset. The densest regions appear in bright yellow and red, suggesting areas of high concentration, while lighter shades and grays show lower density or
Free with trial Stained Glass Forever series. Interplay of human profiles, abstract organic patterns and colors on the subject of art, creativity, imagination, internal reality and unity of men and Nature. Patterns visualization illustrations Patterns Without End. Stained Glass Forever series. Interplay of human profiles, abstract organic patterns and colors on the subject of art, creativity, imagination, internal reality and unity of men and Nature.
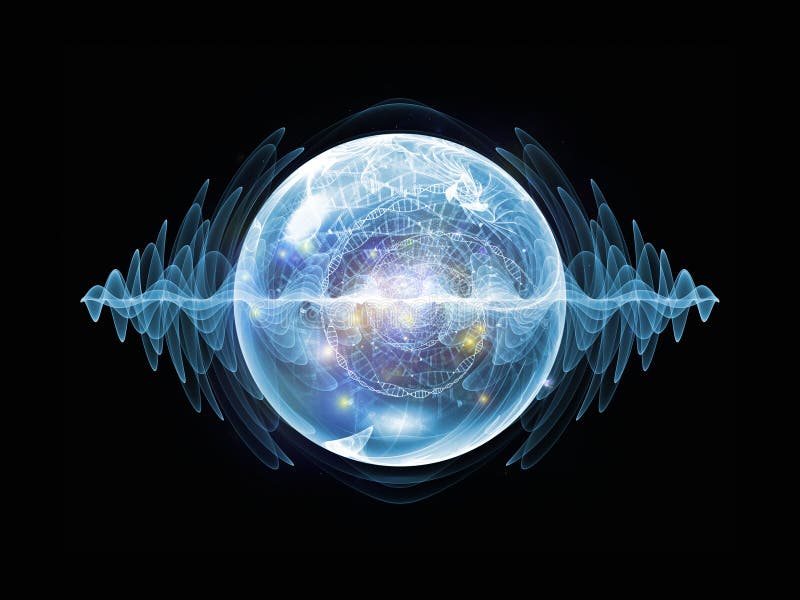
Free with trial Wave Particle series. Composition of fractal spherical patterns and conceptual elements suitable as a backdrop for the projects on science, technology, spirituality and design. Patterns visualization illustrations Visualization of Wave Particle. Wave Particle series. Composition of fractal spherical patterns and conceptual elements suitable as a backdrop for the projects on science, technology, spirituality and design
Free with trial Stained Glass Forever series. Interplay of human profiles, abstract organic patterns and colors on the subject of art, creativity, imagination, internal reality and unity of men and Nature. Patterns visualization illustrations Patterns Without End. Stained Glass Forever series. Interplay of human profiles, abstract organic patterns and colors on the subject of art, creativity, imagination, internal reality and unity of men and Nature.
Free with trial Big data concept. Scientists access, analyze, process and visualize data. They searching for patterns and trends for efficient business planning. Isometric outline illustration for web banners, hero images, printed materials. Patterns visualization vectors Big Data Isometric Outline Illustration. Big data concept. Scientists access, analyze, process and visualize data. They searching for patterns and trends for efficient business planning. Isometric outline illustration for web banners, hero images, printed materials
Free with trial Abstract texture of Credit Card Numbers,used as background. Patterns visualization illustrations Abstract texture of Credit Card
Free with trial Stained Glass Forever series. Composition of color fragments, shape patterns and symbols for projects on art, space division and design. Patterns visualization illustrations Unfolding of Color Division. Stained Glass Forever series. Composition of color fragments, shape patterns and symbols for projects on art, space division and design
Free with trial The image displays a highly abstract and colorful representation of clustered data points, likely generated through a computational or machine learning process. It features overlapping and intertwined regions in various colors such as pink, yellow, green, purple, and blue, with some areas showing concentric circular patterns. The visualization appears to map complex relationships or distributions. Patterns visualization illustrations Abstract visualization of data clusters with color-coded regions and patterns. The image displays a highly abstract and colorful representation of clustered data points, likely generated through a computational or machine learning process. It features overlapping and intertwined regions in various colors such as pink, yellow, green, purple, and blue, with some areas showing concentric circular patterns. The visualization appears to map complex relationships or distributions
Free with trial Wave Particle series. Design composed of fractal spherical patterns and conceptual elements as a metaphor on the subject of science, technology, spirituality and design. Patterns visualization illustrations Energy of Wave Particle. Wave Particle series. Design composed of fractal spherical patterns and conceptual elements as a metaphor on the subject of science, technology, spirituality and design
Free with trial Design composed of girl profile, colorful fractal butterfly patterns and abstract lights on the subject of beauty, creativity and imagination. Patterns visualization illustrations Flight of Butterfly Girl. Design composed of girl profile, colorful fractal butterfly patterns and abstract lights on the subject of beauty, creativity and imagination
Free with trial Wave Particle series. Composition of fractal spherical patterns and conceptual elements on the subject of science, technology, spirituality and design. Patterns visualization illustrations Glow of Wave Particle. Wave Particle series. Composition of fractal spherical patterns and conceptual elements on the subject of science, technology, spirituality and design
Free with trial This image depicts a stylized representation of Earth covered entirely in dense green vegetation. The depiction emphasizes the planet's landmasses, with continents like Africa, Europe, Asia, and the Americas clearly distinguishable by their unique shapes and vegetation patterns. The visualization highlights the idea of a fully vegetated Earth, showcasing nature's potential coverage if all land. Patterns visualization illustrations A lush green planet showcasing earth\'s vegetation from a global perspective. This image depicts a stylized representation of Earth covered entirely in dense green vegetation. The depiction emphasizes the planet's landmasses, with continents like Africa, Europe, Asia, and the Americas clearly distinguishable by their unique shapes and vegetation patterns. The visualization highlights the idea of a fully vegetated Earth, showcasing nature's potential coverage if all land
Free with trial Stained Glass Forever series. Human profiles with sacred geometry circles drawn with organic patterns on the subject of mind, knowledge, mysticism and unity of Nature. Patterns visualization illustrations Inner Wisdom. Stained Glass Forever series. Human profiles with sacred geometry circles drawn with organic patterns on the subject of mind, knowledge, mysticism and unity of Nature.
Free with trial Stained Glass Forever series. Overlapping human profiles, mask, butterfly, lizard and key symbols drawn with organic patterns on the subject of mind, mental health, unity and intuition. Patterns visualization illustrations Unmasking Self. Stained Glass Forever series. Overlapping human profiles, mask, butterfly, lizard and key symbols drawn with organic patterns on the subject of mind, mental health, unity and intuition.
Free with trial Wave Particle series. Artistic background made of fractal spherical patterns and conceptual elements for use with projects on science, technology, spirituality and design. Patterns visualization illustrations Evolving Wave Particle. Wave Particle series. Artistic background made of fractal spherical patterns and conceptual elements for use with projects on science, technology, spirituality and design
Free with trial This image displays a detailed representation of Earth focusing on the world's ocean currents. The map highlights the major surface currents with arrows indicating their direction and flow, predominantly in red and yellow hues. These currents are critical for climate regulation, marine ecosystems, and global weather patterns. The visualization emphasizes the interconnectedness of the world's. Patterns visualization illustrations Global map illustrating the world\'s major ocean currents and their directions. This image displays a detailed representation of Earth focusing on the world's ocean currents. The map highlights the major surface currents with arrows indicating their direction and flow, predominantly in red and yellow hues. These currents are critical for climate regulation, marine ecosystems, and global weather patterns. The visualization emphasizes the interconnectedness of the world's
Free with trial Wave Particle series. Design made of fractal spherical patterns and conceptual elements to serve as backdrop for projects related to science, technology, spirituality and design. Patterns visualization illustrations Magic of Wave Particle. Wave Particle series. Design made of fractal spherical patterns and conceptual elements to serve as backdrop for projects related to science, technology, spirituality and design
Free with trial Stained Glass Forever series. Male, female and child head profiles drawn with organic patterns signifying dialog, communication, education and knowledge. Patterns visualization illustrations Paradigms of Understanding. Stained Glass Forever series. Male, female and child head profiles drawn with organic patterns signifying dialog, communication, education and knowledge.
Free with trial Stained Glass Forever series. Male, female and child head profiles drawn with organic patterns signifying dialog, communication, education and knowledge. Patterns visualization illustrations Paradigms of Understanding. Stained Glass Forever series. Male, female and child head profiles drawn with organic patterns signifying dialog, communication, education and knowledge.
Free with trial Wave Particle series. Artistic abstraction composed of fractal spherical patterns and conceptual elements on the subject of science, technology, spirituality and design. Patterns visualization illustrations Conceptual Wave Particle. Wave Particle series. Artistic abstraction composed of fractal spherical patterns and conceptual elements on the subject of science, technology, spirituality and design
Free with trial Stained Glass Forever series. Human profiles with sacred geometry circles drawn with organic patterns on the subject of mind, knowledge, mysticism and unity of Nature. Patterns visualization illustrations Inner Wisdom. Stained Glass Forever series. Human profiles with sacred geometry circles drawn with organic patterns on the subject of mind, knowledge, mysticism and unity of Nature.
Free with trial Stained Glass Forever series. Lover`s heads looking up, amidst colorful patterns and symbols of the Universe on the subject of education, knowledge and mutual unity. Patterns visualization illustrations Our Universes. Stained Glass Forever series. Lover`s heads looking up, amidst colorful patterns and symbols of the Universe on the subject of education, knowledge and mutual unity.
Free with trial This image presents a three-dimensional view of Earth, highlighting the distribution of continents, oceans, and atmospheric cloud patterns. The visualization emphasizes the blue hues of the oceans, the varied colors of landmasses, and the dynamic, swirling clouds that cover parts of the globe. The depiction captures the planet's natural beauty and complexity, providing a comprehensive look at its. Patterns visualization illustrations A detailed depiction of earth showcasing its landmasses, oceans, and cloud formations. This image presents a three-dimensional view of Earth, highlighting the distribution of continents, oceans, and atmospheric cloud patterns. The visualization emphasizes the blue hues of the oceans, the varied colors of landmasses, and the dynamic, swirling clouds that cover parts of the globe. The depiction captures the planet's natural beauty and complexity, providing a comprehensive look at its
Free with trial Connected World series. Backdrop of network diagrams , hi-tech symbols and fractal patterns on the subject of modern technology, education and computer communications. Patterns visualization illustrations Magic of Data Flow. Connected World series. Backdrop of network diagrams , hi-tech symbols and fractal patterns on the subject of modern technology, education and computer communications
Free with trial Wave Particle series. Composition of fractal spherical patterns and conceptual elements suitable as a backdrop for the projects on science, technology, spirituality and design. Patterns visualization illustrations Visualization of Wave Particle. Wave Particle series. Composition of fractal spherical patterns and conceptual elements suitable as a backdrop for the projects on science, technology, spirituality and design
Free with trial Design composed of player controls, perspective fractal grids, lights, wave and sine patterns as a metaphor on the subject of music, sound processing, audio performance and entertainment. Patterns visualization illustrations Energy of music. Design composed of player controls, perspective fractal grids, lights, wave and sine patterns as a metaphor on the subject of music, sound processing, audio performance and entertainment
Free with trial Shards of Paint series. Visually attractive backdrop made of color patterns and shapes suitable in layouts on art, education and design. Patterns visualization illustrations Game of Hues. Shards of Paint series. Visually attractive backdrop made of color patterns and shapes suitable in layouts on art, education and design
Free with trial Stained Glass Forever series. Human profiles with autumn lea? and butterfly drawn with organic patterns on the subject of love, relationships and Unity with Nature. Patterns visualization illustrations Love of Beauty. Stained Glass Forever series. Human profiles with autumn lea? and butterfly drawn with organic patterns on the subject of love, relationships and Unity with Nature.
Free with trial Wave Particle series. Design made of fractal spherical patterns and conceptual elements to serve as backdrop for projects related to science, technology, spirituality and design. Patterns visualization illustrations Magic of Wave Particle. Wave Particle series. Design made of fractal spherical patterns and conceptual elements to serve as backdrop for projects related to science, technology, spirituality and design
Free with trial The image displays nine distinct clusters of abstract geometric patterns resembling starburst shapes with varying densities and color gradients. Each cluster is formed by numerous small dots, creating a sense of movement and dynamism. The colors range from purple and blue to peach and pink, giving the visualization a vibrant yet structured appearance. This type of graphical representation is often. Patterns visualization illustrations Scattered abstract clusters of colorful geometric patterns and data points visualization. The image displays nine distinct clusters of abstract geometric patterns resembling starburst shapes with varying densities and color gradients. Each cluster is formed by numerous small dots, creating a sense of movement and dynamism. The colors range from purple and blue to peach and pink, giving the visualization a vibrant yet structured appearance. This type of graphical representation is often
Free with trial Who Are We series. Arrangement of surreal human portrait, fractal and mathematical patterns on the subject of philosophy, religion, math, science, technology and education. Patterns visualization illustrations Illusion of Understanding. Who Are We series. Arrangement of surreal human portrait, fractal and mathematical patterns on the subject of philosophy, religion, math, science, technology and education
Free with trial Who Are We series. Graphic composition of surreal human portrait, fractal and mathematical patterns for subject of philosophy, religion, math, science, technology and education. Patterns visualization illustrations Beyond Understanding. Who Are We series. Graphic composition of surreal human portrait, fractal and mathematical patterns for subject of philosophy, religion, math, science, technology and education
Free with trial Stained Glass Forever series. Overlapping human profiles, mask, butterfly, lizard and key symbols drawn with organic patterns on the subject of mind, mental health, unity and intuition. Patterns visualization illustrations Unmasking Self. Stained Glass Forever series. Overlapping human profiles, mask, butterfly, lizard and key symbols drawn with organic patterns on the subject of mind, mental health, unity and intuition.
Free with trial Stunning 3D digital landscape featuring vibrant mesh patterns and waves. This abstract visualization represents energy and movement in technology. Patterns visualization illustrations Abstract Digital Landscape with Curved Mesh Patterns and Vibrant Color Gradient in 3D Visualization. Stunning 3D digital landscape featuring vibrant mesh patterns and waves. This abstract visualization represents energy and movement in technology
Free with trial Shards of Paint series. Backdrop design of color patterns and shapes for works on art, education and design. Patterns visualization illustrations Accidental Hues. Shards of Paint series. Backdrop design of color patterns and shapes for works on art, education and design
Free with trial Shards of Paint series. Creative arrangement of color patterns and shapes for subject of art, education and design. Patterns visualization illustrations Dreaming of Hues. Shards of Paint series. Creative arrangement of color patterns and shapes for subject of art, education and design
Free with trial Stained Glass Forever series. Soul mate heads looking up, surrounded by colorful patterns and symbols of the Universe on the subject of knowledge, internal reality and mutual unity. Patterns visualization illustrations Worlds of Another. Stained Glass Forever series. Soul mate heads looking up, surrounded by colorful patterns and symbols of the Universe on the subject of knowledge, internal reality and mutual unity.
Free with trial Explore the mesmerizing beauty of abstract colorful wave patterns with a 3D effect, suggesting sound waves or data visualization in a dark background. Patterns visualization illustrations Abstract Colorful Wave Patterns with 3D Effect Representing Sound or Data Visualization in Dark Background. Explore the mesmerizing beauty of abstract colorful wave patterns with a 3D effect, suggesting sound waves or data visualization in a dark background
Free with trial Who Are We series. Abstract design made of surreal human portrait, fractal and mathematical patterns on the subject of philosophy, religion, math, science, technology and education. Patterns visualization illustrations Paradigm of Understanding. Who Are We series. Abstract design made of surreal human portrait, fractal and mathematical patterns on the subject of philosophy, religion, math, science, technology and education
Free with trial Stained Glass Forever series. Human profiles with sacred geometry circles drawn with organic patterns on the subject of mind, knowledge, mysticism and unity of Nature. Patterns visualization illustrations Inner Wisdom. Stained Glass Forever series. Human profiles with sacred geometry circles drawn with organic patterns on the subject of mind, knowledge, mysticism and unity of Nature.
Free with trial Stained Glass Forever series. Overlapping human profiles, mask, butterfly, lizard and key symbols drawn with organic patterns on the subject of mind, mental health, unity and intuition. Patterns visualization illustrations Unmasking Self. Stained Glass Forever series. Overlapping human profiles, mask, butterfly, lizard and key symbols drawn with organic patterns on the subject of mind, mental health, unity and intuition.
Free with trial Elegant Colorful Neck Tie Featuring Detailed Patterns, Ultra Realistic 3D Visualization on Bright White Canvas. Patterns visualization illustrations Elegant Colorful Neck Tie Featuring Detailed Patterns, Ultra Realistic 3D Visualization on Bright White Canvas
Free with trial Digital Visualization of a fractal Structure. Patterns visualization illustrations Alien fractal Structure. Digital Visualization of a fractal Structure
Free with trial Fractal Swirl series. Backdrop of light and fractal geometry patterns on the subject of design, illustration of modern science and technology. Patterns visualization illustrations Realms of Radial Fractal Texture. Fractal Swirl series. Backdrop of light and fractal geometry patterns on the subject of design, illustration of modern science and technology
Free with trial Stained Glass Forever series. Abstract arrangement of color fragments, shape patterns and symbols suitable for projects on art, space division and design. Patterns visualization illustrations The Living Color Division. Stained Glass Forever series. Abstract arrangement of color fragments, shape patterns and symbols suitable for projects on art, space division and design
Free with trial This abstract image features a vibrant financial chart with golden line patterns, creating a dynamic visualization for market trends. Perfect for business. Patterns visualization illustrations Abstract Golden Trading Chart with Bright Line Patterns and Vibrant Financial Visualization in Dark Background. This abstract image features a vibrant financial chart with golden line patterns, creating a dynamic visualization for market trends. Perfect for business
Free with trial Stained Glass Forever series. Visually attractive backdrop made of color fragments, shape patterns and symbols suitable in layouts on art, space division and design. Patterns visualization illustrations Color Division Abstraction. Stained Glass Forever series. Visually attractive backdrop made of color fragments, shape patterns and symbols suitable in layouts on art, space division and design
Free with trial Fractal Swirl series. Arrangement of light and fractal geometry patterns on the subject of design, illustration of modern science and technology. Patterns visualization illustrations Virtualization of Radial Fractal Texture. Fractal Swirl series. Arrangement of light and fractal geometry patterns on the subject of design, illustration of modern science and technology
Free with trial Stained Glass Forever series. Composition of lines, shapes and color patterns suitable as a backdrop for the projects on design, creativity and imagination. Patterns visualization illustrations Evolving Shape Division. Stained Glass Forever series. Composition of lines, shapes and color patterns suitable as a backdrop for the projects on design, creativity and imagination
Free with trial Watching You series. 3D illustration of symbol of an eye, motion trails and fractal patterns as a metaphor on the subject of information technology, security, privacy, communications. Patterns visualization illustrations Clear Vision. Watching You series. 3D illustration of symbol of an eye, motion trails and fractal patterns as a metaphor on the subject of information technology, security, privacy, communications
Free with trial Stained Glass Forever series. Backdrop design of color fragments, shape patterns and symbols for works on art, space division and design. Patterns visualization illustrations Beyond Color Division. Stained Glass Forever series. Backdrop design of color fragments, shape patterns and symbols for works on art, space division and design
Free with trial Abstract big data flow in network with streams of binary code turning into colorful patterns. Big data visualization. Patterns visualization illustrations Abstract big data flow in network with streams of binary code turning into colorful patterns. Big data visualization
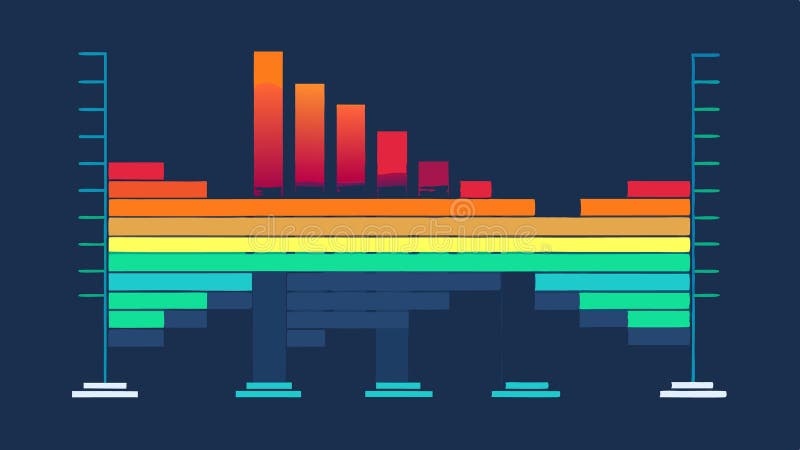
Free with trial This vibrant 3D bar graph showcases data trends and patterns, ideal for business analytics, economic performance visualization, and insight-driven decision-making. Patterns visualization illustrations Colorful 3D Bar Graph Representing Data Trends and Patterns in Business Analytics and Economic Performance Visualization. This vibrant 3D bar graph showcases data trends and patterns, ideal for business analytics, economic performance visualization, and insight-driven decision-making
Free with trial Traffic Patterns Visualization A heat map illustration showing different colors over roadways indicating levels of traffic density as analyzed by an AI system. Patterns visualization illustrations Traffic Patterns Visualization A heat map illustration showing different colors over roadways indicating levels of
Free with trial Analysis and graphs linear icons set. Metrics, Trends, Patterns, Visualization, Data, Correlation, Interpretation vector symbols and line concept signs. Analytics,Insights,Charts illustration. Patterns visualization vectors Analysis and graphs linear icons set. Metrics, Trends, Patterns, Visualization, Data, Correlation, Interpretation line. Analysis and graphs linear icons set. Metrics, Trends, Patterns, Visualization, Data, Correlation, Interpretation vector symbols and line concept signs. Analytics,Insights,Charts illustration
Free with trial Analysis and graphs linear icons set. Metrics, Trends, Patterns, Visualization, Data, Correlation, Interpretation vector symbols and line concept signs. Analytics,Insights,Charts illustration. Patterns visualization vectors Analysis and graphs linear icons set. Metrics, Trends, Patterns, Visualization, Data, Correlation, Interpretation line. Analysis and graphs linear icons set. Metrics, Trends, Patterns, Visualization, Data, Correlation, Interpretation vector symbols and line concept signs. Analytics,Insights,Charts illustration
Free with trial This abstract image features colorful wave patterns made of vibrant lines, evoking a sense of motion and dynamic data visualization in a contemporary artistic style. Patterns visualization illustrations Abstract colorful wave patterns showcasing a blend of vibrant lines and shapes representing data visualization and contemporary. This abstract image features colorful wave patterns made of vibrant lines, evoking a sense of motion and dynamic data visualization in a contemporary artistic style
Free with trial Big data analysis vector line icons set. Analytics, Mining, Storage, Patterns, Visualization, Machine-learning, Clustering illustration outline concept signs and symbols. Patterns visualization vectors Big data analysis vector line icons set. Analytics, Mining, Storage, Patterns, Visualization, Machine-learning
Free with trial Analysis and graphs linear icons set. Metrics, Trends, Patterns, Visualization, Data, Correlation, Interpretation vector symbols and line concept signs. Analytics,Insights,Charts illustration. Patterns visualization vectors Analysis and graphs linear icons set. Metrics, Trends, Patterns, Visualization, Data, Correlation, Interpretation line. Analysis and graphs linear icons set. Metrics, Trends, Patterns, Visualization, Data, Correlation, Interpretation vector symbols and line concept signs. Analytics,Insights,Charts illustration
Free with trial Big data analysis vector line icons set. Analytics, Mining, Storage, Patterns, Visualization, Machine-learning, Clustering illustration outline concept signs and symbols. Patterns visualization vectors Big data analysis vector line icons set. Analytics, Mining, Storage, Patterns, Visualization, Machine-learning
Free with trial The image depicts an eye with a uniquely designed iris that transitions into vibrant colors, resembling a rainbow. Within the iris, there are abstract patterns resembling a bar chart or data visualization, suggesting a blend of biological and analytical themes. The eye appears to be stylized, with a focus on the interplay between organic forms and digital or statistical representations. Patterns visualization vectors Eye with colorful iris and abstract data visualization patterns. The image depicts an eye with a uniquely designed iris that transitions into vibrant colors, resembling a rainbow. Within the iris, there are abstract patterns resembling a bar chart or data visualization, suggesting a blend of biological and analytical themes. The eye appears to be stylized, with a focus on the interplay between organic forms and digital or statistical representations
Free with trial Big data analysis vector line icons set. Analytics, Mining, Storage, Patterns, Visualization, Machine-learning, Clustering illustration outline concept signs and symbols. Patterns visualization vectors Big data analysis vector line icons set. Analytics, Mining, Storage, Patterns, Visualization, Machine-learning
Free with trial Big data analysis vector line icons set. Analytics, Mining, Storage, Patterns, Visualization, Machine-learning, Clustering illustration outline concept signs and symbols. Patterns visualization vectors Big data analysis vector line icons set. Analytics, Mining, Storage, Patterns, Visualization, Machine-learning
Free with trial Abstract swirling fluid dynamics of iridescent liquids, creating mesmerizing, colorful, and fluid patterns. Abstract visualization of swirling, iridescent liquids in dynamic motion, creating. Patterns visualization illustrations Abstract swirling fluid dynamics of iridescent liquids, creating mesmerizing, colorful, and fluid patterns. Abstract visualization
Free with trial The image depicts a mesmerizing visualization of cosmic energy swirling in intricate patterns against a dark backdrop. The bright central light source emits beams of radiance, creating symmetrical waves and circular formations that resemble abstract representations of cosmic phenomena, such as nebulae or the structure of space-time. Patterns visualization illustrations Cosmic swirls and luminous energy patterns in deep space visualization. The image depicts a mesmerizing visualization of cosmic energy swirling in intricate patterns against a dark backdrop. The bright central light source emits beams of radiance, creating symmetrical waves and circular formations that resemble abstract representations of cosmic phenomena, such as nebulae or the structure of space-time
Free with trial A highly detailed, ultra detailed image depicting data visualization abstract. The scene features a swirling vortex of data points forming complex patterns in a a clean white abstract background. The visual style is glowing neon visualization, illuminated by soft ambient glow. The abstract nature allows for versatile use across various data topics. Perfect for technology blogs, corporate. Patterns visualization illustrations Background Digital Art A Swirling Vortex Of Data Points Forming Complex Patterns Data Visualization Abstract. A highly detailed, ultra detailed image depicting data visualization abstract. The scene features a swirling vortex of data points forming complex patterns in a a clean white abstract background. The visual style is glowing neon visualization, illuminated by soft ambient glow. The abstract nature allows for versatile use across various data topics. Perfect for technology blogs, corporate